On the nature of the hard X-ray source IGR J2018+4043
Abstract
We found a very likely counterpart to the recently discovered hard X-ray source IGR J2018+4043 in the multi-wavelength observations of the source field. The source, originally discovered in the 20-40 keV band, is now confidently detected also in the 40-80 keV band, with a flux of . A 5 ks Swift observation of the IGR J2018+4043 field revealed a hard point-like source with the observed 0.5–10 keV flux of 3.410-12 erg cm-2 s-1 (90% confidence level) at , (with a 42 uncertainty). The combined Swift-Integral spectrum can be described by an absorbed power-law model with photon index and cm-2. In archival optical and infrared data we found a slightly extended and highly absorbed object at the Swift source position. There is also an extended VLA 1.4 GHz source peaked at a beam-width distance from the optical and X-ray positions. The observed morphology and multiwavelength spectra of IGR J2018+4043 are consistent with those expected for an obscured accreting object, i.e. an AGN or a Galactic X-ray binary. The identification suggests possible connection of IGR J2018+4043 to the bright -ray source GEV J2020+4023 detected by COS B and CGRO EGRET.
Subject headings:
ISM: individual (-Cygni )—X-rays: individual (IGR J2018+4043; 3EG J2020+4017)1. Introduction
The first hard X-ray imaging observation of the Cygnus region with the IBIS-ISGRI imager (Lebrun et al. 2003) aboard the International Gamma-Ray Astrophysics Laboratory (INTEGRAL; Winkler et al. 2003) has revealed a new source, IGR J2018+4043 (Bykov et al. 2004). The 320 ks fully coded field of view (FCFOV) observation yielded the source flux of in the 25-40 keV band. The Cygnus region is very rich in starforming sites, X-ray binaries, and supernova remnants (SNRs). IGR J2018+4043 is located in the field of the SNR G78.2+2.1 (commonly known as -Cygni SNR). A high-energy -ray source, 2CG 078+2, in the -Cygni field was discovered with the COS B satellite (e.g., Swanenburg et al. 1981). Observations with CGRO EGRET showed that this source (2EG J2020+4026 = 3EG J2020+4017 = GEV J2020+4023), whose photon flux is 1.2 above 100 MeV (Sturner & Dermer 1995; Hartman et al. 1999), is the brightest among apparently steady unidentified EGRET sources. Whipple -ray telescope observations (e.g., Buckley et al. 1998) have established an upper limit of 2.2 for the flux above 300 GeV, indicating a break in the spectrum above a few GeV. Bykov et al. (2004) suggested that the EGRET and ISGRI sources could be the -ray and hard X-ray counterparts of the same source in -Cygni , e.g., a Geminga-like pulsar or extended emission from particles accelerated in the supernova ejecta/shell. In particular, the interaction of the wind of the early type O9V star HD 193322, located just 7′ from IGR J2018+4043, with -Cygni would be a plausible mechanism of particle acceleration. On the other hand, the ISGRI source position within the SNR field does not necessarily imply their physical connection. An example of such a confusion is the source IGR J17204–3554 projected onto the rich Galactic starforming region NGC 6334. The most likely identification of that source is a highly obscured extragalactic object NGC 6334B (see Bassani et al. 2005; Bykov et al. 2006).
Given the nominal 12′ angular resolution (FWHM) and about 1′ point source localization of ISGRI (Lebrun et al. 2003), a reliable identification of the relatively weak (4–5 ) ISGRI source requires high-resolution observations with other instruments. We report here the results of recent 1.5 Ms FCFOV observations of the source with ISGRI (§2.1) and the detection of a counterpart of IGR J2018+4043 in the 0.5–10 keV band with Swift XRT (§2.2). The accurate positioning of the Swift source allowed us to find its possible radio/IR/optical counterparts in archival data (§2.3 and §2.4). Based on these multiwavelength observations, we suggest that the source is a strongly obscured accreting source, likely an AGN, and discuss the possibility that the EGRET source is indeed its -ray counterpart (§3).
2. Observations and Data Analysis
2.1. ISGRI observation
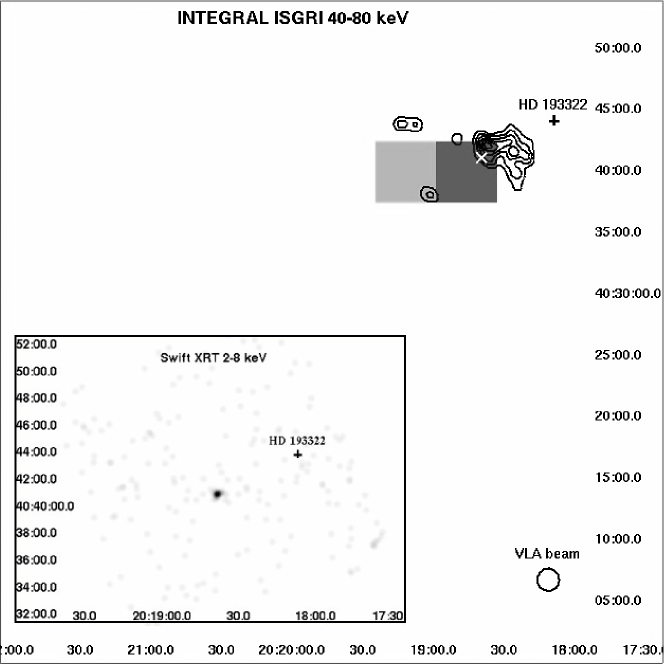
The field of -Cygni has been frequently observed with INTEGRAL ISGRI. We used 1.5 Ms of ISGRI good time archival FCFOV data taken at revolutions 19–255 (2002 Dec 9 – 2005 Nov 16). We applied the selection criteria taking only the science windows where the count rate was within around the mean value determined by the whole 1.5 Ms exposure. The standard reduction was performed with the OSA 5.1 software (Goldwurm et al., 2003). Pixel spreading was switched off for a more accurate flux estimation. Broad energy bands were used to increase S/N. The source was detected with a flux of (1.20.2) 10-11 erg cm-2 s-1 in the 20-40 keV band, and (1.40.4)10-11 erg cm-2 s-1 in the 40-80 keV band, obtained by cross calibration with the Crab (see, e.g., Lubinski et al. 2004). The flux in 20- 40 keV band is below that quoted in Bykov et al. (2004) due to the new background model used in OSA 5 and more conservative selection criteria that we applied now to the much longer exposure dataset available. The 40-80 keV ISGRI significance map is presented in Figure 1.
To search for ISGRI flux variations, we grouped all events in three time bins (the maximum number allowed by the count statistics), but found no significant flux variations. With the scarce statistics available, we can only exclude flux variations greater than a factor of 4 on a timescale of about a year.
2.2. Swift observation
The field of IGR J2018+4043 was observed with Swift XRT (Burrows et al., 2000) on 2006 March 26, 29, and 30, with a total exposure of 4.8 ks (Kennea et al., 2006). The XRT was operated in photon counting mode. The data were reduced with the standard HEAsoft package (ver. 6.0.5). The event files were processed with the xselect tool (grades 0–12 were used). The XSPEC package (ver. 12.1.1) was used for the spectral analysis. A point-like source was detected in the XRT image at a position consistent with that of the ISGRI source (see Fig. 1): =20h18m3855, =+40∘41′004 (J2000), with a position uncertainty of 42 (errors here and below in this subsection are at the 90% confidence level).
We extracted 105 source counts from an aperture of 2 radius and estimated the observed 0.5–10 keV flux erg cm-2 s-1. We fit the spectrum with the absorbed power law model using the C-statistics and obtained the photon index and hydrogen column density cm-2. The unabsorbed 0.5-10 keV flux is erg cm-2 s-1.
The combined Swift-ISGRI spectrum can be fitted with a single power-law model with , cm-2. Based on the positional coincidence and spectral compatibility, we conclude that we detected a Swift counterpart of IGR J2018+4043; we will call this source J2018 hereafter.
Because of the presence of the bright () O9V star HD193322 in the FOV, only W2 and M2 ultraviolet filters were used with the Swift/UVOT camera. The source was not detected in these filters, the upper limits being not constraining given the strong ISM extinction in this direction (see §3).
2.3. VLA data analysis
The radio image at 1.4 GHz was produced from VLA archival data obtained in D configuration on 1996 Sep 19. The data were processed with the MIRIAD software following standard procedures. The source 1411+522 was used as a primary flux density calibrator ( Jy) and 1924+334 as a phase calibrator. The synthesized beam is (beamwidth at half power), P.A. = 33∘, and the rms noise is about 5 mJy/beam.
Figure 1 shows a contour image of the region around J2018, at 1.4 GHz. The J2018 position is within an extended radio feature, of about in size, south-east of the apparent position of radio intensity peak. The total flux density of the radio feature is about 480 mJy. The resolution in D configuration is too low to resolve a possible point source within the structured extended feature. Overall, we cannot rule out the possibilty that the radio source is a counterpart of J2018, although the connection is not very certain yet.
2.4. Optical and infrared data analysis
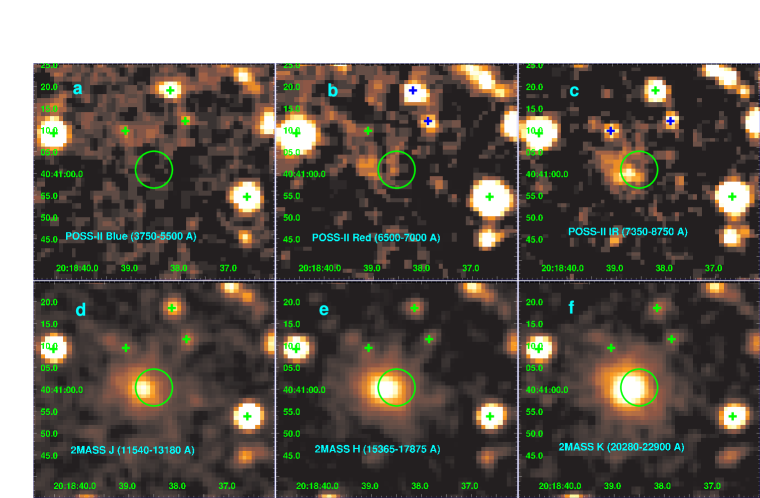
Having the position of J2018 well constrained by the Swift observations, we looked for counterparts of the X-ray source in archival optical and IR data. We found a likely counterpart, with the flux of 889 mJy at 8.28 m, in the 6th MSX catalog (Egan et al., 2003) at = 20h18m391, (about positional accuracy). We also found an extended NIR source centered at = 20h18m3873, = +40∘41′001 (26 from the Swift position) in the 2MASS XSC catalog (Skrutskie et al., 2006), with magnitudes , , (Fig. 2). These magnitudes are brighter than reported by Kennea et al. (2006) because those authors did not account for source extension.
The optical images, taken from the POSS-II survey (Reid et al., 1991), are also shown in Figure 2. A counterpart to J2018 can be seen in the POSS-Red (5878-7121 Å) and POSS-IR (6939-9030 Å) filters at the same position as the 2MASS source, and with a similar spatial extent.
We estimated the fluxes of the extended optical source, using the magnitudes of two nearby stars from the GSC 2.3 catalog (McLean et al., 2000), marked with blue crosses in panels b and c of Figure 2. We estimated and via aperture count-rate calculations. The absence of the source in the POSS-II Blue image yields an upper limit . The aperture boundaries were set at the count rate corresponding to half a difference between the brightest source pixel value and the local background level. Two reference stars in each band were used to estimate the zero-point and the count-rate vs. magnitude dependence. The same local background was subtracted from all the count rates, normalized by the aperture size. To convert the magnitudes into fluxes, we used the and POSS-II magnitudes of the standard secondary spectrophotometric objects HZ 4 and G191B2B (Oke, 1990) and obtained Jy, mJy, = 0.76 mJy for the optical source. We estimate the error of the cross-calibration, about 20%, to be mainly due to the extended nature of the source.
3. Discussion
The Swift-ISGRI spectrum of J2018 shows that it is a nonthermal, highly obscured source. The hydrogen column density estimated from the Swift data (§2.2) looks too high for an object in the -Cygni SNR ( kpc, expected – cm-2; Landecker et al. 1980). J2018 is likely a more distant object, not associated with -Cygni .
A number of ISGRI sources have been identified as Galactic X-ray binaries, mostly HMXBs (e.g., Filliarte & Chaty 2004; Tomsick et al. 2006, and references therein). The J2018’s X-ray spectrum (§2.2) and luminosity, ergs s-1 in 1–80 keV range, as well as the magnitudes of the IR-optical counterpart (§2.4) do not contradict such an interpretation. The apparent extension of the optical and 2MASS counterparts could be associated with a powerful wind of an HMXB’s O or B companion. Alternatively, the extended IR-optical source could be interpreted as a galaxy that hosts an AGN detected in X-rays.
An extrapolation of the X-ray spectrum of J2018 into the EGRET range reaches the flux level of GEV J2020+4023, which suggests that these sources could be X-ray and -ray counterparts of the same object. An extensive dedicated search for a counterpart to 3EG J2020+4017 with Chandra and the Green Bank radio telescope in a close vicinity of its nominal position failed to show any clear candidate object (Becker et al. 2004; Weisskopf et al. 2006). However, J2018 is located outside the fields of these searches.
The position of J2018 is 306 (355) offset from the nominal position of GEV J2020+4023 (3EG J2020+4017), exceeding the () 95% localization accuracy in those catalogs (Lamb & Macomb 1997; Hartman et al. 1999). However, such offsets are not unusual among EGRET sources. The position accuracy of relatively faint EGRET sources in the Galactic plane was estimated by Gehrels et al. (2001) as . Moreover, even the very bright Vela and Geminga pulsars are located outside their EGRET 99% confidence contours (see Hartman et al. 1999). 3EG J2020+4017 is a bright source, but it is located in a very crowded region of the plane, with enhanced, highly inhomogeneous diffuse emission from the -Cygni SNR and nearby molecular clouds, and at least two other EGRET sources (3EG J2021+3716 and J2016+3657) within the 3∘ vicinity, which may have affected the source localization. In such an environment, systematic uncertainties can increase the localization error up to 05. Thus, despite the positional discrepancy, we believe that one can consider the possibility that Swift-ISGRI and EGRET detected the same source. Future GLAST (e.g., Gehrels & Michelson 1999) observation could resolve the issue.

It is also worth mentioning the detection of a possible Fe Kα feature at 6.2 keV in the RXTE spectrum of -Cygni (Bykov et al. 2004). The feature, which could be attributed to a putative hidden accreting source (e.g., an AGN), does not appear in the ASCA spectra of the -Cygni regions observed by this satellite, which did not include the J2018 position, while this position was well within the RXTE collimator field.
To investigate the nature of J2018, we constructed its spectral energy distribution (SED; Fig. 3) using the ISGRI and Swift observations and the archival data described above. It should be noted that the data are noncontemporaneous, which is a point of some concern because the source could be variable. The Galactic absorption () was accounted for in the unabsorbed NIR-optical spectrum using the reddening maps by Schlegel et al. (1998)111See also http://irsa.ipac.caltech.edu/applications/DUST/. Being rather accurate for high latitude sources, the method often overestimates the reddening by a factor of up to 1.5 for strongly reddenned objects (Arce & Goodman 1999). The optical emission is apparently extended, but with the data available it is not possible to disentangle the core component, corresponding to the point source detected by Swift, from the extended halo. Therefore, the optical points can be lower than shown in Figure 3, and the extinction corrected (with ) optical fluxes in Figure 3 should be regarded as upper limits, because of a possible overestimation (up to 3 mag) in the used.
The hypothesis that the 1.4 GHz VLA excess is due to a point-like source at the Swift source position (e.g., an AGN) projected onto an extended radio source is not in conflict with the data available. Therefore, we conditionally include the VLA point, as well as the EGRET data, in Figure 3. Within a more conservative approach, they should be regarded as upper limits.
The radio through hard X-ray SED in Figure 3 is consistent with that expected for a nearby Seyfert AGN or a radio-galaxy (e.g., Dermer & Gehrels 1995). For instance, at the source luminosity below 100 keV would be about ergs s-1.
If GEV J2020+4023 is indeed associated with J2018, then the radio through -ray source could be a blazar. Given the uncertainties discussed above, the multiwavelength spectrum resembles the two-peak synchrotron self-Compton SED of S5 0716+714, a blazar studied by Foschini et al. (2006). Simultaneous multiwavelength observations are required, however, to verify the blazar hypothesis and understand the processes responsible for such a spectrum. On the other hand, the leptonic jet model for a microquasar, such as discussed by Dermer & Böttcher (2006) for LS 5039, also provides a SED generally consistent with that given in Figure 3.
NIR and optical spectroscopy could distinguish between the two interpretations by measuring the redshift of the galaxy that hosts the putative AGN. Also, microquasars are usually variable on minutes scale, while AGNs are variable on longer time scales making a variability study conclusive.
The analysis given above allows us to conclude that the properties of the source discovered by Swift are consistent with those of IGR J2018+4043 . However, that does not exclude a sizable extended hard X-ray flux from the possible interaction of the -Cygni SNR with stellar winds as discussed by Bykov et al. (2004). The extended VLA feature seen in Figure 1 can also be attributed to the SNR-wind interaction. High-resolution observations with Chandra and XMM-Newton, as well as simultaneous multiwavelength studies, are needed to separate the components and to make a firm conclusion on the nature of IGR J2018+4043.
References
- Arce & Goodman (1999) Arce, H. G., & Goodman, A. A. 1999, ApJ, 512, L135
- Bassani et al. (2005) Bassani, L., et al. 2005, ApJ, 634, L21
- Becker et al. (2004) Becker, W., et al. 2004, ApJ, 615, 875
- Buckley et al. (1998) Buckley, J.H., et al. 1998, A&A, 329, 639
- Burrows et al. (2000) Burrows, D.N., et al. 2000, Proc. SPIE, 4140, 64
- Bykov et al. (2004) Bykov, A.M., et al. 2004, A&A, 427, L21.
- Bykov et al. (2006) Bykov, A.M., et al. 2006, A&A, 449, 917
- Dermer & Gehrels (1995) Dermer, C.D. & Gehrels, N. 1995, ApJ, 447, 103
- Dermer & Böttcher (2006) Dermer, C.D. & Böttcher, M. 2006, ApJ, 643, L13
- Egan et al. (2003) Egan, M.P., Price, S.D., Kraemer, K.E. 2003, AAS Meeting 203, #58.07
- Filliatre & Chaty (2004) Filliatre, P. & Chaty, S. 2004, ApJ, 616, 469
- Foschini (2006) Foschini, L et al. 2006, A&A (in press), astro/ph 0604600.
- Gehrels et al. (2001) Gehrels, N., Macomb, D.J., Bertsch, D.L., Thompson, D.J., Hartman, R.C., Mattson, B.J., 2001, in: The Nature of Unidentified Galactic High Energy Gamma-ray Sources, eds. A.Carramiana et al. (Kluwer: Dordrecht), 81
- Gehrels & Michelson (1999) Gehrels, N., Michelson, P. 1999, Astropart. Phys., 11, 277
- Goldwurm et al. (2003) Goldwurm, A., et al. 2003, A&A, 411, L223
- Hartman et al. (1999) Hartman, R.C., et al. 1999, ApJS, 123, 79
- Kennea et al. (2006) Kennea, J., et al. 2006, The Astronomer’s Telegram, 788.
- Landecker et al. (1980) Landecker, T., Roger, R., Higgs, L. 1980, A&AS, 39, 133
- Lamb & Macomb (1997) Lamb, R. C. & Macomb, D.J. 1997, ApJ, 488, 880
- Lebrun et al. (2003) Lebrun, F., et al. 2003, A&A, 411, L141
- Lubinski et al. (2004) Lubinski, P., Dubath, P., Kretschmar, P., Pottschmidt, K., Walter, R. 2004, Proc. 5th INTEGRAL Workshop, ESA SP-552, eds. V. Schönfelder, G. Lichti & C. Winkler (ESA: Munich), 871
- McLean et al. (2000) McLean, B.J., Greene, G.R., Lattanzi, M.G., Pirenne, B. 2000, ADASS IX, ASP Conf. Proc., 216, eds. N. Manset, C. Veillet & D. Crabtree, 145
- Oke (1990) Oke, J.B. 1990, AJ, 99, 1621
- Reid et al. (1991) Reid, I.N. et al. 1991, PASP, 103, 661
- Schlegel et al. (1998) Schlegel, D.J., Finkbeiner, D.P., Davis, M. 1998, ApJ, 500, 525
- Skrutskie et al. (2006) Skrutskie, M.F. et al. 2006, AJ, 131, 1163
- Sturner & Dermer (1995) Sturner, S.J., Dermer, C.D. 1995, A&A, 293, L17
- Swanenburg et al. (1981) Swanenburg, B.N. et al. 1981, ApJ, 243, L69
- Tomsick et al. (2006) Tomsick, J., Chaty, S., Rodriguez, J., Foschini, L., Walter, R., & Kaaret, P. 2006, astro-ph/0603810
- Weisskopf et al. (2006) Weisskopf, M.C. et al. 2006, ApJ (submitted), astro-ph/0606596
- Winkler et al. (2003) Winkler, C., et al. 2003, A&A, 411, L1