Diagnostics of the Heating Processes in Solar Flares Using Chromospheric Spectral Lines
Abstract
We have calculated the H and Ca ii 8542 Å line profiles based on four different atmospheric models, including the effects of nonthermal electron beams with various energy fluxes. These two lines have different responses to thermal and nonthermal effects, and can be used to diagnose the thermal and nonthermal heating processes. We apply our method to an X-class flare that occurred on 2001 October 19. We are able to identify quantitatively the heating effects during the flare eruption. We find that the nonthermal effects at the outer edge of the flare ribbon are more notable than that at the inner edge, while the temperature at the inner edge seems higher. On the other hand, the results show that nonthermal effects increase rapidly in the rise phase and decrease quickly in the decay phase, but the atmospheric temperature can still keep relatively high for some time after getting to its maximum. For the two kernels that we analyze, the maximum energy fluxes of the electron beams are 1010 and 1011 ergs cm-2 s-1, respectively. However, the atmospheric temperatures are not so high, i.e., lower than or slightly higher than that of the weak flare model F1 at the two kernels. We discuss the implications of the results for two-ribbon flare models.
1 Introduction
Solar flares are one of the most significant active phenomena in the solar atmosphere. At present the widely accepted flare model based on magnetic reconnection is the CSHKP model, which was developed by Carmichael (1964), Sturrock (1966), Hirayama (1974) and Kopp & Pneuman (1976). The model assumes that pre-existing closed magnetic loops in the corona are torn open by the force of the filament eruption as a result of magnetic instability. Subsequently, a current sheet is stretched out and energy stored in the magnetic field is released at the reconnection point. As a consequence, a cusp-shaped loop structure appears which was observed by Yohkoh in soft X-rays (Tsuneta et al., 1992) and by in hard X-rays (HXRs) (Sui & Holman, 2003). As successive magnetic reconnection goes on, the loop top HXR source (Masuda et al., 1994) rises (Sui et al., 2004; Liu et al., 2004) and the footpoint sources separate from each other (Fletcher & Hudson, 2001; Liu et al., 2004). Recent observations reveal a more HXR source above the flare loop, called the coronal source (Sui et al., 2004). The temperature in between the loop top and the coronal source is found to be higher than that in lower and higher altitudes; therefore, this place is regarded as associated with the formation and development of a current sheet.
It is known that the primary energy release during a solar flare (the current sheet) is in the corona. The released energy results in a bulk heating of the plasma and acceleration of charged particles. Therefore, the chromosphere can be heated by either a conduction front or electron beam bombardment (Brown, 1973; Canfield, 1974; Brown et al., 1978; Emslie, 1978). Other energy transport processes, such as heating by an energetic proton beam (Lin & Hudson, 1976; Emslie, 1983; Hénoux et al., 1993) and soft X-ray irradiation (Hénoux & Nakagawa, 1977; Machado, 1978; Gan & Fang, 1990; Berlicki & Heinzel, 2004) have also been invoked. Many studies have been devoted to the spatial distribution and temporal evolution of the thermal/nonthermal heating signatures. Canfield et al. (1993) argued that energetic electrons favor to occur at the edge of high vertical currents. This is confirmed by Masuda et al. (2001) that the spectrum tends to be harder at the outer edge of a ribbon than in the inner edge. Czaykowska et al. (1999) found that strong upflows, revealed by the blue shifts in EUV lines, appear at the outer edges of flare ribbons. Li & Ding (2004) showed that chromospheric downflows, revealed by the red asymmetries in the H lines, are also the most obvious at the outer edges. These findings are basically consistent with the two-ribbon flare model, in which the outer edges map the footpoints of newly reconnected flare loops. The general scenario of flare evolution implies that the thermal/nonthermal heating processes can vary both spatially and temporally. Therefore, it is interesting to devise a method to diagnose the relative importances of thermal and nonthermal heating processes in a flare.
The purpose of this paper is to use two different chromospheric lines, H and Ca ii 8542 Å lines, to diagnose the heating processes in flares. The H line is the most observed and studied chromospheric line in solar flare spectroscopy. Theoretical calculations have shown how the H line varies with different flare parameters like the nonthermal electron flux, conduction flux, and coronal pressure (Ricchiazzi & Canfield, 1983; Canfield et al., 1984). In particular, when considering the nonthermal excitation and ionization effects by electron beam, the H line can be enhanced significantly (Fang et al., 1993; Kašparová & Heinzel, 2002) . On the other hand, the Ca ii 8542 Å line is less sensitive to the nonthermal effects, though also enhanced to some extent. This line is more influenced by the coronal pressure and chromospheric temperature. The different responses of the H and Ca ii 8542 Å lines to thermal/nonthermal effects make it possible to diagnose the heating processes using these two lines together.
We make non-LTE calculations of the H and Ca ii 8542 Å line intensities for different atmospheric models and nonthermal electron beams. The results are used to diagnose the processes of a flare on 2001 October 19 in detail. The paper is organized as follows. The method for model calculations is given in §2. Theoretical results are presented in §3. §4 shows the diagnostics of the flare, followed by discussions and conclusions in §5.
2 Method of model calculations
The flare eruption is a very complicated process in the solar atmosphere. It involves a drastic change of the atmospheric conditions subject to a time-varying energy input. Semi-empirical models have been widely used to reproduce the observed flare spectra (e.g. Machado et al. (1980); Gan & Fang (1987)). For simplicity, we adopt four atmospheric models to represent the atmospheric status at different phases of a flare. The temperature distributions versus column mass density of the four models are showed in Figure 1. FQ is the model for the quiet-Sun (Vernazza et al., 1981) which can be regarded as the preflare status. F1 and F2 are weak and strong flare models, respectively (Machado et al., 1980). FA is an interpolation between F1 and F2. Therefore, the sequence FQ-F1-FA-F2 represents roughly the variation behavior of a flare atmosphere. In general, from FQ to F2, the chromospheric temperature becomes higher, the transition region tends to be lower, and the coronal pressure increases. The temperature in the photosphere has almost no change in these models.
On the other hand, the role of the electron beam should be taken into account in the model calculations. Considering the variation of the electron beam as revealed by the HXR observations, we adopt five different energy fluxes 0, 109, 1010, 1011, and 1012 ergs cm-2 s-1 for each model. We assume a power law distribution for the electron beam with a spectral index and low-energy cutoff =20 keV. In fact, the calculated results are not affected much by the latter two parameters.
Therefore, we make non-LTE calculations based on the atmospheric models with different electron beams to get the line profiles of H and Ca ii 8542 Å. We include the nonthermal excitation and ionization effects by the electron beam in the calculations. Each model and each electron beam yield a specific set of the H and Ca ii 8542 Å profiles.
3 Theoretical line profiles
Figures 2 and 3 show the theoretical profiles of H and Ca ii 8542 Å, respectively. In each panel, the profiles are for the same atmospheric model but different electron beam fluxes. It can be seen that the H and Ca ii 8542 Å lines have quite different responses to the model parameters, in particular, the electron beam flux. As the flux increases, the H line intensity is enhanced greatly and the profile becomes broadened; at the same time, the central reversal of the H profile becomes more obvious. These features are typical characteristics of hydrogen Balmer lines under the circumstance of nonthermal heating. However, the Ca ii 8542 Å line is less sensitive to the nonthermal electron beam especially for fluxes higher than 1010 ergs cm-2 s-1. Considering these facts, we find a convenient parameter that can be used to reflect the different responses of the two lines to the nonthermal effects, that is, the wavelength-integrated intensity as described by
| (1) |
In equation (1), is the continuum intensity, and and are the line intensities for the flare and the quiet-Sun, respectively. As for the integration range, we adopt Å for H and 1 Å for Ca ii 8542 Å, respectively. The merit of using such a wavelength-integrated quantity is that this value is independent of the macro-turbulent velocity, which can affect the profiles greatly. In fact, the parameter defined by equation (1) is similar to the equivalent width of lines. Therefore, we will use the term “equivalent width (EW)” instead of “wavelength-integrated intensity” hereafter.
We note that in the cases of non-quiet models, the far wings of line profiles are slightly above zero after subtraction of the quiet profile. This is not the extension of broad wing emission, but just reflects a very small continuum enhancement in these models relative to the quiet-Sun.
Figure 4 shows the equivalent width of Ca ii 8542 Å against that of H. Each solid line refers to the same atmospheric model. The five asterisks from left to right denote different nonthermal electron beam fluxes of 0, 109, 1010, 1011, and 1012 ergs cm-2 s-1, respectively. The curve shows that the equivalent width of H increases very quickly with increasing nonthermal effects. However, the Ca ii 8542 Å equivalent width is more sensitive to the thermal models when the flux is higher than 1010 ergs cm-2 s-1. We can superimpose the observational points (the observed set of Ca ii 8542 Å versus H equivalent widths) on this EW-EW plot. The trajectory of the observational points reflects the time evolution of the model atmosphere and the electron beam. From this, we can also judge the relative importances of the thermal and nonthermal heating processes. For example, if the trajectory is mostly along the solid lines, then the nonthermal effects dominate; otherwise, if the trajectory is across the solid lines, then the thermal heating is more important. For most cases, both of these two effects work together during the flare evolution.
There are some limitations of the above method to diagnose the flare processes. First, the heating mechanisms during solar flares are so complicated; there are some other factors than the effects of temperature rise and nonthermal electron beam, such as the return current (see §5), that can influence the line intensities. Second, we use a fixed spectral index and low-energy cutoff that can in fact vary during the flare. Third, using of the equivalent width sacrifices some useful characteristics like the shift and asymmetry of the line profile. However, owing to the lack of our knowledge of some physical parameters, in particular the macro-turbulent velocity, such a method is still a simple and practical method to diagnose thermal/nonthermal processes in flares.
4 Diagnostics to the 2001 October 19 flare
4.1 Observation
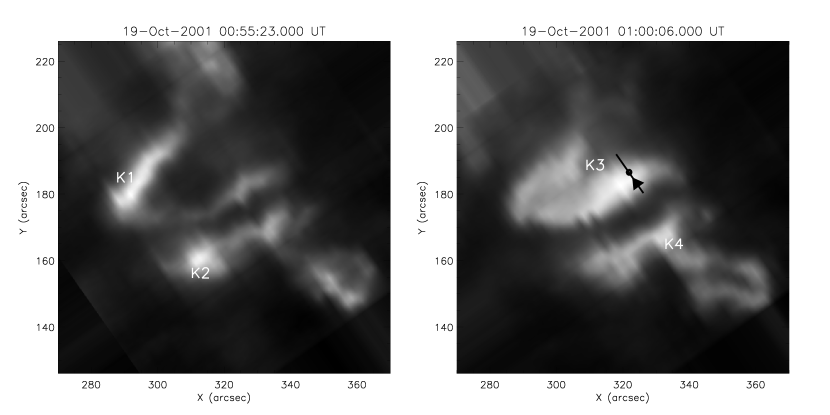
A two ribbon flare occurred in NOAA Active Region 9661 (N16∘, W18∘) on 2001 October 19. According to the , it is an X1.6/2B class flare associated with a CME event. The flare lasted from 00:47 UT to 01:13 UT, reaching its maximum at 01:05 UT. Observations of H and Ca ii 8542 Å line profiles were made by the Solar Tower of Nanjing University (Huang et al., 1995; Ding et al., 1999). The flare was well observed from the beginning to the end. An analysis of the multi-wavelength data has been done by Li & Ding (2004). The results can be summarized as follows. The maximum velocity seems to be located at the outer edges of the flare ribbons. The flare ribbons contain four H kernels denoted as K1, K2, K3, and K4 (Fig. 5). They are associated with two hard HXR peaks, respectively (Fig. 6). Kernels K1 and K2 correspond to the first peak at 00:55:23 UT while kernels K3 and K4 correspond to the second peak at 01:00:06 UT. In this paper, we select kernels K2 and K3 for study. They belong to two different flare loops. Kernel K2 is associated with a weak HXR source while K3 is related to a strong HXR source. The relative importance of thermal conduction and nonthermal electron beam may therefore differ in the two kernels.
4.2 Temporal evolution
We extract the observed line profiles at the brightest points in kernels K2 and K3. Since the brightest point can vary in space with time, we fix it to be the one during the flare maximum time. A time series of line profiles are thus obtained for each kernel. The observed equivalent width is calculated in the same way as the theoretical one. We can then compare the observations with theoretical calculations.
Figure 7 shows the time evolution of kernel K2 in the EW-EW plot from 00:51:26 UT to 00:56:18 UT. In the rise phase of the flare, the temperature of the atmosphere increases until the maximum phase. At the same time, the nonthermal electron beam flux varies from 0 to greater than 1010 ergs cm-2 s-1. During the gradual phase, the trajectory of the observational points goes back nearly along the initial path, only that the nonthermal electron beam is weaker and the temperature is a little higher than in the rise phase. In general, these two effects are not so strong in kernel K2. This is consistent with the fact that kernel K2 corresponds to a weak HXR source.
Figure 8 shows the temporal evolution of kernel K3 from 00:53:49 UT to 01:45:56 UT. It is associated with a strong HXR source. During the rise phase, the nonthermal electron flux increases very rapidly and reaches a quite high value before the maximum phase. The maximum flux is even greater than 1011 ergs cm-2 s-1. At the same time, the temperature is also enhanced but not so obvious considering the very strong electron beam. The temperature is only a little higher than that of the F1 model but lower than that of the FA model. In the gradual phase, the nonthermal electron flux decreases quickly; however, the atmosphere can keep hot for some time. Compared to kernel K2 that is associated with a weak HXR source, the nonthermal electron flux at kernel K3 is much larger. This is consistent with HXR observations.
4.3 Spatial distribution
To check the spatial distribution of the heating signatures, we draw a line across the flare ribbon containing kernel K3. Twenty points are selected along the line with a uniform space. The trajectory of these observational points from the inner edge to the outer edge in the EW-EW plot is shown in Figure 9. From the inner to outer edges, the nonthermal effects become more and more obvious. Nonthermal electron flux varies from less than 1010 ergs cm-2 s-1 to greater than 1011 ergs cm-2 s-1. The position where the nonthermal effect gets to its maximum is denoted by a solid circle superimposed on the line in Figure 5. Obviously, it is located at the outer edge of the flare ribbon. Generally speaking, the nonthermal effects at the outer edge of the flare ribbon are more significant than at the inner part. On the contrary, the atmospheric temperature is higher at the inner edge than at the outer edge.
5 Discussions and conclusions
In general, the heating mechanisms during a solar flare are complicated, i.e., a combination of different processes. Thermal conduction and nonthermal electron beam bombardment are the two mostly discussed and important energy transport processes. Many studies are focused on solving this controversial and undetermined problem. Saint-Hilaire & Benz (2005) deduced the thermal and nonthermal energies for a flare and found that they are of the same magnitude. However, in some other flares or in a specific phase or specific region of flares, it is possible that either thermal heating or nonthermal heating is dominant (e.g. Li et al. (2005); Ji et al. (2004)). If seen in chromospheric lines, the thermal component in the light curve is thought to be delayed by some time compared to the nonthermal component. This time delay is case-dependent. Usually we cannot easily separate the thermal and nonthermal components from the light curve only. The detailed spectra provide a diagnostic tool to distinguish these two components.
Previous studies have shown that the nonthermal excitation and ionization effects caused by an electron beam bombardment have a great influence on chromospheric line profiles (Fang et al., 1993). Since the H and Ca ii 8542 Å lines have different responses to thermal and nonthermal processes as discussed above, we can diagnose different heating mechanisms using the observations of the two lines. In this work, we simply use the equivalent widths of the lines, which refrains us from invoking some unclear parameters like the macro-turbulent velocity. Of course, the HXR emission is closely related to nonthermal electrons; however, the thermal heating effects can better be studied through checking chromospheric lines. In our analysis, we choose two lines, one of which is sensitive to thermal effects while another is sensitive to nonthermal effects, to diagnose these two heating processes. This method is tested to be practical and useful. Recently, Karlický et al. (2004) argued that the return current collision and excitation could significantly enhance the line radiation. If considering this effect, the deduced flux of the nonthermal electron beam should be somewhat lower. However, this does not influence our main conclusions.
The spatial distribution and temporal evolution of thermal and nonthermal effects during a solar flare are also complex. Li & Ding (2004) concluded that the chromospheric downflow velocity tends to appear at the outer edge of flare ribbons. This indicates that the nonthermal effects at the outer edge of flare ribbons are the most significant. In the current work, by using a novel and different method, we also find that in the 2001 October 19 flare, the nonthermal effects at the outer edge are more distinct than that at the inner edge of flare ribbons. However, the chromospheric temperature at the inner edge seems higher than that at the outer part. The above results support the general scenario of flare development: successive magnetic reconnection occurs to form new flare loops whose footpoints are shown as the outer edge of flare ribbons. It is conceivable that in the newly formed loops, the nonthermal effects are more obvious than in the old loops. At the two kernels K2 and K3 in the 2001 October 19 flare, the electron beam fluxes increase quickly in the initial phase and decrease rapidly in the gradual phase while the thermal effects change gradually.
References
- Benz & Grigis (2002) Benz, A. O, & Grigis, P. C. 2002, Sol. Phys., 210, 431
- Berlicki & Heinzel (2004) Berlicki, A., & Heinzel, P. 2004, A&A, 420, 319
- Brown (1973) Brown, J. C. 1973, Sol. Phys., 31, 143
- Brown et al. (1978) Brown, J. C., Canfield, R. C., & Robertson, M. N. 1978, Sol. Phys., 57, 399
- Canfield (1974) Canfield, R. C. 1974, Sol. Phys., 34, 339
- Canfield et al. (1980) Canfield, R. C., & Ricchiazzi, P. J. 1980, ApJ, 239, 1036
- Canfield et al. (1984) Canfield, R. C., Gunkler, T. A., & Ricchiazzi, P. J. 1984, ApJ, 282, 296
- Canfield et al. (1993) Canfield, R. C., et al. 1993, ApJ, 411, 362
- Carmichael (1964) Carmichael, H. 1964, in Physics of Solar Flares, ed. W. N. Hess (NASA SP-50; Washington DC: NASA), 451
- Czaykowska et al. (1999) Czaykowska, A., De Pontieu, B., Alexander, D., & Rank, G. 1999, ApJ, 521, L75
- Ding et al. (1999) Ding, M. D., Fang, C., Ying, S. Y., & Chen, P. F. 1999, A&A, 348, L29
- Emslie (1978) Emslie, A. G. 1978, ApJ, 224, 241
- Emslie (1983) Emslie, A. G. 1983, Sol. Phys., 86, 133
- Fang et al. (1993) Fang, C., Hènoux, J. C., & Gan, W. Q. 1993, A&A, 274, 917
- Fletcher & Hudson (2001) Fletcher, L., & Hudson, H. S. 2001, Sol. Phys., 187, 229
- Gan & Fang (1987) Gan, W. Q., & Fang, C. 1987, Sol. Phys., 107, 311
- Gan & Fang (1990) Gan, W. Q., & Fang, C. 1990, ApJ, 358, 328
- Grigis & Benz (2004) Grigis, P. C., & Benz, A. O. 2004, A&A, 426, 1093
- Grigis & Benz (2005) Grigis, P. C., & Benz, A. O. 2005, A&A, 434, 1173
- Hénoux et al. (1993) Hénoux, J. C., Fang, C., & Gan, W. Q. 1993, A&A, 274, 923
- Hénoux & Nakagawa (1977) Hénoux, J. C., & Nakagawa, Y. 1977, A&A, 57, 105
- Hirayama (1974) Hirayama, T. 1974, Sol. Phys., 34, 323
- Huang et al. (1995) Huang, Y. R., Fang, C., Ding, M. D., Gao, X. F., Zhu, Z. G., Ying, S. Y., Hu, J., & Xue, Y. Z. 1995, Sol. Phys., 159, 127
- Ji et al. (2004) Ji, H. S., Wang, H. M., Schmahl, E. J., Qiu, J., & Zhang, Y. N. 2004, ApJ, 605, 938
- Karlický et al. (2004) Karlický, M., Kašparová, J., & Heinzel, P. 2004, A&A, 416, 13
- Kašparová & Heinzel (2002) Kašparová, J., & Heinzel, P. 2002, A&A, 382, 688
- Kopp & Pneuman (1976) Kopp, P. A., & Pneuman, G. W. 1976, Sol. Phys., 50, 85
- Li et al. (2005) Li, H., Berlicki, A., & Schmieder, B. 2005, A&A, 438, 325
- Li & Ding (2004) Li, J. P., & Ding, M. D. 2004, ApJ, 606, 583
- Lin & Hudson (1976) Lin, R. P., & Hudson, H. S. 1976, Sol. Phys., 50, 153
- Liu et al. (2004) Liu, W., Jiang, Y. W., Liu, S. M., & Petrosian, V. 2004, ApJ, 611, 53
- Masuda et al. (1994) Masuda, S., Kosugi, T., Hara, H., Tsuneta, S., & Ogawara, Y. 1994, Nature, 371, 495
- Masuda et al. (2001) Masuda, S., Kosugi, T., & Hudson, H. S. 2001, Sol. Phys., 204, 55
- Machado (1978) Machado, M. E. 1978, Sol. Phys., 60, 341
- Machado et al. (1980) Machado, M. E., Avrett, E. H., Vernazza, J. E., & Noyes, R. W. 1980, ApJ, 242, 336
- McClymont & Canfield (1983) McClymont, A. N., & Canfield, R. C. 1983, ApJ, 265, 483
- Ricchiazzi & Canfield (1983) Ricchiazzi, P. J., & Canfield, R. C. 1983, ApJ, 272, 739
- Saint-Hilaire & Benz (2005) Saint-Hilaire, P., & Benz, A. O. 2005, A&A, 435, 743
- Sturrock (1966) Sturrock, P. A., 1966, Nature, 211, 695
- Sui & Holman (2003) Sui, L. H., & Holman, G. D. 2003, ApJ, 596, 251
- Sui et al. (2004) Sui, L. H., Holman, G. D., & Dennis, B. R. 2004, ApJ, 612, 546
- Tsuneta et al. (1992) Tsuneta, S., Hara, H., Shimizu, T., Acton, L. W., Strong, K. T., Hudson, H. S., & Ogawara, Y. 1992, PASJ, 44, L63
- Vernazza et al. (1981) Vernazza, J. E., Avrett, E. H., & Loeser, R. 1981, ApJS, 45, 635