SF2A 2006
Plasma diagnostic of a solar prominence from hydrogen and helium resonance lines
Abstract
We present the first comparison of profiles of H et He resonance lines observed by SUMER with theoretical profiles computed with our non-LTE radiative transfer code. We use the H i Lyman , H i Lyman , and He i 584 Å lines. Our code allows us to obtain the plasma parameters in prominences in conjunction with a multi-line, multi-element set of observations. The plasma temperature in the prominence core is K and the pressure is 0.03 dyn cm-2. The Ly line is formed in a higher temperature region (more than 11 000 K).
1 Introduction
The H and He resonance lines have a strong diagnostic potential. However, observations are difficult to interpret as the prominence plasma is optically thick at these wavelengths and out of LTE. It is thus necessary to use a non-LTE radiative transfer code to analyse the data.
2 Observations and modelling
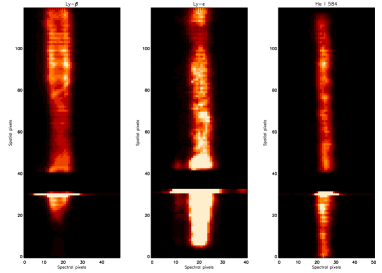
Observations were made during the 13th MEDOC campaign (IAS) on 2004, June 15. The SUMER slit centre was located at , . On Fig. 1 we note the det. A anomaly around pixel 30: a dark area surrounded by bright pixels. We select one large area between pixels 70 and 100 to represent the prominence plasma. The Ly line exhibits a central reversal on several pixels.
The numerical code solves the equations of radiative transfer and statistical equilibrium for H, He i, and He ii. Details are given in Labrosse & Gouttebroze (2001, 2004). The prominence is represented by a 1D vertical plane-parallel slab. We consider 2 types of prominence atmospheres: constant temperature and pressure within the prominence, or with a prominence-to-corona transition region (PCTR). In the latter case the temperature and pressure profiles are of the same type as proposed by Anzer & Heinzel (1999).
3 Results
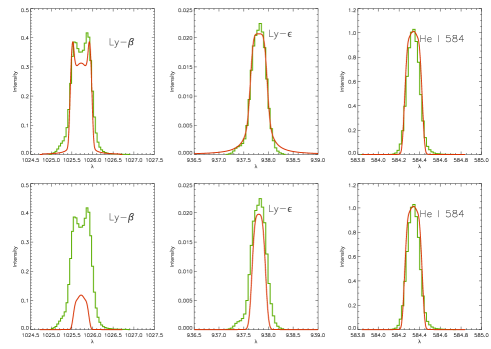
The top plots on Fig. 2 show each line profile observed by SUMER and the theoretical profile which best fits the observed profile. We obtain a different model for each line (see Tab. 1). Each one of the three selected models is isothermal and isobaric. The PCTR models considered here cannot reproduce the observed profiles for this prominence. We also searched for a unique model that simultaneously reproduces the three line profiles. The result is shown on the three bottom panels of Fig. 2. The selected model is the same as the one which best fits the observed He i 584 line alone (our model # 3), but it fails to reproduce the Ly line. There is a long-standing problem regarding the Ly- line (see, e.g., Patsourakos & Vial 2002). Some possible explanations are: 1) We may need a different type of temperature profile for this particular prominence. 2) The fine structure of the prominence should be incorporated in the modelling. 3) The incident radiation illuminating the structure is strongly affected by the presence of several active regions on the disk seen on MDI images of the same day.
| Model | Line | ||||||||
|---|---|---|---|---|---|---|---|---|---|
| 1 | Ly- | 11155 | 0.075 | 3.48 10-6 | 584 | 19 | 3627 | 2 | 1 |
| 2 | Ly- | 6677 | 0.414 | 1.12 10-5 | 127 | 13 | 73198 | 26 | 3 |
| 3 | 584 | 8602 | 0.029 | 4.50 10-7 | 128 | 18 | 94333 | 0.5 | 0.1 |
4 Conclusion
The plasma temperature in the core of the observed prominence is found to be K and the pressure is 0.03 dyn cm-2. The Ly line is formed in a higher temperature region (more than 11 000 K). The He i line at 584 Å has been succesfully used for the diagnostic of the prominence. The combination of the helium resonance lines with the Lyman lines of hydrogen provides new constraints for prominence models.
References
- [1] Anzer, U. & Heinzel, P, 1999, A&A, 349, 974
- [2] Labrosse, N. & Gouttebroze, P., 2001, A&A, 380, 323
- [3] Labrosse, N. & Gouttebroze, P., 2004, ApJ, 617, 614
- [4] Patsourakos, S. & Vial, J.-C., 2002, Sol. Phys., 208, 253