The TP-AGB phase.
Using available data for C and M giants with in Magellanic Cloud clusters, we derive limits to the lifetimes of the corresponding evolutionary phases, as a function of stellar mass. The C-star phase is found to have a duration between and Myr for stars in the mass range from to . There is also an indication that the peak of C-star lifetime shifts to lower masses (from slightly above to slightly below 2 ) as we move from LMC to SMC metallicities. The M-giant lifetimes also peak at in the LMC, with a maximum value of about 4 Myr, whereas in the SMC their lifetimes appear much shorter but, actually, they are poorly constrained by the data. These numbers constitute useful constraints to theoretical models of the TP-AGB phase. We show that several models in the literature underestimate the duration of the C-star phase at LMC metallicities.
e-mail: leo.girardi@oapd.inaf.it
1 Introduction
Since the work by Frogel et al. (1990, hereafter FMB90), the thermally pulsing asymptotic giant branch (TP-AGB) phase has been recognized to be an important contributor to the integrated near-infrared luminosity of young and intermediate-age stellar populations. Starting from the observed numbers and luminosities of C and M-type giants in Magellanic Cloud star clusters, FMB90 concluded that up to 40 percent of the bolometric cluster luminosity comes from stars with , which are above the RGB tip and hence belong to the TP-AGB. An interesting plot by FMB90 showed this fraction as a function of SWB cluster type (Searle et al. 1980), which gives approximate estimates of cluster ages. Charlot & Bruzual (1991) for the first time used this information to calibrate the amount of TP-AGB stars added into models of the spectrophotometric evolution of galaxies. This was an important piece of information, previously missing, that has contributed to the success of such models in interpreting the observed spectra of galaxies.
Since then several different approaches have been adopted to include the TP-AGB phase into evolutionary population synthesis models. They often use slightly modified versions of the original FMB90 plots to constrain the amount of TP-AGB stars (see Mouhcine & Lançon 2002; Maraston 2005, and references therein). Maraston (1998, 2005), for instance, follows an empirical approach based on FMB90 data to add the appropriate “fuel consumption” (equivalent to the contribution of these stars to the integrated bolometric light) at LMC metallicities, and then she uses results from uncalibrated TP-AGB evolutionary models from Renzini & Voli (1981) to account for the basic dependencies with metallicity. Other authors directly include extended sets of TP-AGB evolutionary models, for a wide enough range of stellar masses and metallicities, into their models. This kind of approach goes from adopting a very simplified description of the TP-AGB (e.g. Bressan et al. 1994) to adding TP-AGB tracks in which the efficiency of the third dredge-up is calibrated to reproduce the C-star luminosity functions (CSLF) in the Magellanic Clouds (e.g. Marigo & Girardi 2001). Different schemes are adopted by Bruzual & Charlot (2003) and Mouhcine & Lançon (2002), who adopt TP-AGB tracks that distinguish between the C- and M-type phases, but which are not directly calibrated on the CSLF: Bruzual & Charlot (2003) make a composition of TP-AGB tracks from different sources (namely Vassiliadis & Wood 1993, Groenewegen & de Jong 1993, and Groenewegen et al. 1995), but do not check the consistency of these composite tracks with the observed properties of resolved AGB populations. Mouhcine & Lançon (2002) instead compute their own TP-AGB tracks adopting modified prescriptions but the same values of dredge-up parameters as Groenewegen & de Jong (1993); they make several different comparisons with data, avoiding however the explicit check with the CSLFs that was key to Groenewegen & de Jong (1993).
Owing to the many interrelated aspects of TP-AGB evolution and their complex dependence on metallicity and stellar mass, our understanding is that the best approach to be used in population synthesis should be the inclusion of TP-AGB tracks computed in a self-consistent way and directly calibrated using a set of observables from the LMC and SMC. Once calibrated, these self-consistent sets of TP-AGB tracks present the potential advantage of better describing the dependence of all TP-AGB properties on the stellar metallicity, and hence they should work better for metallicities significantly different from the LMC and SMC ones. In this context, the main goal of the present paper is to translate FMB90 data into useful quantities – the TP-AGB lifetimes as a function of stellar mass – for the direct calibration of TP-AGB tracks of LMC ad SMC metallicities.
Originally, this work has been motivated by the finding by Marigo (2002) that all TP-AGB models computed that far have used a very improper prescription for their low-temperature opacities. She replaced the opacities for solar-scaled chemical mixtures – still now the standard choice in the literature – by opacities properly evaluated for the chemical mixtures of evolving TP-AGB envelopes. One main evolutionary effect of variable molecular opacities is the remarkable reduction of effective temperatures for C stars, which then causes an earlier onset of the superwind regime and a reduction of their lifetimes, when compared to models computed at fixed solar-scaled opacities. This reduction should not affect the previous M-type phase, for which no dramatic change in molecular opacities is expected. These findings also cause serious doubts about the previously-derived behaviours of TP-AGB evolutionary properties – including lifetimes, termination luminosities, effective temperatures, etc – with metallicity. It is then evident that new grids of TP-AGB tracks are due, and that the C-star lifetimes, once derived from empirical data, could provide important constraints to them.
2 Cluster data
Magellanic Clouds young clusters are clearly the best objects to check TP-AGB lifetimes by means of C- and M-star counts: They are populous enough to contain appreciable numbers of cool giants, have already been searched for them (FMB90 and references therein), and at the same time they have reasonably well-known distances, ages and metallicities. In order to relate the observed numbers of C and M stars to their lifetimes, we also need a measure of each cluster’s size. The total masses are very uncertain even for the best studied clusters, and are conditioned by the large mass fraction locked up in low-mass dwarfs. In practice, a better measure of cluster’s size comes from its integrated luminosities. In this paper, we deal with the integrated -band luminosity, , for a series of reasons: First the integrated magnitudes are known for all clusters in FMB90’s catalog; second smoothly declines with cluster age and it is expected to be little sensitive to errors in the cluster metallicity (cf. Girardi 2000); and third samples stars in well-populated evolutionary stages (namely close to the main-sequence turn-off and core-He burning, see Charlot & Bruzual 1991; Girardi & Bica 1993) and hence it is little affected by stochastic cluster-to-cluster variations in their number of stars. In comparison, the integrated luminosities in red and near-IR passbands, like and , although available from wide-area surveys such as 2MASS and DENIS, are too sensitive to the stars in the upper part of the RGB and AGB. They present significant non-monotonic behaviours with both age and metallicity, and stochastic cluster-to-cluster variations (Girardi 2002), which we prefer to avoid.
Therefore, a good starting point to derive lifetimes is to use the observed total number of C- and M-stars in a cluster, and , divided by its integrated -band luminosity, . These observed quantities are directly proportional to the M and C-type lifetimes. For the M stars, we limit the comparison to the AGB stars above the RGB-tip, i.e. those with . Adopting LMC and SMC distance moduli of 18.5 and 18.9 mag, this limit correspond to entries of and , for LMC and SMC stars respectively, listed in the table 1 of FMB90.
| Id. | [Fe/H] | ||||||
| LMC: | |||||||
| NGC 1854 | 7.66 | 22 | – | 0 | 2 | 10.39 | 300–500 |
| NGC 1850 | 7.78 | 23 | – | 1 | 4 | 9.57 | 300–500 |
| NGC 2214 | 7.78 | 23 | – | 0 | 2 | 10.93 | 25–75 |
| NGC 2136 | 7.78 | 25 | -0.55e | 0 | 0 | 10.54 | 150–300 |
| NGC 2058 | 8.03 | 25 | – | 0 | 5 | 11.85 | 600 |
| NGC 1866 | 8.08 | 28 | -0.50f,-0.55d | 0 | 3 | 9.73 | 25–75 |
| NGC 2107 | – | 32 | – | 0 | 1 | 11.51 | 300–500 |
| NGC 1987 | – | 35 | -0.50f,-0.50d | 1 | 3 | 12.08 | 300 |
| NGC 2209 | 9.03 | 35 | – | 2 | 0 | 13.15 | 25 |
| NGC 2108 | – | 36 | – | 1 | 1 | 12.32 | 150–300 |
| NGC 1783 | – | 37 | -0.75c | 4 | 10 | 10.93 | 25–75 |
| NGC 2213 | 8.99 | 38 | -0.01a | 3 | 1 | 12.38 | 25–75 |
| NGC 2231 | 9.26 | 38 | -0.52h,-0.67a | 1 | 1 | 13.20 | 25–75 |
| NGC 2154 | – | 38 | -0.56a | 2 | 2 | 11.79 | 25–75 |
| NGC 1806 | – | 38 | -0.71e,-0.23a | 2 | 6 | 11.10 | 150–300 |
| NGC 1651 | 9.24 | 38 | -0.53h,-0.53e,-0.37:a | 1 | 3 | 12.28 | 25 |
| NGC 1846 | – | 39 | -0.49h,-0.70a | 9 | 9 | 11.31 | 150 |
| NGC 1751 | – | 40 | -0.44h,-0.18:a | 2 | 4 | 11.73 | 150 |
| NGC 1652 | – | 41 | -0.46h,-0.45a | 0 | 0 | 13.13 | 25 |
| NGC 1978 | 9.40 | 41 | -0.38g,-0.96f,-0.60c,-0.41a | 6 | 3 | 10.70 | 25–75 |
| NGC 2173 | 9.18 | 41 | -0.42h,-0.50c,-0.24a | 1 | 3 | 11.88 | 25–75 |
| NGC 2121 | 9.03 | 46 | -0.50h,-0.10c,-0.61:a | 0 | 2 | 12.37 | 150 |
| NGC 1841 | 9.90 | 54 | -2.02h | 0 | 0 | 11.43 | 25 |
| SMC: | |||||||
| NGC 416 | 8.78 | 35 | -0.80c | 1 | 0 | 11.42 | 150–300 |
| NGC 419 | 9.08 | 39 | -0.60c | 10 | 0 | 10.61 | 150–300 |
| NGC 411 | 9.26 | 41 | -0.70c | 2 | 0 | 12.21 | 75–150 |
| NGC 152 | 9.28 | 42 | – | 2 | 1 | 12.92 | 150 |
| Kron 3 | 9.67 | 47 | -1.00c,-0.98b | 3 | 0 | 12.05 | 10–75 |
| NGC 339 | 9.70 | 47 | -0.70c,-1.19b | 1 | 0 | 12.84 | 75 |
| NGC 361 | 9.83 | 49 | – | 0 | 1 | 12.78 | 75 |
| NGC 121 | 10.03 | 52 | -1.19b | 1 | 1 | 11.24 | 10 |
References for [Fe/H]: a Olszewski et al (1991); b Da Costa & Hatzidimitriou (1998) in the Carretta & Gratton (1997) scale; c de Freitas Pacheco et al. (1998); d Oliva & Origlia (1998); e mean value from Dirsh et al. (2000); f Hill et al. (2000); g Ferraro et al. (2006); h Grocholski et al (2006).
| interval | [Fe/H] | |||||||||
|---|---|---|---|---|---|---|---|---|---|---|
| ( in yr) | () | () | () | () | (Myr) | (Myr) | ||||
| LMC S22-24 | 7.91 | -0.20 | 5.90 | 1 | 8 | 6.23 | ||||
| LMC S25-27 | 8.13 | -0.20 | 4.75 | 0 | 5 | 1.90 | ||||
| LMC S28-30 | 8.35 | -0.21 | 3.85 | 0 | 3 | 3.07 | ||||
| LMC S31-33 | 8.57 | -0.24 | 3.17 | 0 | 1 | 0.60 | ||||
| LMC S34-36 | 8.79 | -0.27 | 2.66 | 4 | 4 | 0.76 | ||||
| LMC S37-39 | 9.01 | -0.35 | 2.17 | 22 | 32 | 3.76 | ||||
| LMC S40-42 | 9.23 | -0.54 | 1.66 | 9 | 10 | 2.31 | ||||
| LMC S46-48 | 9.67 | -0.60 | 1.18 | 0 | 2 | 0.27 | ||||
| LMC S52-54 | 10.11 | -1.62 | 0.82 | 0 | 0 | 0.64 | ||||
| SMC S34-36 | 8.79 | -0.56 | 2.52 | 1 | 0 | 0.94 | ||||
| SMC S37-39 | 9.01 | -0.57 | 2.09 | 10 | 0 | 1.97 | ||||
| SMC S40-42 | 9.23 | -0.72 | 1.62 | 4 | 1 | 0.68 | ||||
| SMC S46-48 | 9.67 | -1.18 | 1.12 | 4 | 0 | 0.78 | ||||
| SMC S49-51 | 9.89 | -1.23 | 0.96 | 0 | 1 | 0.27 | ||||
| SMC S52-54 | 10.11 | -1.35 | 0.84 | 1 | 1 | 1.10 |
Table 1 summarises the cluster data available to our purposes. We have considered all clusters in FMB90, excluding the very young ones (i.e. those with yr) and a few SMC clusters for which we did not find age determinations based on the main sequence turn-off photometry. For each cluster, the entries in the table correspond to:
-
•
The age as derived from main-sequence turn-off photometry, if available. It is taken from Girardi et al. (1995) for LMC clusters, and Da Costa & Hatzidimitriou (1998) and Mighell et al. (1998) for SMC clusters.
-
•
The age-parameter , as determined and calibrated by Girardi et al. (1995) for LMC clusters only. For the most populous young and intermediate-age LMC objects (including the entries in Table 1), the relation gives the turn-off age with an error of about dex in . For SMC clusters, we derive the parameters directly from the turn-off age using the same relation as for LMC clusters.
-
•
Recent determination of [Fe/H] when available from either spectroscopic data, or from methods directly calibrated with spectroscopy; this [Fe/H] list is certainly very heterogeneous and likely incomplete.
-
•
The C-star counts, and M-star counts above , and . They include the spectroscopically confirmed C- and M-stars considered to be cluster members – i.e. located within a circle of diameter “close to or somewhat larger than arcmin” around each cluster – in FMB90’s table 1, and the few objects with dubious membership (“Y?” in his column 4) or spectral classification (“C?” or “M?” in his column 3). Clusters without such stars are also included in the table.
-
•
The cluster integrated -band magnitude from Bica et al. (1996) for the LMC, and van den Bergh (1981) for the SMC. This can be easily converted into the integrated luminosity in solar units, after assuming the Sun has a -band magnitude of , and apparent distance moduli of 18.6 and 19.0 mag, for the LMC and SMC respectively.
-
•
The surface density of field C-stars, in units of stars per deg2, at the cluster position, as derived by Blanco & McCarthy (1983). We give just the approximate position of each cluster in these isopleth maps (their figures 2 and 3).


For the SMC clusters NGC 419 and NGC 152, FMB90 catalogue contains many member stars without spectral classification but bright enough () to be in the TP-AGB phase. For the sake of homogeneity, we do not include these objects. We suspect they correspond to O-rich TP-AGB stars in these clusters, which would otherwise be practically missing. This fact warn us that the data for the O-rich TP-AGB stars above may be severely incomplete for the SMC. This does not happen for the LMC, where, owing to smaller distance (and maybe to the slightly larger mean metallicities and smaller ), stars slightly above are, as a rule, clearly classified by FMB90 as being of early M subtypes (M0–M2).
The reader will also notice the high degree of standardization we applied to these data, like a single value of distance+reddening for all clusters in each galaxy, and the approximative ages. They are necessary because, for the moment, there seems to be no satisfactorily homogeneous and updated compilation of such data. Apart from these problems, it is immediately evident from Table 1 that, in the end, the AGB data is very scarce when we consider individual clusters (see also Marigo et al. 1996). Just a handful of LMC clusters host more than two confirmed C stars, whereas for the SMC there are just two of such clusters. Taken cluster-per-cluster, the statistics provided by these data would be very poor. Therefore, we have added together the cluster data in bins of , which corresponds to age bins of and turn-off mass bins of .
The binned data are presented in Table 2, together with the expected mean metallicity [Fe/H] for each bin as given by Pagel & Tautvaisiene’s (1998) age–metallicity relations (AMR) for “bursting models” of the LMC and SMC. These AMRs fit well the [Fe/H] data of individual LMC and SMC clusters, within the observed scatter of about 0.2 dex () for a given age. Finally, Table 2 presents the estimated turn-off mass, , for the middle of each bin, as derived from its mean and [Fe/H], and Girardi et al. (2000) evolutionary tracks. The mass of the more evolved AGB stars should be slightly higher than but still very close to the tabulated values, with maximum differences amounting to just .
How large is the contamination by C and M stars belonging to the LMC and SMC fields rather than to the clusters ? We look for the answer in Blanco & McCarthy’s (1983) study of the surface distribution of C- and M-type giants across the Magellanic Clouds. Their figures 2 and 3 show isopleths of field C-star densities, , over both galaxies; the last column of Table 1 reports the location of FMB90 clusters in these isopleth maps. The highest values of , of the order of 600 deg-2, are found just in the central SMC and LMC bar regions. NGC 2058 is the only cluster in our sample located in such a high-density field; for it, the deg-2 value would translate into an expected number of field C stars inside the deg-2 area surveyed by FMB90. This is already a very low expectancy value. Most of the clusters in Table 1, however, are in outer LMC and SMC regions with values well below 300 deg-2. Adding all the individual values multiplied by each cluster area, the total number of contaminating C stars is estimated to be comprised between 0.75 and 1.4. Compared to our total sample of 56 C-stars distributed in 31 clusters, this contamination is small enough to be neglected. Even more importantly, the only individual clusters with a significant probability of being contaminated by field C stars, i.e. those with deg-2, are young LMC clusters with , corresponding to turn-off masses higher than 3 . This is exactly the age interval with less observed C-stars for which, as we will see later, just upper limits to the C-star lifetimes can be derived. Therefore, contamination by field C stars seems not to be a problem111Cioni & Habing (2003), using DENIS data, find a total number of 7750 C-type stars in the LMC, less than the expected from Blanco & McCarthy’s (1983) maps. This would be reassuring because the field C-star contamination could be even smaller than here estimated. However, we remark that the Cioni & Habing (2003) classification is based on a photometric criterion that likely misclassifies a non-negligible fraction () of C-type stars as M-type ones, therefore there may be no real discrepancy in their estimates when compared to Blanco & McCarthy’s (1983) one. In this paper, we opt to use the Blanco & McCarthy (1983) C-star numbers because they are based on a spectroscopic classification which is equivalent to the one used by FMB90, and which is considered to be complete for the C stars above the RGB-tip..
Regarding the M-giants, Blanco & McCarthy (1983) data cannot be used to estimate the field contamination since it is complete only for spectral types later than M5 (i.e. M5+). Cioni & Habing (2003, their table 1), from completely independent data, find the C/M0+ ratio for stars above the RGB tip to be 0.30 and 0.27, for the entire LMC and SMC, respectively. From these numbers, we can roughly estimate that the contamination by field M-giants is just a few times larger ( and times, for the LMC and SMC) than the one from C-giants. Assuming 3.5 as the overdensity factor for both LMC and SMC, we can expect from 2.5 to 5 field M-stars contaminating our sample, which contains 68 M stars in total (65 in the LMC and 3 in the SMC). We conclude that the field M-giant contamination can be safely neglected as well, at least for the LMC. For the SMC, the total number of bona-fide M giants in clusters (just 3) is so low that field contamination may indeed be an issue; however, as we conclude later in Sect. 4, this number is also low enough to make the SMC M-star data almost useless as a constraint to AGB models.
The FMB90 data refers only to optically visible stars. What about the presence of dust-enshrouded, optically obscured TP-AGB stars? van Loon et al. (2005) present a comprehensive survey and investigation of such stars in Magellanic Cloud Clusters, thus representing the mid-infrared counterpart of FMB90 survey. Unfortunately, the two cluster samples are quite different. van Loon et al.’s (2005) sample of bright IR cluster objects (their tables 2 to 7) would add stars to just three of our 31 clusters, namely: 1 AGB C-star in NGC 1783, 1 AGB C-star and 1 (post-)AGB C-star to NGC 1978, and 2 AGB C-stars for NGC 419. It is clear that dust-obscured objects in clusters constitute a modest fraction of the total numbers of TP-AGB stars. We will come back to this point later.
3 Lifetimes as a function of mass


The and quantities in Table 2 could already be directly used to constrain theoretical models, since they are proportional to the typical C- and M-type lifetimes. Large error bars are implied by the low number of available objects for some of the age bins. Anyway, the LMC data pose well defined constraints to the C-type lifetime for masses between 1.5 and 2.8 , whereas at higher/lower masses just upper limits are derived. For the SMC, error bars are even larger, but three age bins have enough statistics to provide useful constraints to between 1.2 and 2.4 . The data for the SMC is in general of low quality, and it is likely severely affected by incompleteness; moreover, at SMC metallicities a significant fraction of the O-rich AGB stars above the RGB-tip may be of spectral type earlier than M, and then they may be absent from FMB90 catalog. As a consequence, one should better not using the ratios derived in the SMC to constrain AGB models.
The values can now be converted directly into stellar lifetimes as follows. For a given evolutionary stage , is related to the the lifetime through an age-dependent proportionality constant, that could be computed by using basic population synthesis theory. In this paper, we compute the proportionality constant in a purely numerical way: we take a set of AGB models whose AGB lifetimes are exactly known for all masses and metallicities. Then, we construct isochrones and, by simply integrating the stellar number density and -band luminosity, weighted by the initial mass function (IMF), along them222This integration is performed assuming Kroupa’s (2001) IMF corrected for binaries, but the results are quite insensitive to the IMF., we derive the theoretical isochrone ratios. The empirical lifetimes of the phase under consideration are then given by the ratio between the observed (Table 2) and the corresponding simulated , times the lifetime that corresponds to the AGB stars in that isochrone. By interpolating between models of several masses and metallicities, we properly take into consideration the variation with metallicity of the main sequence lifetimes – and hence of the evolutionary rate at which stars leave the main sequence – and of the integrated -band luminosity. Both effects play a non negligible role in determining the proportionality constant between and .
The final results for the lifetimes of C and M-type giants as a function of mass are presented in the last columns of Table 2 and in Fig. 2.
In the present work, we have used the same isochrones as in Cioni et al. (2006ab)333These isochrones are available in http://pleiadi.oapd.inaf.it; they are based on Girardi et al. (2000) tracks for the pre-TP-AGB phases, and completed with TP-AGB tracks computed on purpose using Marigo’s (2002) code. As a matter of fact, the values we have used depends very little on the particular set of TP-AGB tracks used in the isochrones. We have checked that excluding the TP-AGB from Cioni et al. (2006ab) isochrones causes the integrated -band magnitudes to increase by less than 0.1 mag at all ages and metallicities relevant to this work; 0.04 mag is the typical value for this difference. This means that the possible “systematic” errors in the lifetimes, caused by possible errors in our TP-AGB tracks, are of the order of just %. This is much smaller than the errors caused by the poor statistics in the data (see the 68 % confidence-level error bars in Fig. 1), so that we consider this problem as being of minor importance.
More relevant may be the errors caused by uncertainties in the AMRs: at a given age and for both the LMC and SMC, the mean cluster metallicity may be uncertain at a level of dex, as indicated by a series of papers which reached somewhat contrasing results for these relations (see e.g. Pagel & Tautvaisiene 1998; Dirsh et al. 2000). Keeping the IMF fixed, the integrated changes with metallicity [Fe/H] at a rate which is approximately mag/dex for ages lower than 1.2 Gyr, and otherwise444The change in at 1.2 Gyr is determined by the presence of the RGB and red clump at later ages, whose integrated -band light is more sensitive to [Fe/H] than the one from the main sequence.. Therefore, errors of dex in the AMR would translate in errors of in the derived lifetimes. Again, this is still smaller than the typical errors caused by the poor statistics; on the other hand, it is also evident that our results would benefit from a better accessment of the AMRs in both the Magellanic Clouds.
4 Discussion and conclusions
Despite the large error bars, Table 2 and Fig. 2 clearly indicate that C-star lifetimes have values of about to Myr, for stars in the mass interval from to (Fig. 2), and for metallicities comprised between the and dex implied by LMC and SMC data. There is also an indication that the peak of C-star lifetime shifts to lower masses (from slightly above to slightly below 2 ) as we move from LMC to SMC metallicities. The M-giant lifetimes also peak at about 2 in the LMC, with a maximum value of about 4 Myr. In the SMC the M-giant lifetimes appear much shorter, but actually they are poorly constrained by present data.
These lifetimes correspond to the optically-visible TP-AGB phase. In their study of IR sources, van Loon et al. (2005) find that 1.3–3 stars spend of the order of 10–20 percent of their AGB lifetimes as optically-obscured, bright IR objects, with mass losses higher than about yr. Assuming the typical lifetimes above the RGB tip to be 1 Myr, they derive 1–2 yr for the duration of this superwind phase. Moreover, since about yr is the time required for loosing the envelope masses of the sample stars with the observed (superwind) mass loss rates, van Loon et al. estimate that 30–70 percent of the mass loss of AGB stars occurs as superwind. If we repeat the same reasoning using our own estimates for the lifetimes in the TP-AGB phase, which are at least twice larger than the value used by van Loon et al. (2005), we find that the superwind phase may account for all the mass loss during the TP-AGB phase. Of course, this indication is anyway very uncertain because derived from small numbers of stars.
We have also verified that several models in the literature present C-star lifetimes significantly shorter than the values we find for the LMC, as illustrated in Fig. 3. The comparison is shown only for a subset of TP-AGB models which has already been used, with various procedures, into population synthesis of galaxies.
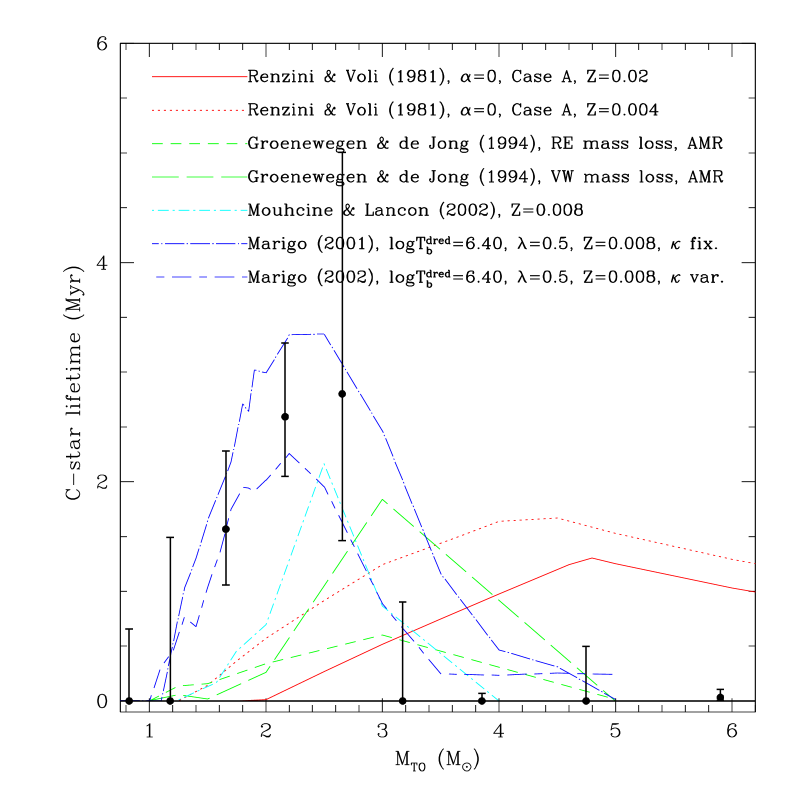
These models can be roughly classified into two classes: the ones previous to Groenewegen & de Jong (1993) are uncalibrated, in the sense that they fail in reproducing the C-star luminosities observed in the Magellanic Clouds (as discussed for the first time by Iben 1981). Renzini & Voli (1981) TP-AGB models belong to this class; as it can be seen in Fig. 3, they present too low C-star lifetimes as compared to the data, and are systematically shifted towards a much higher range of masses. Notice that we plot just a subset of Renzini & Voli’s models (their tables 1a and 1f); their models with , which take into account the effect of hot-bottom burning in more massive stellar envelopes, would present even lower C-star lifetimes for . It is clear that these models are highly discrepant with the data.
Groenewegen & de Jong (1993) presented the first calibrated TP-AGB models, in which the poorly known parameters determining the occurrence and efficiency of third dredge-up events were tuned so as to reproduce the LMC and SMC CSLFs. Indeed, all post-1993 models we plot in Fig. 3 have positive C-star lifetimes in the right mass range, with the minimum mass for the present of C-stars being close to 1.5 , and a peak lifetime located somewhere between 2 and 3 , in rough agreement with the cluster data. This agreement is just expected, since fitting the main features of the CSLF requires imposing efficient dredge-up for masses as low as 1.4 , as discussed in detail by Groenewegen & de Jong (1993) and Marigo et al. (1999).
However significant discrepancies appear in the C-star lifetimes of calibrated models too. For instance, lifetimes in Groenewegen & de Jong (1994) tend to be too short, with maximum values of just 0.6 Myr for models assuming Reimers’ (1975) mass loss formula (RE in the plot), and 1.8 Myr for Vassiliadis & Wood’s (1993) one (VW in the plot). The discrepancies are more evident in the mass range between 1.5 and 2.5 , where model lifetimes fall to less than 0.5 Myr, whereas the ones derived here are closer to 2 Myr. Notice that the comparison of Fig. 3 is not strictly correct because Groenewegen & de Jong (1994) tracks do not include overshooting, whereas the LMC cluster data have been age-dated using overshooting models. We estimate that, in order to be put Groenewegen & de Jong models in the same scale as the data, their masses should be reduced by a factor of about 20 per cent. This would not solve the differences in lifetimes.
The same discrepancy is shared, to a lower extent, by Mouhcine & Lançon’s (2002) models, which present the right peak lifetimes of Myr, but again have too low lifetimes at masses . Due to the significantly lower metallicities of the old LMC clusters, and to the high metallicity dependence expected for the C-type lifetime, this discrepancy for would likely be reduced if the comparison was performed with models of smaller metallicity (say ). Notice that Mouhcine & Lançon (2002) adopt the same dredge-up parameters as Groenewegen & de Jong (1993), although many of their model ingredients have changed. Therefore, the Mouhcine & Lançon (2002) models are not strictly calibrated on the CSLF, although their C-star luminosities should not be much far from the observed ones.
Marigo (2001) models do not present these discrepancies in their C-star lifetimes at lower masses, and have a peak lifetime of 3.4 Myr, which is well compatible with the data. This could be considered as a set of TP-AGB models which comply with both CSLF and lifetime constraints. However, we know already that these models – as well as all of the previously mentioned ones – are wrong for a different reason: they do not consider the crucial effect of variable molecular opacities as the chemical composition changes along the TP-AGB evolution (see Marigo 2002). The effect of the variable opacities is illustrated by the models labelled “Marigo (2002)” in Fig. 2; it can be noticed that assuming the same dredge-up parameters as calibrated by Marigo (2001), the change from fixed (solar-scaled) to variable opacities (-fix and -var cases, respectively) causes a reduction of percent in the C-star lifetimes. These would be still compatible with the cluster data. However, the new models have also lower mean luminosities and hence they fail to reproduce the CSLF. In fact, updating of the input physics of TP-AGB models is not enough, and a re-calibration of dredge-up parameters become necessary in this case.
In conclusion, we have shown that present data for AGB stars in LMC clusters represent useful – and so far neglected – constraints to the lifetimes of TP-AGB models. Checking for these constraints should be especially important if the TP-AGB models are to be used into evolutionary population synthesis. In fact, using models with the right luminosities (i.e. calibrated with the CSLF) but with too low lifetimes would lead to underestimate the contribution of TP-AGB stars to the integrated light of single-burst stellar populations.
In a following paper, we will present updated TP-AGB models computed for the variable-opacity case, in which the lifetimes here derived are adopted, together with the observed CSLF in the Magellanic Clouds, in the calibration procedure of the main model parameters.
References
- (1) Bica, E., Clariá, J.J., Dottori, H., Santos, J.F.C., Jr., Piatti, A.E., 1996, ApJS 102, 57
- (2) Blanco V.M., McCarthy M.F., 1983,
- (3) Bressan, A., Chiosi, C., Fagotto, F. 1994, ApJS, 94, 63
- (4) Bruzual, G., Charlot, S. 2003, MNRAS 344, 1000
- (5) Carretta, E., Gratton, R.G., 1997,A&AS, 121, 95
- (6) Charlot, S., Bruzual G.A. 1991, ApJ 367, 126
- (7) Cioni, M.-R.L., Habing, H.J. 2003, A&A, 402, 133
- (8) Cioni, M.-R.L., Girardi, L., Marigo, P., Habing, H.J., 2006a, A&A, 448, 77
- (9) Cioni, M.-R.L., Girardi, L., Marigo, P., Habing, H.J., 2006b, A&A, 452, 195
- (10) Da Costa, G.S., Hatzidimitriou, D. 1998, AJ 115, 1934
- (11) Dirsch, B., Richtler, T., Gieren, W.P., Hilker M., 2000, A&A, 360, 133
- (12) Frogel, J.A., Mould, J., & Blanco, V.M. 1990, ApJ, 352, 96 (FMB90)
- (13) Girardi, L., 2000, ASPC 211, 133
- (14) Girardi, L., 2002, IAUS 207, 625
- (15) Girardi, L., Bica, E., 1993, A&A, 274, 279
- (16) Girardi, L., Chiosi, C., Bertelli, G., Bressan, A. 1995, A&AS, 298, 87
- (17) Girardi, L., Bressan, A., Bertelli, G., & Chiosi, C. 2000, A&AS, 141, 371
- (18) Grocholski, A.J., Cole, A.A., Sarajedini, A., Geisler, D., Smith, V.V., 2006, astro-ph/0607052
- (19) Groenewegen, M.A.T., & de Jong, T. 1993, A&A, 267, 410
- (20) Groenewegen, M.A.T., & de Jong, T. 1994, A&A, 283, 463
- (21) Groenewegen, M.A.T., van den Hoek, L.B., & de Jong, T. 1995, A&A, 293, 381
- (22) Hill, V., François, P., Spite, M., Primas, F., Spite, F., 2000, A&A, 364, L19
- (23) Iben, I., Jr., 1981, ApJ 246, 278
- (24) Kroupa, P., 2001, MNRAS, 322, 231
- (25) Maraston, C., 1998, MNRAS 300, 872
- (26) Maraston, C., 2005, MNRAS 362, 799
- (27) Marigo, P. 2001, A&A, 370, 194
- (28) Marigo, P. 2002, A&A, 387, 507
- (29) Marigo, P., Girardi, L., 2001, A&A, 377, 132
- (30) Marigo, P., Girardi, L., & Chiosi, C. 1996, A&A 316, L1
- (31) Marigo, P., Girardi, L., & Bressan, A. 1999, A&A 344, 123
- (32) Mighell, K.J., Sarajedini, A., French, R.S. 1998, AJ 116, 2395
- (33) Mouhcine, M., & Lançon, A. 2002, A&A, 393, 149
- (34) Oliva, E., Origlia, L. 1998, A&A 332, 46
- (35) Olszewski, E.W., Schommer, R.A., Suntzeff, N.B., Harris, H.C., 1991, AJ, 101, 515
- (36) Pagel B.E.J., Tautvaisiene G., 1998, MNRAS, 299, 535
- (37) Renzini, A., & Voli 1981, A&A , 94, 175
- (38) Reimers D., 1975, MSRSL, 8, 369
- (39) Searle, L., Wilkinson, A., Bagnuolo, W.G. 1980, ApJ 239, 803
- (40) van den Bergh, S., 1981, A&AS, 46, 79
- (41) van Loon, J.Th., Marshall, J.R., Zijlstra, A.A. 2005, A&A, 442, 597
- (42) Vassiliadis, E., Wood, P.R. 1993, ApJ, 413, 641