A Cold Nearby Cloud Inside the Local Bubble
Abstract
The high-latitude Galactic H I cloud toward the extragalactic radio source 3C 225 is characterized by very narrow 21 cm emission and absorption indicative of a very low H I spin temperature of about 20 K. Through high-resolution optical spectroscopy, we report the detection of strong, very narrow Na I absorption corresponding to this cloud toward a number of nearby stars. Assuming that the turbulent H I and Na I motions are similar, we derive a cloud temperature of 20 K (in complete agreement with the 21 cm results) and a line-of-sight turbulent velocity of 0.37 0.08 km s-1 from a comparison of the H I and Na I absorption linewidths. We also place a firm upper limit of 45 pc on the distance of the cloud, which situates it well inside the Local Bubble in this direction and makes it the nearest-known cold diffuse cloud discovered to date.
1 Introduction
Recent H I 21 cm absorption surveys have revealed a significant population of cold (T 40 K) diffuse clouds in the Galactic interstellar medium (ISM) (Heiles & Troland, 2003; Gibson et al., 2005; Kavars et al., 2005). Two of the most remarkable examples of such clouds were actually discovered long ago by Verschuur (1969) through their very narrow 21 cm emission. He found two closely-spaced, degree-sized patches of H I gas at (“Cloud A”) and (“Cloud B”) each with line widths indicative of kinetic temperatures below 30 K. Knapp & Verschuur (1972) subsequently mapped the 21 cm emission of these clouds at higher resolution and derived respective H I spin temperatures of 24 K and 17 K for Cloud A and Cloud B. In another approach, Crovisier et al. (1985) measured spin temperatures of 20 K amd 14 K from the Cloud A and Cloud B 21 cm absorption toward the extragalactic radio sources 3C 225 and 3C 237.
As part of their Millenium Arecibo 21 cm Absorption-Line Survey, Heiles & Troland (2003) revisited these two cold clouds in the context of new observations of 3C 225 and 3C 237. Utilizing the Leiden-Dwingeloo 21 cm sky survey data (Hartmann & Burton, 1997), they found that Cloud A and Cloud B are the predominant components of a narrow (2), broken ribbon of cold H I gas stretching over 20 across the constellation Leo. Their observations of 3C 225a,b (6.3 separation) yield spin temperatures of 22 K and 17 K and H I column densities of cm-2 and cm-2 for the intervening Cloud A gas. Assuming thermal pressure equilibrium under these conditions leads to an extremely thin, sheetlike geometry for the cloud (Heiles & Troland, 2003). A more detailed physical assessment including the specific aspect ratio, actual size, and mass of the cloud is limited by the unknown cloud distance. In this Letter, we present the first optical absorption-line study of the cold Leo clouds and conclusively show that Cloud A is located well inside the Local Bubble.
2 Observations
Observations of the interstellar Na I D2 5889.951 and D1 5895.924 absorption toward 33 stars in Leo were obtained in 2006 January and March using the 0.9 m Coude Feed telescope and spectrograph at Kitt Peak National Observatory. The spectrograph was configured with the long focal length camera (Camera 6), the echelle grating, a cross-dispersing grism (#770), and the T2KB Tek2048 (2006 January) and T1KA Tek1024 (2006 March) CCD detectors. The 150 m slit width resulted in a 2.1 pixel spectral resolution of 0.026 Å or 1.3 km s-1 at the Na I wavelengths as measured from the Th-Ar calibration lamp spectra. The NOAO IRAF echelle data reduction package was utilized to bias-correct, scattered-light-correct, flat-field, wavelength-calibrate, order-extract, and sum the individual CCD exposures into the final net spectra of each object. Observations of the nearby star Leo were also obtained and reduced in a similar manner in order to create an essentially ISM-free template to divide out the telluric absorption in the vicinity of the Na I lines toward the program stars.
Figure 1 illustrates a sample of our interstellar Na I D2 spectra toward 5 stars in the sky region of 3C 225. They all clearly show a strong, very narrow absorption component at the same LSR velocity (4 km s-1) as the narrow H I 21 cm absorption observed toward 3C 225. At our spectral resolution, this Na I component is so narrow that it can be measured without significant stellar line blending uncertainties toward stars with spectral types as late as M2 III (except in those cases where the velocity of the component is close to that of the strong stellar Na I absorption in these later-type stars). This capability dramatically expands the sky coverage and distance range of suitable stellar targets well beyond the sparse sample of early-type stars that are traditionally employed for interstellar absorption-line studies. Our program sample of 33 stars ranges in spectral type from B9 V to M2 III and represents most of the bright targets accessible with a small telescope in the sky vicinity of the cold Leo clouds.
We detect Na I absorption at the velocity corresponding to the cold H I gas in 23 of our targeted Leo sightlines. Utilizing the FITS6P profile-fitting package (Welty et al., 1994) and taking into account the hyperfine splitting of the Na I D lines (v 1.05 km s-1), we find that a single-component solution to both the D2 and D1 profiles provides an excellent fit to this absorption in all cases. Figure 2 illustrates the single-component fit (and the intrinsic hyperfine-split profile) for the D lines toward HD 83509 which exhibits the narrowest Na I linewidth (b 0.33 km s-1) among our measurements of the cold gas absorption. Table 1 lists the Na I column densities, Gaussian linewidth parameters (b-values), and LSR velocities measured for each detection of this absorption and 2 upper limits on N(Na I) for each non-detection. As is the case with the corresponding H I 21 cm emission (Heiles & Troland, 2003), the LSR velocity of this Na I component generally decreases from about 4 to 2 km s-1 with increasing Galactic longitude across Leo.
3 Discussion
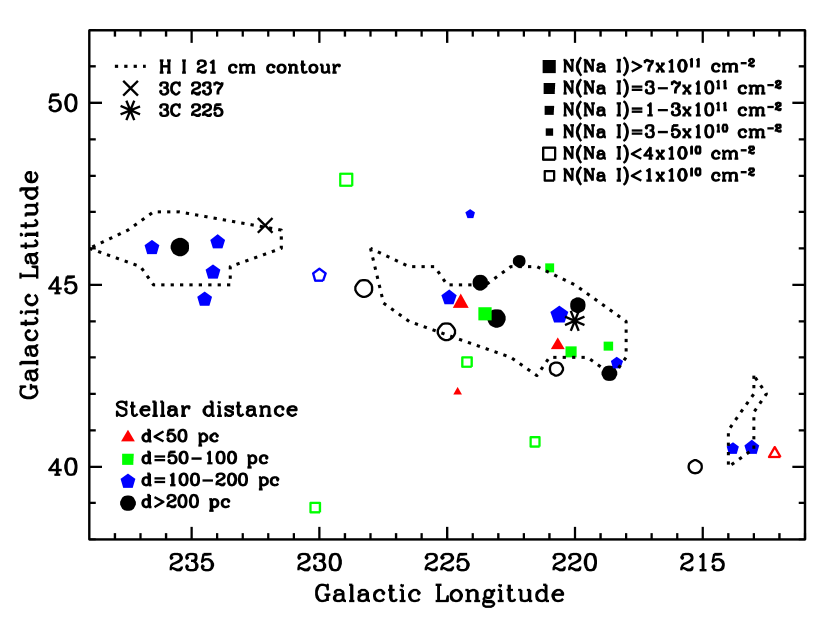
Figure 3 illustrates the strength of the Na I absorption at vLSR 3 km s-1 toward our program stars as a function of sky position relative to the 21 cm emission contour of the cold H I gas (Heiles & Troland, 2003) and the location of 3C 225 and 3C 237. It is clear from Figure 3 that the Na I absorption is an excellent tracer of the H I emission for this cold gas. In the case of comparisons with the 21 cm absorption observed toward 3C 225a,b, four stars with matching-velocity Na I absorption (HD 84194, HD 84182, HD 83683, and HD 83509) are located within 1 of this radio source. The mean linewidth of this Na I absorption (and the standard error of the mean) is b 0.54 0.10 km s-1 (0.90 0.17 km s-1 FWHM) as compared with the 1.3 km s-1 FWHM H I linewidth measured toward both 3C 225a and 3C 225b by Heiles & Troland (2003). Assuming that the turbulent H I and Na I motions are similar, a comparison of the H I and Na I linewidths through the expression yields a cloud kinetic temperature of 20 K and a one-dimensional rms turbulent velocity (vt) of 0.37 0.08 km s-1. Thus, the Na I measurements are completely consistent with the remarkably cold temperatures previously derived for Cloud A from the H I 21 cm spin excitation toward 3C 225.
The Na I observations also provide a stringent constraint on the distance of Cloud A. The two closest program stars within the Cloud A H I contour are at Hipparcos distances (Perryman et al., 1997) of 42.1 pc (HD 83683) and 42.8 pc (HD 85091) and they both exhibit strong Cloud A Na I absorption. Another nearby star at a distance of 41.5 pc (HD 83808) just outside the Cloud A contour exhibits very weak Na I absorption at the appropriate velocity. The only program star closer than these objects is at a distance of 39.2 pc (HD 80218) and it lies just outside the H I contour of the lowest-longitude cold Leo cloud. Consequently, the lack of Na I absorption toward HD 80218 is not conclusive with respect to the distance of this cloud. Although it is likely that the three cold Leo clouds illustrated in Figure 3 are at the same distance based on their similar velocities, narrow linewidths, and close position on the sky, the Na I measurements are not definitive in this regard. Nevertheless, the Na I absorption observed toward HD 83683, HD 85091, and HD 83808 does allow us to place a firm upper limit of 45 pc on the distance of Cloud A. With this limit, Cloud A is not only one of the coldest diffuse clouds discovered to date, it also becomes the nearest-known cold interstellar cloud to the Sun.
The proximity of Cloud A is especially interesting in that it places this cold cloud well inside the Local Bubble of hot (106 K), tenuous (nH 0.01 cm-3) gas surrounding the Sun out to distances of 100 pc or more (Cox & Reynolds, 1987). The Local Bubble is believed to have originated through multiple supernovae explosions over the past 5 to 15 million years (Smith & Cox, 2001; Breitschwerdt & de Avillez, 2006). Utilizing Na I absorption measurements toward 1000 early-type (earlier than A5) stars with Hipparcos distances, Lallement et al. (2003) have mapped the neutral gas “edge” of the Local Bubble across the sky. In the direction of the cold Leo clouds, they place this boundary at a distance of about 100 pc. Since our star sample in the Leo field of Figure 3 is much larger (33) than that (2) of Lallement et al. (due in part to our inclusion of objects with later spectral types), we can explore this boundary in greater detail. Among the 17 program stars with d 157 pc, nine exhibit interstellar Na I absorption at LSR velocities (ranging from 11.5 to 1.6 km s-1) distinct from those of the cold Leo clouds whereas none of the 16 stars with d 157 pc display such absorption. As illustrated in Figure 1, such distance distinctions are also apparent when the Na I spectra are compared in localized sky regions. Allowing for patchiness in the more distant Na I absorption and the larger stellar distance uncertainties past 100 pc, the nearest neutral gas clouds beyond Cloud A are at a distance between 100 and 150 pc. Thus, Cloud A is indeed closer to the Sun than it is to the neutral gas boundary of the Local Bubble.
Within the Local Bubble, there are known to be a number of warm, partially-ionized clouds which collectively have an average temperature of 6700 K and a mean thermal pressure (P/k) of 2300 K cm-3 (Redfield & Linsky, 2004). Although the thermal pressures of these clouds appear to be below that of the surrounding hot gas in the Local Bubble, they provide a benchmark in considering the physical characteristics of Cloud A. Assuming that Cloud A is in thermal pressure equilibrium at 2300 K cm-3, the 20 K temperature and mean N(H I) of cm-2 toward 3C 225 yield a cloud thickness of cm or 0.07 pc (this equilibrium thickness would be 4 times less at the hot gas thermal pressure). If Cloud A is at a distance of 40 pc, its H I angular extent would then correspond to a physical size of pc, a very thin length-to-width-to-thickness aspect ratio of 70:20:1, and an H I mass of about 1.4 solar masses. At the other extreme, if we assume that Cloud A is at a distance (2 pc) where its projected width is equal to its equilibrium thickness of 0.07 pc, the cloud size would be pc with an H I mass of about 3.6 Jupiter masses. In any case, given our measured vt of 0.37 km s-1, the line-of-sight turbulent crossing time over the equilibrium thickness of 0.07 pc is years. In other words, it appears that Cloud A is a much more transient phenomenon than the Local Bubble and thus, is likely to have originated somehow in this seemingly hostile environment to cold clouds.
Recently, several theoretical studies have proposed the formation of cold clouds with filamentary or sheet-like geometry through converging flows of warm interstellar gas (Audit & Hennebelle, 2005; Vazquez-Semadeni et al., 2006). In particular, Vazquez-Semadeni et al. find that they can come close to reproducing the Heiles & Troland (2003) description of Cloud A through transonic compression in colliding warm gas streams. They acknowledge that their timescale to produce this cold structure is rather long (1 Myr) but may be consistent with the observations if Cloud A is overpressured and vt reflects the gas flow rather than turbulent motions. Such models are promising but will need to consider other factors such as magnetic fields and certainly thermal conduction in order to provide a full explanation of the nature and evolution of Cloud A inside the hot Local Bubble. For example, Slavin (2006) has shown that the evaporative and condensation time scales for such cold clouds are measured in millions of years even if immersed in a hot surrounding medium. It is also possible that the hot gas in the Local Bubble may be less pervasive than generally thought, especially given recent results suggesting significant foreground contamination by heliospheric soft X-ray emission (Lallement, 2004). In any case, the size of Cloud A on the sky and its isolated nature make it ideal for further optical/UV absorption-line and H I 21 cm emission-line studies of its distance, small-scale structure, velocity fields, and other physical characteristics such as dust depletion, electron density, and radiation field. A better understanding of the origin and survival of this nearby 20 K cloud inside the Local Bubble will almost certainly have a bearing on interpreting the continuing discoveries of such cold diffuse clouds elsewhere in the Galactic ISM.
References
- Audit & Hennebelle (2005) Audit, E., & Hennebelle, P. 2005, A&A, 433, 1
- Breitschwerdt & de Avillez (2006) Breitschwerdt, D. & de Avillez, M. A. 2006, A&A, 452, L1
- Cox & Reynolds (1987) Cox, D. P., & Reynolds, R. J. 1987, ARA&A, 25, 303
- Crovisier et al. (1985) Crovisier, J., Dickey, J. M., & Kazes, I. 1985, A&A, 149, 209
- Gibson et al. (2005) Gibson, S. J., Taylor, A. R., Higgs, L. A., Brunt, C. M., & Dewdney, P. E. 2005, ApJ, 626, 195
- Hartmann & Burton (1997) Hartmann, D., & Burton, W. B. 1997, Atlas of Galactic Neutral Hydrogen (Cambridge: Cambridge Univ. Press)
- Heiles & Troland (2003) Heiles, C., & Troland, T. H. 2003, ApJ, 586, 1067
- Kavars et al. (2005) Kavars, D. W., Dickey, J. M., McClure-Griffiths, N. M., Gaensler, B. M., & Green, A. J. 2005, ApJ, 626, 887
- Knapp & Verschuur (1972) Knapp, G. R., & Verschuur, G. L. 1972, AJ, 77, 717
- Lallement (2004) Lallement, R. 2004, A&A, 418, 143
- Lallement et al. (2003) Lallement, R., Welsh, B. Y., Vergely, J. L., Crifo, F., & Sfeir, D. 2003, A&A, 411, 447
- Perryman et al. (1997) Perryman, M. A. C., et al. 1997, A&A, 323, L49
- Redfield & Linsky (2004) Redfield, S., & Linsky, J. L. 2004, ApJ, 613, 1004
- Slavin (2006) Slavin, J. 2006, in Small Ionized and Neutral Structures in the Diffuse Interstellar Medium, ed. W. M. Goss (San Francisco: ASP), in press
- Smith & Cox (2001) Smith, R. K., & Cox, D. P. 2001, ApJS, 134, 283
- Vazquez-Semadeni et al. (2006) Vazquez-Semadeni, E., Ryu, D., Passot, T., Gonzalez, R. F., & Gazol, A. 2006, ApJ, 643, 245
- Verschuur (1969) Verschuur, G. L. 1969, Astrophys. Letters, 4, 85
- Welty et al. (1994) Welty, D. E., Hobbs, L. M., & Kulkarni, V. P. 1994, ApJ, 436, 152
| StaraaThe program stars ordered by increasing Galactic longitude. | DistancebbThe stellar distances and their 1 uncertainties as derived from Hipparcos parallax measurements (Perryman et al., 1997). | N(Na I)ccThe 1 errors in the measured Na I column densities are all less than 6% of the listed N(Na I) values. The stars with no cold Leo Na I absorption are listed with a 2 N(Na I) upper limit. | b(Na I)ddThe 1 uncertainties in the measured Gaussian line widths are all less than 8% of the listed b(Na I) values. | v(Na I)eeThe 1 uncertainties in the measured velocities of the cold Leo Na I absorption are all less than 0.08 km s-1. |
|---|---|---|---|---|
| (pc) | (cm-2) | (km s-1) | (km s-1) | |
| HD 80218 | 39.2 | |||
| HD 80510 | 174 | 0.39 | ||
| HD 80652 | 128 | 0.56 | ||
| HD 80613 | 233 | |||
| HD 83023 | 156 | 0.84 | ||
| HD 82906 | 254 | 0.54 | ||
| HD 83343 | 64.5 | 0.58 | ||
| HD 84194 | 219 | 0.60 | ||
| HD 83509 | 60.5 | 0.33 | ||
| HD 84182 | 158 | 0.78 | ||
| HD 83683 | 42.1 | 0.43 | ||
| HD 83362 | 304 | |||
| HD 84937 | 80.4 | 0.92 | ||
| HD 82395 | 73.2 | |||
| HD 85268 | 568 | 1.17 | ||
| HD 84561 | 215 | 0.64 | ||
| HD 84722 | 89.8 | 0.64 | ||
| HD 85259 | 275 | 0.40 | ||
| HD 86360 | 162 | 0.63 | ||
| HD 84183 | 76.6 | |||
| HD 85091 | 42.8 | 0.62 | ||
| HD 83808 | 41.5 | 2.07 | ||
| HD 85269 | 196 | 0.60 | ||
| HD 84764 | 247 | |||
| HD 86080 | 207 | |||
| HD 87837 | 84.1 | |||
| HD 86663 | 161 | |||
| HD 83425 | 84.0 | |||
| HD 88048 | 191 | 0.57 | ||
| HD 87682 | 106 | 0.62 | ||
| HD 87392 | 126 | 0.71 | ||
| HD 88315 | 251 | 1.01 | ||
| HD 88547 | 162 | 0.60 |