A new luminous supersoft X-ray source in NGC 300
Context. We report the discovery of a new luminous supersoft source, XMMU J005455.0$-$374117, in the nearby spiral galaxy NGC 300, in XMM-Newton observations performed on 2005 May 22 and on 2005 November 25. The source is not present in ROSAT data nor in the previous XMM-Newton observations of 2000 December/2001 January. The unique luminous supersoft source, XMMU J005510.7$-$373855, detected in the 1992 May/June ROSAT data and in the 2000/2001 XMM-Newton data, fell below detectability. This source already appeared highly variable in ROSAT observations. Aims. We report on the temporal and spectral analysis of this new supersoft source (SSS) and compare its properties with the previous known SSS. Methods. We present the light curves of the SSS, model its spectrum and estimate the corresponding flux and luminosities. Results. The light curve of XMMU J005455.0374117 does not show large fluctuations in any of the observations and its spectrum can be modelled with an absorbed blackbody with eV. The corresponding bolometric luminosity is in the first observation and drops to six months later. No optical source brighter than is found coincident with its position. Conclusions. The luminosity of these two SSSs is higher than what has been found for ‘classical’ SSSs. Their nature could be explained by beamed emission from steady nuclear burning of hydrogen onto white dwarfs, or accretion onto stellar-mass black hole with matter outflow or observed at high inclination angle. The presence of an intermediate-mass black hole seems unlikely in our case.
Key Words.:
Galaxies: individual: NGC 300 – X-rays: galaxies – X-rays: binaries1 Introduction
Supersoft sources (SSSs) were first discovered in the Large Magellanic Cloud with the Einstein Observatory (Long et al. 1981), including the two prototypes CAL83 and CAL87. SSSs are characterised by very soft thermal spectra, with temperatures typically below 100 eV, and have bolometric luminosities in excess of . These sources can be divided into two groups. The first one includes the “classical” SSSs, which are characterized by bolometric luminosities in the range –. The most promising model to explain the flux emitted from such SSSs was proposed by van den Heuvel et al. (1992) to be a steady nuclear burning of hydrogen accreted onto white dwarfs with masses in the range of 0.7–1.2 M⊙. These sources are fairly common: 57 sources have been catalogued by J. Greiner111http://www.aip.de/~jcg/sss/ssscat.html up to 1999 December, but since then many more were discovered in distant galaxies by XMM-Newton and Chandra (see below). The second group includes SSSs for which the luminosity exceeds the Eddington limit for a compact object, therefore excluding unbeamed emission from steady nuclear burning of hydrogen accreted onto a white dwarf. These sources are much less common. For ultraluminous SSSs, i.e., SSS with bolometric luminosities exceeding , models involving intermediate-mass black holes (Kong & Di Stefano 2003; Swartz et al. 2002; Kong et al. 2004) or stellar-mass black holes with matter outflow (Mukai et al. 2005) have been invoked.
According to Greiner et al. (2004), 25 SSSs have been discovered in M31 of which a large fraction (30%) are found to be transient sources, with turnoff and turnon times of the order of a few months. Their luminosities are in the range –. Di Stefano & Kong (2003) found 16 SSSs in M101, 2–3 in M51, 10 in M83 and 3 in NGC~4697. Of these sources, 11 have bolometric luminosities , from which six are brighter than . In M81, Swartz et al. (2002) found 9 SSSs, including two with bolometric luminosities and one . According to Di Stefano & Kong (2003), normal SSSs in spiral galaxies appear to be associated with the spiral arms. The most luminous SSSs, however, have been found either in the arms, bulge, or disk (Swartz et al. 2002), as well as in halos (Di Stefano et al. 2003). SSSs have been found either in spiral (e.g. M31, M101, M83, M81, M104, & NGC 300), elliptical (e.g., NGC 4697), interacting (e.g., M51 and NGC~4038/NGC~4039, i.e., the Antennae) or irregular galaxies (e.g., LMC and SMC).
In this paper we report the discovery of a luminous () SSS, XMMU J005455.0374117, in the spiral galaxy NGC 300. This galaxy is a normal dwarf galaxy of type SA(s)d located at a distance of 1.88 Mpc (Gieren et al. 2005). The galaxy is seen almost face-on and has a low Galactic column density (; Dickey & Lockman 1990). The major axes of its optical disk are 13.3 kpc and 9.4 kpc (; de Vaucouleurs et al. 1991). NGC 300 was observed by ROSAT between 1991 and 1997 for a total of 46 ksec with the Position Sensitive Proportional Counter and 40 ksec with the High Resolution Imager. One SSS, XMMU J005510.7373855, was present in these observations (Read et al. 1997). This source was visible in 1992 May and June but not in 1991 December (Read & Pietsch 2001). The spectrum was well described with a thermal bremsstrahlung model with keV (Read et al. 1997).
More recently, we observed NGC 300 with XMM-Newton during its orbit 192 (2000 December 26; 37 ksec on source time) and orbit 195 (2001 January 1; 47 ksec on source time). The results of these observations have been presented by Carpano et al. (2005). A deep analysis of the SSS XMMU J005510.7373855 as seen in these observations was also performed by Kong & Di Stefano (2003). These authors report that during the 6 days between the two XMM-Newton pointings the source went from a “high state” to a “low state”, and that a 5.4 h periodicity was found during the low state. More information about this source will be given in Sect. 4. Recently, XMM-Newton re-observed NGC 300 on 2005 May 22 (orbit 998) and on 2005 November 25 (orbit 1092), for 35 ksec each.
In this paper, we focus on the analysis of a new SSS, which was present in the 2005 XMM-Newton observations, and compare its properties with the previously known SSS. For simplicity, we will refer to XMMU J005510.7373855 as SSS1 and XMMU J005455.0374117 as SSS2 in this work. Sect. 2 describes the observations and the reduction of the XMM-Newton data. In Sect. 3 we present the spectral and timing analysis of SSS2. We discuss the nature of these SSSs in Sect. 4 and conclusions are given in Sect. 5.
2 Observations and data reduction
For the 2005 May and November XMM-Newton observations, the EPIC-MOS (Turner et al. 2001) and EPIC-pn (Strüder et al. 2001) cameras were operated in their full frame mode with the medium filter. The EPIC-pn camera was centered on the previously known SSS1 ( and ). The data reduction was identical to that used in our analysis of the previous XMM-Newton observations (Carpano et al. 2005), except that version 6.5.0 of the XMM-Newton Science Analysis System (SAS) and recent calibration files were used. After screening the MOS data for proton flares using the standard procedures described by the XMM-Newton team, a total of 30 ksec of low background data remained for revolution 998. The same good time intervals were then also used for the EPIC-pn data, leaving 26 ksec of low background. No high background was present in the data of orbit 1092 where the exposure time was of 36 ksec for the MOS and 31 ksec for the pn data.
Using the SAS edetect_chain task, which performs a maximum likelihood source detection, SSS2 is detected with a likelihood of in the combined observations of orbits 998 and 1092. Following Carpano et al. (2005), we improve the X-ray positions by cross correlating positions between X-ray sources and their optical counterparts. The revised coordinates of the source are and , with an uncertainty of .
3 Timing and spectral analysis of SSS2
Fig. 1 shows the combined MOS/pn images centered on SSS2 taken during XMM-Newton observations (revolution 192 and 195, 998, and 1092). SSS2 is located close to the center of the galaxy, at a projected distance of 0.24 kpc. We also show the combined BVR optical image of the field taken with the 2.2 m MPG/ESO telescope on La Silla. See Carpano et al. (2005) and Schirmer et al. (2003) for a description of the optical data and their reduction.
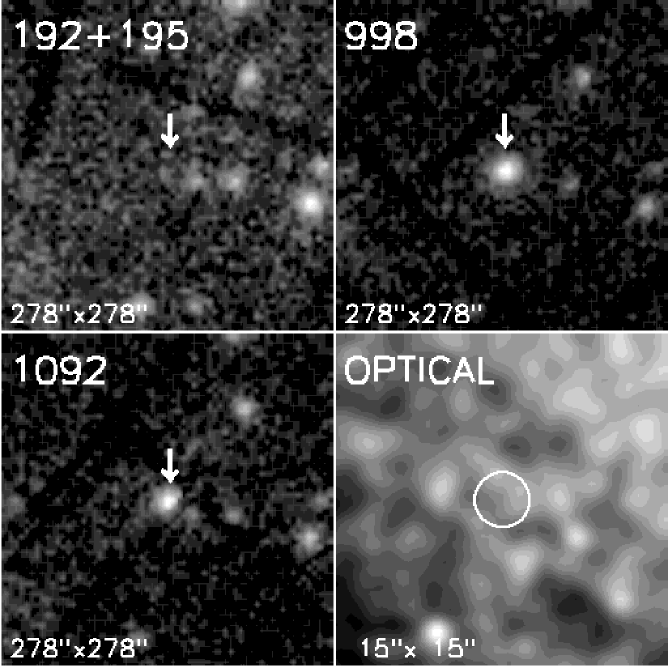
SSS2 was clearly visible in revolutions 998 and 1092 but not in revolutions 192 and 195, where the detection limiting luminosity is and , respectively (assuming a blackbody model with eV and , with a confidence level). On the other hand, SSS1 was detected in revolution 192 and 195 (Kong & Di Stefano 2003) but not in the last two revolutions where the detection limiting flux is of in both cases. SSS2 has not been detected in any of the 5 ROSAT observations, although it would have been detectable in the first four ROSAT observations (where the detection limit was ) if it had had a luminosity similar to what has been found in the XMM-Newton data. In the optical images, including data from the Optical Monitor on XMM-Newton, no counterpart has been found to be bright enough to coincide with either of the SSSs and nor does the SIMBAD catalogue list possible counterparts. Because SSS2 is located close to the center of NGC 300, the optical detection limit is high: 21.7 mag, 21.7 mag, 21.4 mag in the B, V, and R band respectively. For SSS1, located in one of the spiral arms of the galaxy, no optical counterpart brighter than coincides with the source, therefore excluding the presence of an O or early B companion star (see Carpano et al. 2005, for the optical field around the source).

Fig. 2 shows the light curve of SSS2 in revolutions 998 and 1092. Periods of high background have been excluded from the data. The light curve does not present large fluctuations. To test the significance of the source variability, we fit a constant value to the light curves (binned to 1000 s), and, from the resulting (9 for 18 dof, in rev. 998, and 31 for 33 dof, in rev. 1092), we find that the source is variable with a probability of 5% and 42%, for revolution 998 and 1092, respectively. Using periodograms and epoch-folding, no short-time periodic signal was found on timescales from 5 sec to 30 ksec.
| source (rev.) | (eV) | /dof | ( cgs) | ( cgs) | ( cgs) | |
|---|---|---|---|---|---|---|
| SSS2 (998) | / | |||||
| SSS2 (1092) | / |
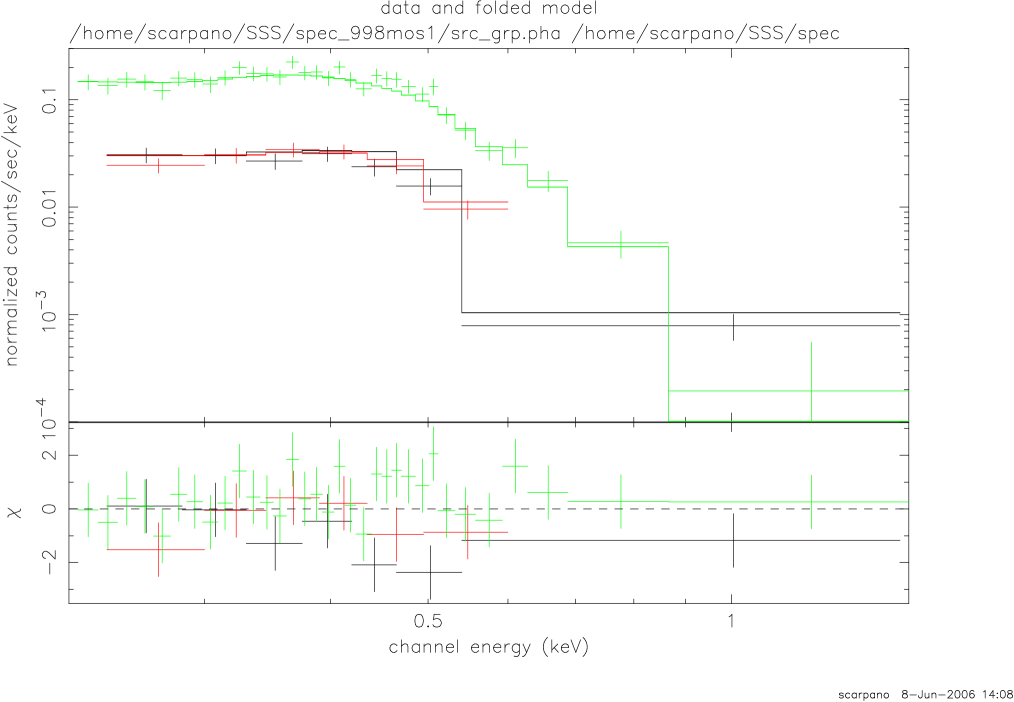
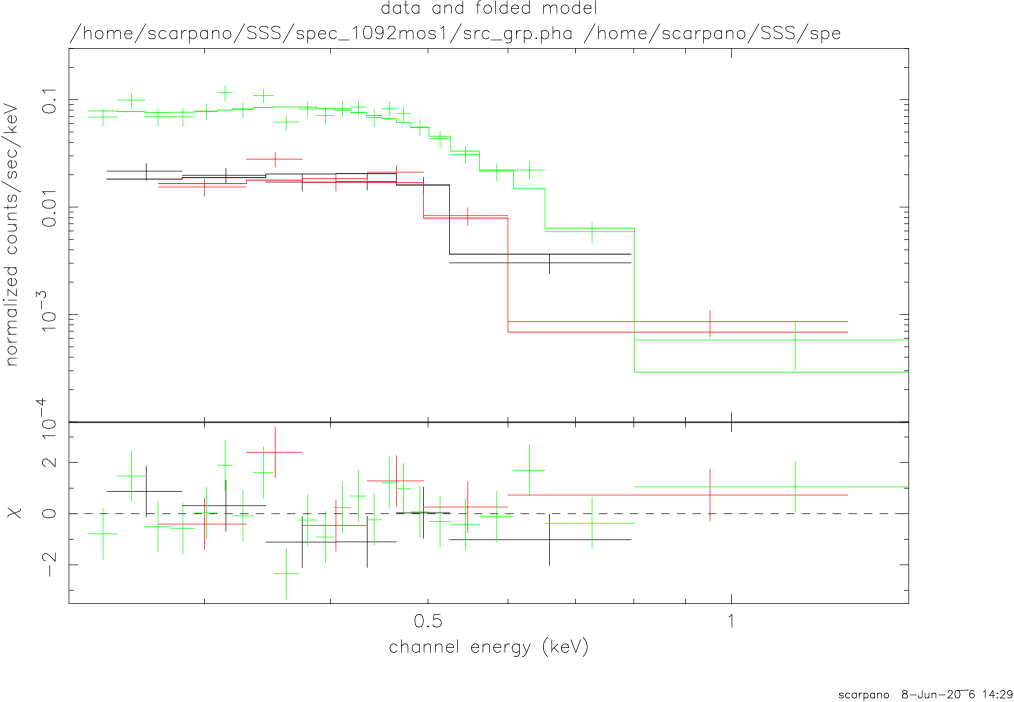
Fig. 3 shows the spectra and the best fit spectral model of SSS2 for revolutions 998 and 1092. The data were binned to have at least 35 counts in each energy bin. Results of the spectral fits, the corresponding 0.2–2 keV flux absorbed luminosities, and the bolometric luminosities are given in Table 1. During revolution 1092 SSS2 is situated on an EPIC-pn CCD gap. For this observation the flux/luminosities are calculated from the MOS1 data alone. We tried to describe the data with several spectral models, including bremsstrahlung, power-law, blackbody and disk blackbody. The blackbody and disk blackbody are the only models that provide a reasonable value for the reduced , (). The spectral fit parameters and flux resulting from the disk blackbody model are very similar to that provided by the simple blackbody model. Therefore, for simplicity, we assume the simple blackbody model in the rest of the paper. As suggested by Mukai et al. (2005), we also tried an ionized model for the absorption (implemented in XPSEC as absori), but the spectral parameters corresponding to this model cannot be constrained and the best-fit model is a neutral absorber (ionization state ).
From the results of Table 1 we see that within 6 months the absorbing column slightly decreased (although the associated errors are very large), the temperature increased, and the observed luminosity dropped by a factor of 1.7.
Bolometric luminosities of supersoft sources are difficult to determine due to the large uncertainty associated with the absorbing column. In our case, a blackbody model associated with photo-electric absorption provides a low value () and any other suitable model does not significantly change the bolometric luminosity. Using these considerations, we therefore conclude that the high luminosity of SSS2, which is above the Eddington luminosity of a white dwarf, excludes the presence of unbeamed emission from steady nuclear burning of hydrogen accreted onto a white dwarf. In the next section we discuss the models that could explain the nature of the SSSs observed in NGC 300 after summarizing the information we have on the previously known SSS1.
4 The nature of SSS1 and SSS2
4.1 What do we know about SSS1?
SSS1 is a transient source: the observed luminosity changed by at least a factor of 35 (we measured an observed luminosity of while the XMM-Newton detection threshold is ). The source has been detected in the ROSAT data of 1992 May/June (Read & Pietsch 2001) and in the XMM-Newton data of 2002 December/2001 January (Kong & Di Stefano 2003; Carpano et al. 2005). In the highest luminosity state, the source could have been observed in the ROSAT data of 1991 November/1992 January, 1994 June and 1995 May, and certainly in the XMM-Newton observations of 2005 May and November. The source has thus been detected in two epochs spaced by 8 years. Kong & Di Stefano (2003) performed a deep analysis of the source and found it to be very luminous (–) and very soft ( eV). Using the most recent calibration files, we re-evaluated the bolometric luminosity of SSS1 to in revolution 192 and in revolution 195, at a confidence level of 99%.
Read & Pietsch (2001) reported that the count rate of SSS1 in 1992 May () is equivalent to that of 1992 June (). This result suggests that the duration of the outburst decline is several months and that the decrease in luminosity within the 6 days separating the two first XMM-Newton observations is just a short term flux modulation. In the light curve of SSS1 during revolution 195, there are two luminosity decreases lasting 5 ksec, separated by 20 ksec. Using a Lomb-Scargle periodogram analysis (Lomb 1976; Scargle 1982), Kong & Di Stefano (2003) claim that the modulation present in the light curve is periodic at a confidence level 99.9% and conclude that this periodicity could be associated with the orbital period of the system. Assuming white noise variability, however, is not an adequate assumption for X-ray binaries where many systems show strong variability on timescales of hours. Using the Monte Carlo approach of Benlloch et al. (2001), we re-evaluated the confidence level assuming a red-noise process instead of pure white noise. We found that the 5.4 h period is significant only at the 68% confidence level. Much longer observations than the existing ones are therefore required to be able to associate the 5.4 h feature with some periodic signal, which might or might not be related to the orbital period of the system.
The properties of SSS1 make it a very similar source to SSS2. They both can be modelled with absorbed blackbodies with a temperature of eV, they both present transient behaviour, and their maximal bolometric luminosities observed in X-rays are in both cases close to . The SSSs in NGC 300 therefore have a luminosity in their high state that classifies them as intermediate between the well-known ‘classical’ SSSs and the ultraluminous SSSs. As we discussed in Sect. 1, this kind of system has not been well studied and only a few such sources have been reported. Orio (2005) observed a variable SSS in M 31, r3-8, with a luminosity in the high state at erg s-1. Two other SSSs were observed in M 81 and one in M 101 (Swartz et al. 2002; Di Stefano & Kong 2003), all with . The few observations of these SSSs, however, cannot establish a possibly transient behaviour nor the highest luminosity levels reached by the sources.
4.2 Interpretations for the high and soft state of the sources
The most natural explanation for these SSSs would be a steady nuclear burning of hydrogen accreted onto a white dwarf (WD). However, as shown in the previous section, the bolometric luminosity is above the Eddington limit for a compact object (). To explain the nature of the variable ultraluminous supersoft X-ray source in the Antennae, Fabbiano et al. (2003) suggested beamed emission from nuclear burning onto a WD, with a beaming factor, , where is the inferred isotropic luminosity of the blackbody and the true source luminosity. They suggest that the most likely cause of the anisotropy would be a warping of the accretion disk. In our case the beaming factor would be only of 0.25.
Another model, suggested by Kong & Di Stefano (2003), Kong et al. (2004), and Swartz et al. (2002) to explain the luminous SSS(s) present in NGC 300, M 101 and M 81, respectively, is the presence of an intermediate-mass black hole in the source. Assuming a blackbody model, with eV, a luminosity of , and assuming that the X-ray emission comes from the innermost stable orbit, Kong & Di Stefano (2003) estimate the mass of the black hole to . For our SSS, this hypothesis seems very unlikely: when observed in the ‘high’ state, this massive black hole would emit only at of its Eddington limit (), and much lower in the quiescent state. However, as reported by Nowak (1995) for stellar-mass black holes, below a few percent of the Eddington luminosity, the sources are dominated by hard non-thermal emission and soft emission is only observed once the source luminosity increases by several percent of the Eddington luminosity.
Another model was suggested by Mukai et al. (2003) and Fabbiano et al. (2003) to explain the SSS ULX in M 101 and in the Antennae, respectively. In this model, when material is accreted above the Eddington rate, the excess of matter is ejected from the inner part of the disk. The electron scattering opacity induced by the wind/outflow involves supersoft blackbody emission from a photosphere of – cm. King & Pounds (2003) re-analysed this model in more detail: assuming a radial outflow with an outflow rate in a double cone occupying a solid angle , at a constant speed, they showed that the outflow is Compton-thick for . This result is true for , when scattering of photons from the sides of the outflow is negligible, and for , when scattering is dominant. The emission is therefore mainly thermalized and observed as a soft spectral component (King & Pounds 2003). The authors also evaluated the temperature of this soft blackbody component as:
| (1) |
where or (for or ), , and , and is the mass of the accretor. These results confirm the hypothesis and observations of the SSS ULX from Mukai et al. (2003) and Fabbiano et al. (2003). For the SSSs in NGC 300, the accretion rate , where is the luminosity and the radiative efficiency, is , if we take a typical value of . This accretion rate value is not extreme considering that the system is observed in a high/outburst state. Furthermore, assuming the source is close to the Eddington limit, where , we are able to estimate the mass of the accreting object, using equation 1. Fixing the temperature at 60 eV and the luminosity at 81038 erg s-1, the mass is
| (2) |
Except for very low values of (), is between 1 and 2, while goes from 0.06 for a non-rotating black hole to 0.42 for an maximally rotating black hole. This results in a mass range between and , i.e., at the lower limit of the mass range for black holes in our Galaxy.
As a last model, we consider the viewing angle dependence of the emission of supercritical accretion flows (Watarai et al. 2005), i.e., accretion flows with a mass accretion rate that is so large that the accretion disk becomes geometrically thick due to enhanced radiation pressure. In this case, if the binary system is viewed at high inclination, the outer part of the disk occults its inner parts, such that only the very soft spectrum from the outer disk is observable. For such a flow around a black hole, Watarai et al. (2005) showed that the emitted spectrum resembles a 2 keV blackbody at low inclination angle () and looks like a 0.6 keV blackbody at . Consequently, when viewed edge-on, such a system will appear very faint. This is also the argument given by Narayan & Mc Clintock (2005) to explain why none of their 20 studied black hole X-ray binaries present eclipses. In our case, although with 60 eV the observed temperature is still lower than in the example given by Watarai et al. (2005) for a black hole, we believe that this model is consistent with our observations. When the outburst state observed in SSS2 begins to decline, an inner part of the disk would be visible, explaining the harder blackbody component in the spectrum of rev. 1092.
5 Conclusions
We report the discovery of a new luminous supersoft source in the 2005 May XMM-Newton observation of NGC 300. The previously known luminous supersoft source detected by ROSAT and the previous XMM-Newton data was below detectability. This latter source already appeared highly variable in the ROSAT observations.
No object in the SIMBAD catalogue is associated with the new SSS, and, from the optical data, no counterpart brighter than 21.7 mag (24.5 mag for the previous known SSS) has been found.
The X-ray spectrum is well described by an absorbed blackbody at temperatures of 60 eV. The bolometric luminosity, in the highest observed state, is and dropped to six months later.
The SSSs in NGC 300 are brighter than “classical” SSSs, for which steady nuclear burning of hydrogen accreted onto white dwarfs has been suggested to explain their nature. They are too faint, however, to be classified as ultraluminous sources. We summarized several possible explanations for their nature. These involve beaming emission from a WD, intermediate-mass black hole (IMBH) or a stellar-mass black hole with matter outflow or observed at high inclination angle. Except the one including IMBH, which seems unlikely in our case, all models are consistent with our observations.
Acknowledgements.
This paper is based on observations with XMM-Newton, an ESA science mission with instruments and contributions directly financed by the ESA Member States and the USA (NASA), and on observations made with ESO Telescopes at the La Silla observatory and retrieved from the ESO archive. We acknowledge partial support from DLR grant 50OX0002. This work was supported by the BMBF through the DLR under the project 50OR0106, by the BMBF through DESY under the project 05AE2PDA/8, and by the Deutsche Forschungsgemeinschaft under the project SCHN 342/3-1.References
- Benlloch et al. (2001) Benlloch, S., Wilms, J., Edelson, R. A., & Yaqoob, T. 2001, ApJ, 562, L121
- Carpano et al. (2005) Carpano, S., Wilms, J., Schirmer, M., & Kendziorra, E. 2005, A&A, 443, 103
- de Vaucouleurs et al. (1991) de Vaucouleurs, G., de Vaucouleurs, A., Corwin, jr., H., et al. 1991, Third Catalogue of Bright Galaxies (New York: Springer)
- Dickey & Lockman (1990) Dickey, J. M. & Lockman, F. J. 1990, ARA&A, 28, 215
- Di Stefano & Kong (2003) Di Stefano, R. & Kong, A. K. H. 2003, ApJ, 592, 884
- Di Stefano et al. (2003) Di Stefano, R., Kong, A. K. H., VanDalfsen, M. L., Harris, W. E., Murray, S. S. & Delain, K. M. 2003, ApJ, 599, 1067
- Fabbiano et al. (2003) Fabbiano, G., King, A. R., Zezas, A., Ponman, T. J., Rots, A. & Schweizer, F. 2003, ApJ, 591, 843
- Gieren et al. (2005) Gieren, W., Pietrzyński, G., Soszyński, I., Bresolin, F., Kudritzki, R.-P., Minniti, D. & Storm, J. 2005, ApJ, 628, 695
- Greiner et al. (2004) Greiner, J., Di Stefano, R., Kong, A. & Primini, F. 2004, ApJ, 610, 261
- King & Pounds (2003) King, A. R. & Pounds, K. A. 2003, MNRAS, 345, 657
- Kong & Di Stefano (2003) Kong, A. K. H. & Di Stefano, R. 2003, ApJ, 590, L13
- Kong et al. (2004) Kong, A. K. H., Di Stefano, R. & Yuan, F. 2004, ApJ, 617, L49
- Lomb (1976) Lomb, N. R, 1976, Ap&SS, 39, 447
- Long et al. (1981) Long, K. S., Helfand, D. J. & Grabelsky, D. A. 1981, ApJ, 248, 925
- Mukai et al. (2003) Mukai, K., Pence, W. D., Snowden, S. L. & Kuntz, K. D. 2003, ApJ, 582, 184
- Mukai et al. (2005) Mukai, K., Still, M., Corbet, R. H. D., Kuntz, K. D. & Barnard, R. 2005, ApJ, 634, 1085
- Narayan & Mc Clintock (2005) Narayan, R. & Mc Clintock, J. E. 2005, ApJ, 623, 1017
- Nowak (1995) Nowak, M. A. 1995, PASP, 107, 1207
- Orio (2005) Orio, M. 2005, ApJ, in press (astro-ph/0512016)
- Read & Pietsch (2001) Read, A. M. & Pietsch, W. 2001, A&A, 373, 473
- Read et al. (1997) Read, A. M., Ponman, T. J. & Strickland, D. K. 1997, MNRAS, 286, 626
- Scargle (1982) Scargle, J. D., 1982, 263, 835
- Schirmer et al. (2003) Schirmer, M., Erben, T., Schneider, P., et al. 2003, A&A, 407, 869
- Strüder et al. (2001) Strüder, L., Briel, U., Dennerl, K., et al. 2001, A&A, 365, L18
- Swartz et al. (2002) Swartz, D. A., Ghosh, K. K., Suleimanov, V., Tennant, A. F. & Wu, K. 2002, ApJ, 574, 382
- Turner et al. (2001) Turner, M. J. L., Abbey, A., Arnaud, M., et al. 2001, A&A, 365, L27
- van den Heuvel et al. (1992) van den Heuvel, E. P. J., Bhattacharya, D., Nomoto, K. & Rappaport, S. A. 1992, A&A, 262, 97
- Watarai et al. (2005) Watarai, K.-Y., Ohsuga, K., Takahashi, R. & Fukue, J. 2005, PASJ, 57, 513