The Short-Hard GRB 051103: Observations and implications for its nature
Abstract
The bright short-hard GRB 051103 was triangulated by the inter-planetary network and found to occur in the direction of the nearby M81/M82 galaxy group. Given its possible local-Universe nature, we searched for an afterglow associated with this burst. We observed the entire 3- error quadrilateral using the Palomar 60-inch robotic telescope and the Very Large Array (VLA) about three days after the burst. We used the optical and radio observations to constrain the flux of any afterglow related to this burst, and to show that this burst is not associated with a typical supernova out to . Our optical and radio observations, along with the Konus/Wind gamma-ray energy and light curve are consistent with this burst being a giant flare of a Soft Gamma-ray Repeater (SGR) within the M81 galaxy group. Furthermore, we find a star forming region associated with M81 within the error quadrilateral of this burst which supports the SGR hypothesis. If confirmed, this will be the first case of a soft gamma-ray repeater outside the local group.
Subject headings:
gamma rays: bursts: individual: GRB 051103 — stars: neutron — galaxies: individual (M81, M82)1. Introduction
The recent discovery of short-hard Gamma-Ray Bursts (GRB) afterglows in the X-ray (Gehrels et al. 2005; Fox et al. 2005), optical (Hjorth et al. 2005), and radio (Berger et al. 2005) demonstrates that short-hard GRBs reside in both early- and late-type galaxies with at least some preference for old systems (e.g. Gal-Yam et al. 2005; Tanvir et al. 2005) and release energy of the order of erg. With the detection of the giant flare of the 2004 December 27, from the Soft Gamma-ray Repeater (SGR) 180620 (e.g. Hurley et al. 2005), it has been suggested that a fraction (or all) of the short-hard bursts population originates from giant flares of SGR in nearby galaxies (e.g. Dar 2005; Hurley et al. 2005). This idea was based on the observed Galactic rate of SGR giant flares and the star formation rate in the local Universe. However, the fraction of extragalactic SGR flares among short-hard GRBs was shown to be small (Nakar et al. 2006; Gal-Yam et al. 2005; Palmer et al. 2005; Popov & Stern 2005; Lazzati et al. 2005; Ofek 2006). In contrast with the evidence associating short-hard GRBs with old stellar population (e.g. Nakar et al. 2005a), SGRs seem to emerge from young population objects (e.g. Gaensler et al. 2001; see however Levan et al. 2006; for a recent review on SGRs see Woods & Thompson 2006).
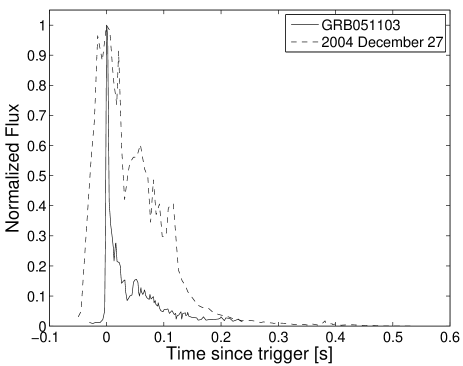
On UTC 2005 November 3 09:25:43.785, a short-hard GRB with s duration was detected (Golenetskii et al. 2005) by five satellites, of the Inter-Planetary Network (IPN; e.g. Hurley et al. 1999), carrying gamma-ray detectors: Konus/Wind; HETE/Fregate; Mars Odyssey/GRS; Mars Odyssey/HEND; RHESSI; and Swift/BAT. The GRB fluence in the Konus/Wind keV- MeV band was erg cm-2, and its peak flux on two-milliseconds time scale was erg cm-2 s-1 ( confidence). This peak flux was one of the largest ever observed for Konus-Wind short GRBs, second only to GRB 031214 (Hurley et al. 2003). Moreover, comparing the burst fluence with the distribution of the integrated four-channel fluence of all BATSE short-hard bursts, we find it to be in the th percentile. The light curve, shown in Figure 1 (solid line), has a very steep rise on milliseconds time scale and a weak decaying tail on time scale of s.
The IPN 3- error box, totaling 260 square arcminutes, includes the outskirts of the nearby galaxies M81 and M82. At first glance, the error region seems to exclude the main body of M81 or M82 (see however §2).
In this paper, we present new optical and radio observations of M81 and M82 region which cover the entire IPN error quadrilateral, taken several days after the burst, and use them to put limits on any afterglow emission related to this GRB. We combine these with Galaxy Evolution Explorer (GALEX) archival data, and discuss the implications for the nature of this burst.
2. Observations
Figure 2 shows the IPN error quadrilateral of GRB 051103, plotted over the Palomar Sky Survey (POSS) II R-band image of this field. The error quadrilateral is the elongated box running from south-west to north-east.
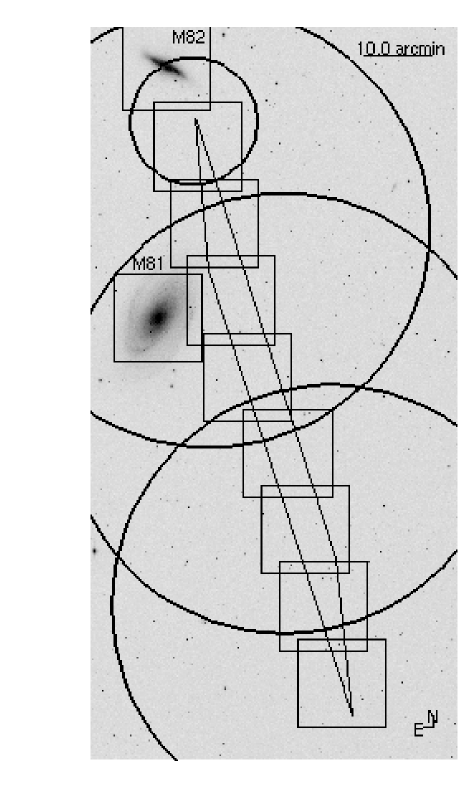
We observed the IPN error quadrilateral using the Palomar 60-inch robotic telescope, equipped with a kk SITe CCD with a pixel scale of pix-1, in R-band under good conditions. We acquired eight pointings which cover the error quadrilateral and two pointings centered on M81 and M82. The field of view of the pointings are marked as boxes in Fig. 2.
| Field Name | R.A. J2000.0 Dec. | Date | Exp. Time |
|---|---|---|---|
| [s] | |||
| 1 | 09:50:36.0 +68:11:42 | 2005-11-06.390 | 900 |
| 2005-11-15.351 | 540 | ||
| 2 | 09:51:12.0 +68:22:48 | 2005-11-06.397 | 900 |
| 2005-11-15.384 | 540 | ||
| 3 | 09:51:48.0 +68:33:54 | 2005-11-06.407 | 900 |
| 2005-11-15.389 | 540 | ||
| 4 | 09:52:24.0 +68:45:00 | 2005-11-06.419 | 900 |
| 2005-11-15.406 | 540 | ||
| 5 | 09:53:00.0 +68:56:06 | 2005-11-06.462 | 1800 |
| 2005-11-12.343 | 540 | ||
| 6 | 09:53:36.0 +69:07:12 | 2005-11-06.484 | 1620 |
| 2005-11-12.346 | 540 | ||
| 7 | 09:54:12.0 +69:18:18 | 2005-11-06.486 | 540 |
| 2005-11-12.360 | 540 | ||
| 8 | 09:54:48.0 +69:29:24 | 2005-11-06.498 | 540 |
| 2005-11-12.367 | 540 | ||
| M81 | 09:55:33.2 +69:03:55 | 2005-11-08.374 | 900 |
| 2005-11-15354 | 900 | ||
| M82 | 09:55:52.2 +69:40:49 | 2005-11-07.352 | 1080 |
| 2005-11-15.339 | 900 |
Note. — The typical seeing during these nights was about , except on November 15th in which it was about . The Moon phase on November 6th was and on November 15th it was .
The log of observations is presented in Table 1. The first epoch images of the error quadrilateral (pointings one to eight) were obtained to days after the GRB trigger. We note that GRB 051103 was announced about 2.4 d after the GRB occured. Comparison of the two-epochs by image-blinking and image-subtraction using ISIS (Alard & Lupton 1998), did not reveal any optical transient to a limiting magnitude of within the error quadrilateral and within the cores of M81 and M82. We clearly detected, however, one variable point source within the error quadrilateral. The source at is cataloged by Perelmuter & Racine (1995; ; ; ). As this detection is due to variability of a previously cataloged source, we do not consider it interesting for our purposes.
We observed the field of GRB 051103 with the Very Large Array111The Very Large Array is operated by the National Radio Astronomy Observatory, a facility of the National Science Foundation operated under cooperative agreement by Associated Universities, Inc. (VLA) in its most compact (D) configuration. All observations were taken in standard continuum observing mode with a band width of MHz. We used 3C 48 for flux calibration, and for phase referencing we used the calibrator J0949662. Data were reduced using standard packages within the Astronomical Image Processing System (AIPS). The first epoch observation, beginning UT 2005 November , was conducted at a frequency of GHz. We imaged the entire IPN error region with three VLA pointings, which are marked as large circles in Fig. 2. We found no new sources to the limit of the NRAO VLA Sky Survey (NVSS; Condon et al. 1998). The rms noise varied from mJy at the southern edge of the IPN error quadrilateral, to mJy at the northern end (due to residual flux from M82). We also observed a -arcminutes radius around the southern part of M82, marked as a small circle in Fig. 2, on UT 2005 November 8.45 at a frequency of 4.86 GHz. A comparison between this image and the NVSS image of the same region did not reveal any new source above 1.5 mJy (3-).
| Name | R.A. J2000.0 Dec. | FUVaaGALEX FUV/NUV specific flux. To correct for Galactic extinction the NUV flux should be multiplied by 1.75 (Cardelli, Clayton, & Mathis 1989; Schlegel, Finkbeiner, & Davis 1998). | NUVaaGALEX FUV/NUV specific flux. To correct for Galactic extinction the NUV flux should be multiplied by 1.75 (Cardelli, Clayton, & Mathis 1989; Schlegel, Finkbeiner, & Davis 1998). | BbbApproximate optical B/R-band specific flux from the USNO-B1.0 catalog (Monet et al. 2003). | RbbApproximate optical B/R-band specific flux from the USNO-B1.0 catalog (Monet et al. 2003). |
|---|---|---|---|---|---|
| Jy | Jy | Jy | Jy | ||
| A | 09:54:06.52 69:18:34.0 | 70 | 70 | ||
| B | 09:54:11.05 69:18:18.9 | 340 | 10 | ||
| C | 09:54:06.66 69:13:43.0 | 20 | 30 | ||
| D | 09:54:04.76 69:13:23.7 | ||||
| E | 09:53:50.69 69:14:00.0 | ||||
| FccGlobular cluster in M81 (Object number 70319 in Perelmuter & Racine 1995). | 09:53:43.25 69:13:23.1 | 20 | 30 | ||
| G | 09:53:45.30 69:13:17.5 | 20 | |||
| HddHigh proper motion star: GPM 148.564612+69.340917. | 09:54:15.33 69:20:26.9 | 23300 | 24000 |
Note. — Selected UV sources within the error quadrilateral of GRB 051103, found near the extension of the northern spiral arm of M81.
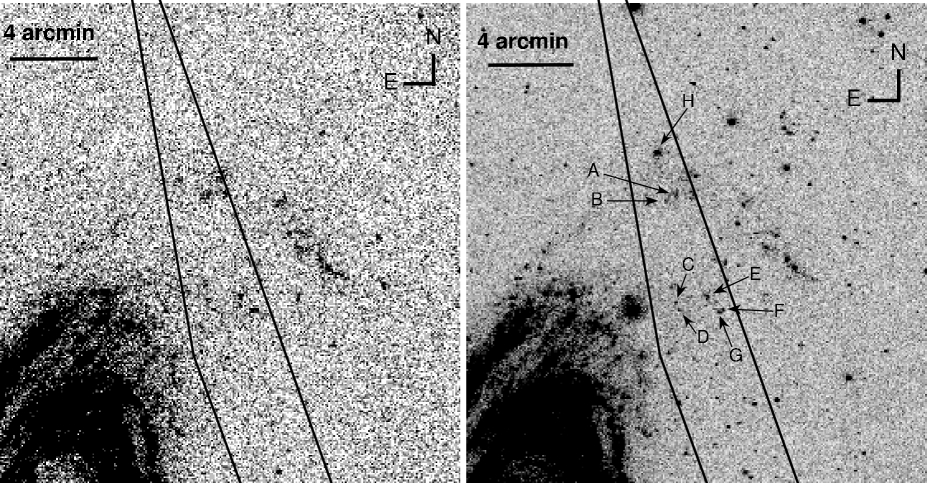
M81 was the subject of several detailed studies. For example: Matonick & Fesen (1997) conducted an optical search for supernova remnants; Petit et al. (1988) and Lin et al. (2003) searched for HII regions in M81 and measured their properties; and recently Pérez-González (2006) conducted a multi-wavelength study of star formation in M81. However, none of these studies cover the IPN error quadrilateral. To search for possible star forming regions in M81/M82 that coincides with the IPN error quadrilateral, we inspected the GALEX UV images of M81 and M82 (Hoopes et al. 2005). Figure 3 shows the GALEX near UV (NUV) and far UV (FUV) images, with the IPN error quadrilateral overlayed. A region containing several UV-bright knots, in an extension of the northern arm of M81, is clearly seen within the error quadrilateral. Several of the brightest UV sources, found within the error quadrilateral, are marked by arrows and their UV and optical fluxes are listed in Table 2. Some of these sources are extended (in the POSS images) and blue, and may be a young star forming regions in the outskirts of M81. Assuming they are at the distance of M81, the brightness of each of these sources in the Near UV is equivalent to (at least) several tens of young O stars.
3. Discussion
The IPN error quadrilateral of the bright GRB 051103 includes the outskirts of the nearby ( Mpc; Freedman et al. 1994) galaxies M81 and M82 which are among the ten optically-brightest galaxies in the sky.
Assuming that GRB 051103 is related to the M81/M82 group, and using a distance modulus of (Freedman et al. 1994), and Galactic extinction (Schlegel et al. 1998), our null detection of any optical transients implies an upper limit of on the R-band absolute magnitude of an optical transient. This limit is comparable to the absolute magnitude of novae, that peaks at to (e.g. della Valle & Livio 1995) and rule out the possibility that this event is associated with a typical supernova (unless , which rules out a source in the local Universe). The optical limit also rules out some of the macronovae models (assuming the distance of M81) recently explored by Kulkarni (2005).
Given the observational properties of GRB 051103, two questions arises: is it associated with the M81/M82 group? And is it an SGR flare or “genuine” short-hard GRB? Below, we explore the different possibilities and confront them with the observational facts.
3.1. An SGR in M81
Assuming GRB 051103 was originated in M81, the energy from this burst, erg (including the uncertainty in distance to M81; Freedman et al. 1994), is comparable to the energy of the most luminous SGR giant flare yet detected. For comparison, the isotropic energy release of the 1979 March 5 SGR flare was erg, that of 1998 August 27 flare was erg, while the energy release from the 2004 December 27 giant flare was as much as erg (Hurley et al. 2005; Palmer et al. 2005), where is the distance to SGR 180620 in kpc units. As shown in Fig. 1, the gamma-ray light curve of this burst has a rise-time of about a millisecond, which is characteristic of SGR giant flares (as well as less energetic flares). Moreover, it is composed of a single major peak – similar to other SGR flares. Note that many, but not all, short-hard GRB light curves show a more complex temporal structure as observed in BATSE bursts (Nakar & Piran 2002), as well as in recent Swift bursts (e.g. GRB 051221; Parsons et al. 2005).
Known SGRs are associated with star-forming regions (Gaensler et al. 2001). Therefore, if GRB 051103 was an SGR giant flare in M81 or M82, then we expect it to occur within a young star forming region. Indeed, we have found UV sources indicating a young stellar population, in an extension of the M81 northern spiral arm, within the IPN error quadrilateral (see Fig. 3 and Table 2).
The SGR-origin idea is consistent with our radio observational limits. An extrapolation of the GHz specific flux of SGR 180620 (Cameron et al. 2005) to three days after the burst, suggests that the specific flux of a 2004 December 27-like event in M81, three days after the GRB, would be d mJy, significantly below our VLA limit.
The gamma-ray spectrum is an important clue for the nature of such bursts (e.g. Lazzati, Ghirlanda, & Ghisellini 2005). Unfortunately, the gamma-ray spectrum of GRB 051103 was not published. Therefore, it is not clear if the spectrum can be described by a black body spectrum, as observed in the 2004 December 27 giant flare. Assuming the spectrum is consistent with that of a black-body, the peak energy of GRB 051103, MeV (Golenetskii et al. 2005), is translated to a black body peak energy () of MeV. Given the peak flux (on a two-milliseconds time scale), and the distance to M81, the peak luminosity of GRB 051103 is about erg s-1. The black-body radius inferred from this luminosity is km. This radius is comparable to the radius inferred for the 2004 December 27 giant flare, obtained in a similar way (Hurley et al. 2005; Nakar, Piran, & Sari 2005b). Intriguingly, these radii are comparable to the typical radius of neutron stars.
3.2. Short-hard GRB in the background
Another possibility, already suggested by Lipunov et al. (2005), is that GRB 051103 is actually a genuine short-hard GRB. In this case, given the observed energy release from other short-hard GRBs (e.g. erg; Berger et al. 2005), this burst is more likely a background event unrelated to M81/M82. If however, it was a genuine short-hard GRB in M81 then we need to invoke a fainter population of short-hard GRBs, for which the implied rate will be higher than current estimates (e.g. Nakar et al. 2006).
Scaling the radio and optical properties of the afterglow of the relatively well observed short-hard GRB 050724 (Berger et al. 2005), by the ratio of gamma-ray fluence of GRB 051103 to GRB 050724, we estimate that at the time of our VLA observation, GRB 051103 should have had a mJy radio afterglow (at 8.46 GHz) – an order of magnitude above our detection limit. Moreover, the non-detection of an optical afterglow, assuming a power-law decay, implies that the optical decay power-law was . However, the afterglow properties of short-hard GRBs are non-homogeneous (e.g. Berger et al. 2005; Hjorth et al. 2005; Bloom et al. 2006). Therefore, our observations can not rule out the possibility that this event was a genuine short-hard GRB.
If GRB 051103 was a genuine short-hard GRB in the background of M81, then we expect the spectrum to be non-thermal. In this case, the fact that this GRB is optically thin to gamma-ray photons allows to put a lower limit on its Lorentz factor (i.e. the “compactness problem”). We used the recipe of Lithwick & Sari (2001) to estimate a lower limit on the Lorentz factor, . We assumed that the gamma-ray spectrum of GRB 051103 is described by a Band spectrum (Band et al. 1993), and used the duration of the event ( s), the peak energy, and the fluence within the Konus/Wind spectral-band. Assuming the gamma-ray spectrum of GRB 051103 can indeed be described by a Band-spectrum, and the distance to the GRB is Mpc (500 Mpc) we can set a lower limit of (), on the Lorentz factor of GRB 051103.
To conclude, although we can not rule out the possibility that GRB 051103 was a genuine short-hard GRB, the SGR giant flare appears to be the simplest interpretation of this event. The decay time, the peak luminosity and isotropic energy release, the presence of UV sources in the error quadrilateral, and the lack of optical and radio afterglow are all consistent with this burst being a giant flare from an SGR in M81. The spectrum of GRB 051103 has not been published. If a future analysis of the gamma-ray spectrum of GRB 051103 will show it is consistent with a black body spectrum, this will be another important evidence in favor of the SGR origin of this burst.
References
- Alard & Lupton (1998) Alard, C., & Lupton, R. H. 1998, ApJ, 503, 325
- Band et al. (1993) Band, D., et al. 1993, ApJ, 413, 281
- Berger et al. (2005) Berger, E., et al. 2005, Nature, 438, 988
- Bloom et al. (2006) Bloom, J. S., et al. 2006, ApJ, 638, 354
- Cameron et al. (2005) Cameron, P. B., et al. 2005, Nature, 434, 1112
- Cardelli et al. (1989) Cardelli, J. A., Clayton, G. C., & Mathis, J. S. 1989, ApJ, 345, 245
- Cheng et al. (1996) Cheng, B., Epstein, R. I., Guyer, R. A., & Young, C. 1996, Nature, 382, 518
- Condon et al. (1998) Condon, J. J., Cotton, W. D., Greisen, E. W., Yin, Q. F., Perley, R. A., Taylor, G. B., & Broderick, J. J. 1998, AJ, 115, 1693
- Dar (2005) Dar, A. 2005, GRB Coordinates Network, 2942, 1
- della Valle & Livio (1995) della Valle, M., & Livio, M. 1995, ApJ, 452, 704
- Fox et al. (2005) Fox, D. B., et al. 2005, Nature, 437, 845
- Freedman et al. (1994) Freedman, W. L., et al. 1994, ApJ, 427, 628
- Gaensler et al. (2001) Gaensler, B. M., Slane, P. O., Gotthelf, E. V., & Vasisht, G. 2001, ApJ, 559, 963
- Gal-Yam et al. (2005) Gal-Yam, A., et al. 2005, astro-ph/0509891
- Gehrels et al. (2005) Gehrels, N., et al. 2005, Nature, 437, 851
- Golenetskii et al. (2005) Golenetskii, S., et al. 2005, GRB Coordinates Network, 4197, 1
- Hjorth et al. (2005) Hjorth, J., et al. 2005, Nature, 437, 859
- Hoopes et al. (2005) Hoopes, C. G., et al. 2005, ApJL, 619, L99
- Hurley et al. (1994) Hurley, K. J., McBreen, B., Rabbette, M., & Steel, S. 1994, A&A, 288, L49
- Hurley et al. (1999) Hurley, K., Briggs, M. S., Kippen, R. M., Kouveliotou, C., Meegan, C., Fishman, G., Cline, T., & Boer, M. 1999, ApJS, 120, 399
- Hurley et al. (2003) Hurley, K., et al. 2003, GRB Coordinates Network, 2492, 1
- Hurley et al. (2005) Hurley, K., et al. 2005, Nature, 434, 1098
- Kulkarni (2005) Kulkarni, S. R. 2005, astro-ph/0510256
- Laros et al. (1987) Laros, J. G., et al. 1987, ApJL, 320, L111
- Lazzati et al. (2005) Lazzati, D., Ghirlanda, G., & Ghisellini, G. 2005, MNRAS, 362, L8
- Levan et al. (2006) Levan, A. J., Wynn, G. A., Chapman, R., Davies, M. B., King, A. R., Priddey, R. S., & Tanvir, N. R. 2006, MNRAS, 368, L1
- Lin et al. (2003) Lin, W., et al. 2003, AJ, 126, 1286
- Lipunov et al. (2005) Lipunov, V., et al. 2005, GRB Coordinates Network, 4206, 1
- Lithwick & Sari (2001) Lithwick, Y., & Sari, R. 2001, ApJ, 555, 540
- Matonick & Fesen (1997) Matonick, D. M., & Fesen, R. A. 1997, ApJS, 112, 49
- Monet et al. (2003) Monet, D. G., et al. 2003, AJ, 125, 984
- Nakar & Piran (2002) Nakar, E., & Piran, T. 2002, MNRAS, 330, 920
- Nakar et al. (2006) Nakar, E., Gal-Yam, A., Piran, T., & Fox, D. B. 2006, ApJ, 640, 849
- Nakar et al. (2005a) Nakar, E., Gal-Yam, A., & Fox, D. B. 2005a, astro-ph/0511254
- Nakar et al. (2005b) Nakar, E., Piran, T., & Sari, R. 2005b, ApJ, 635, 516
- Ofek (2006) Ofek, E. O. 2006, in prep.
- Palmer et al. (2005) Palmer, D. M., et al. 2005, Nature, 434, 1107
- Parsons et al. (2005) Parsons, A., et al. 2005, GRB Coordinates Network, 4363, 1
- Perelmuter & Racine (1995) Perelmuter, J.-M., & Racine, R. 1995, AJ, 109, 1055
- Perez-Gonzalez et al. (2006) Pérez-González, P. G., et al. 2006, ArXiv Astrophysics e-prints, astro-ph/0605605
- Petit et al. (1988) Petit, H., Sivan, J.-P., & Karachentsev, I. D. 1988, A&AS, 74, 475
- Popov & Stern (2005) Popov, S. B., & Stern, B. E. 2005, MNRAS, 1092
- Schlegel et al. (1998) Schlegel, D. J., Finkbeiner, D. P., & Davis, M. 1998, ApJ, 500, 525
- Tanvir et al. (2005) Tanvir, N. R., Chapman, R., Levan, A. J., & Priddey, R. S. 2005, Nature, 438, 991
- Terasawa et al. (2005) Terasawa, T., et al. 2005, Nature, 434, 1110
- Woods & Thompson (2004) Woods, P. M., & Thompson, C. 2006, in Compact Stellar X-ray Sources, Eds. W.H.G. Lewin & M. van der Klis, Cambrideg University Press, astro-ph/0406133