Characterization of Dusty Debris Disks: The IRAS and Hipparcos Catalogs
Abstract
Dusty debris disks around main-sequence stars are signposts for the existence of planetesimals and exoplanets. From cross-correlating Hipparcos stars with the IRAS catalogs, we identify 146 stars within 120 pc of Earth that show excess emission at 60 . This search took special precautions to avoid false positives. Our sample is reasonably well distributed from late B to early K-type stars, but it contains very few later type stars. Even though IRAS flew more than 20 years ago and many astronomers have cross-correlated its catalogs with stellar catalogs, we were still able to newly identify debris disks at as many as 33 main-sequence stars; of these, 32 are within 100 pc of Earth. The power of an all-sky survey satellite like IRAS is evident when comparing our 33 new debris disks with the total of only 22 dusty debris disk stars detected first with the more sensitive, but pointed, satellite ISO . Our investigation focuses on the mass, dimensions, and evolution of dusty debris disks.
1 Introduction
Dusty debris disks that surround nearby main-sequence stars were first detected by the Infrared Astronomical Satellite (IRAS ) in 1983. These circumstellar disks were inferred from an infrared excess flux between 25 and 100 many times brighter than expected from the stellar photosphere. The IR excess was modeled by disk distributions that would absorb optical and ultraviolet flux from the host star and then isotropically radiate this energy at infrared wavelengths. The first dusty debris disk was discovered around the bright main-sequence star Vega (Aumann et al., 1984); consequently a dusty disk around a main-sequence star is commonly referred to as the Vega phenomenon.
Numerous studies of T Tauri stars dating back many years indicate the characteristic timescale for the dispersal of a surrounding dusty, gaseous disk is a few million years. Following dissipation of the gaseous component, the remaining dust can further dissipate during the following few million years via coagulation into large objects, Poynting-Robertson and stellar wind drag, radiation pressure, and collisional destruction (e.g., Backman & Paresce 1993; Lagrange et al. 2000; Dominik & Decin 2003; Plavchan et al. 2005). Vega-like stars are, however, generally much older than 10 Myr, thus the observed dust should be of secondary origin, most likely replenished via collision and fragmentation of planetesimals. Furthermore, the Vega-phenomenon overlaps with the important planetary system formation epochs in our solar system: giant gas planet formation within 10 Myr, terrestrial planet formation within 30 Myr, and the era of heavy bombardment in the inner solar system within 600 Myr. Therefore, studies of IR-excess stars can provide crucial information on extrasolar planetary formation and evolution.
During the past two decades, about two dozen papers have been published that describe IRAS , Infrared Space Observatory (ISO ), and Spitzer Space Telescope searches for stars with excess IR emission ( 3; Lagrange et al. 2000; Zuckerman 2001; Decin et al. 2003). These searches employed different techniques for cross-correlating IR and stellar sources with no consistent definition of an IR excess. To date, several hundred main-sequence IR-excess stars have been reported in the literature including those that have an IR excess at 25 .
A major goal of debris disk research has been to characterize the temporal evolution of the quantity of dust present in the disks. Notwithstanding almost two decades of debris disk research using data from three IR satellites, a convincing assessment of this temporal evolution remains incomplete. Such an assessment requires a large sample of stars and a reliable estimate of the dust mass and the age for each debris disk system. False positive IR-excess stars due to the large beam size of IRAS and improper search or calibration techniques have contaminated some previous studies. Such contamination of the debris disk population has not only plagued many follow-up observations from ground and/or space observatories but also precludes a global assessment of the distribution and evolution of the dust population.
If the IR excess is from a bona fide dust disk, then the best estimator of dust mass comes from submillimeter flux. Unfortunately, submillimeter flux measurements are difficult, time-intensive observations. A more readily accessible observable is , the ratio of excess infrared luminosity due to dust divided by the total energy output from a star. We compute values of for each of the IR-excess stars presented in this paper. In 5.1 we discuss the relationship between submillimeter flux and for those Vega-like stars for which both are known, and we derive our own relationship, which is used to predict a dust mass if both and the dust disk radius are known.
Furthermore, estimation of stellar age is often troublesome since most nearby IR-excess stars are isolated field stars. In order to obviate the shortcoming of stellar age estimation, several groups are using Spitzer to search for IR-excess stars in nearby young stellar groups with well-determined ages (e.g., Stauffer et al. 2005). However, because the distance to all rich clusters is substantial (except for the Hyades), it remains difficult to obtain statistically significant results even with Spitzer (Stauffer et al., 2005). Thus, the large, clean sample of relatively nearby field stars we discuss in the present paper can contribute in a statistically meaningful way to our understanding of the Vega phenomenon and its evolution with time.
2 Search Criteria and Selection Technique
Zuckerman & Song (2004a, hereafter Paper I), relying primarily on data in Silverstone’s (2000) thesis, analyzed 58 strong IR-excess stars following careful checks against possible contamination from various sources. Zuckerman & Song argued that the Vega-like stars are signposts for the existence of planets and focused their efforts on identifying stars that would make the best targets for adaptive optics and precision radial velocity searches. The present paper extends the sample analyzed in Paper I in a couple of ways. First, we significantly increase the sample size so that it is now possible to address circumstellar dusty disk evolution in a statistically meaningful way. This increase is achieved by systematically cross-correlating all Hipparcos main-sequence stars with 60 IRAS sources in the Faint Source (FSC) and Point Source (PSC) catalogs. Our distance limit is 120 pc compared with the 100 pc adopted in Paper I. Second, the spectral energy distribution (SED) fitting routine was enhanced with the employment of filter response functions and a fully automated fit with a minimization method.
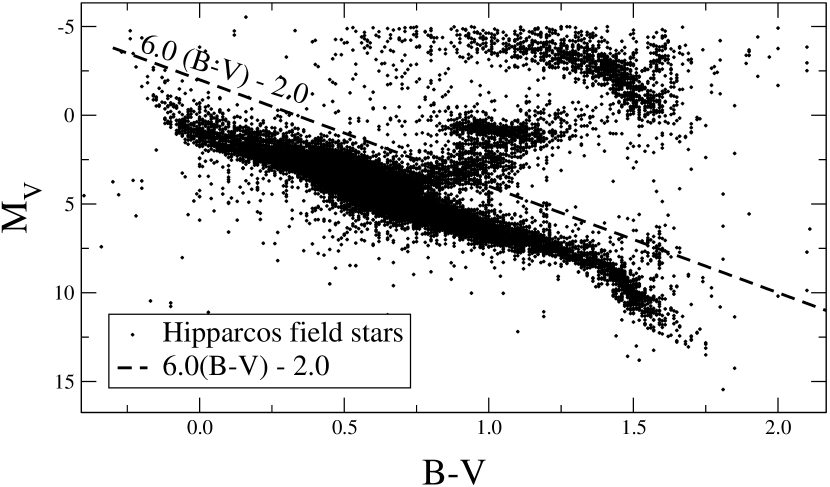
Hipparcos and IRAS data were cross-correlated to search for IR-excess stars. Many sources in the FSC and PSC with optical stellar identifications are, however, giant stars (Odenwald, 1986; Zuckerman et al., 1995a). A constraint on the absolute visual magnitude 6.0(B V) - 2.0 (Fig. 1) was applied to the entire 118,218 stars of the Hipparcos catalog to remove giant stars from our sample. This cut eliminated 50,164 stars, leaving 68,054 Hipparcos stars for further investigation.
These pre-screened Hipparcos dwarfs were then cross-correlated against IRAS sources. The IRAS FSC was used to cross-correlate the 53,157 stars located out of the Galactic plane ( ), while the PSC was used for the 14,897 stars in the Galactic plane and to recover any object missed by the FSC out of the Galactic plane. All FSC sources with a detection at 60 (i.e. a 60 flux quality of 2 or 3) and a Hipparcos dwarf within 45 were selected for further investigation. A search radius of 45 was adopted to reflect the average FSC 3 positional error. For PSC sources in the Galactic plane, Hipparcos dwarfs within only a 10 search radius were retained, in order to avoid contamination of spurious sources in the crowded fields of the Galactic plane. There were 557 stars (481 from the FSC and 76 from the PSC) that passed the initial cross-correlation. Unfortunately, the FSC is only 80% complete. We therefore cross-correlated all main-sequence Hipparcos stars outside the Galactic plane with the PSC using a search radius of 45. We found an additional 65 stars in the PSC that had 60 detections, but were unidentified in the FSC. Most of these stars from the PSC were detected at 12 (but not 60 ) in the FSC. In contrast, Silverstone (2000) cross-correlated Hipparcos and IRAS FSC sources only. Our correlation with the IRAS FSC and PSC left a collection of 622 main-sequence stars identified in the Hipparcos catalog that had 60 counterparts detected by IRAS .
In young and massive main-sequence stars, significant IR flux arises from free-free emission. Such stars, namely spectral types O1-B5, were excluded from our sample by rejection of objects with -0.15. Then a distance cut of 120 pc was applied to our sample to avoid contaminations arising from star-forming regions and interstellar cirrus as described, for example, in Kalas et al. (2002) (see below).
A visual inspection of the remaining excess candidates for the presence of a background galaxy was conducted by correlating the FSC and PSC catalogs with NASA’s Extragalactic Database (NED) in Digital Sky Survey (DSS) images. Any star with a noticeable galaxy within the 3 IRAS positional error ellipse was removed from our sample, and any star with a bright star within the 3 error ellipse was flagged for further checking of its SED. Since NED is not complete, we also carefully checked any DSS optical extended sources (mainly galaxies) that were not included in NED. Using the long format of the FSC catalog, Silverstone (2000) compared the 60 position to the stellar position and excluded stars whose 60 offsets are 30″. Instead of imposing such a strict constraint on our sample, we exclude stars only if their 60 offsets are greater than the 3 IRAS positional error. For all FSC sources, we carefully checked their 60 positions against any galaxy or bright nearby star.
For stars with apparent detections in the IRAS 100 band, we tested for possible contamination from interstellar cirrus. Some relatively distant, previously known, IR-excess candidates are contaminated by interstellar cirrus (Kalas et al., 2002). We checked the IRAS cirrus flag of all 100 sources and rejected those with cirrus flag 3 except HIP 77542. HIP 77542 had significant excess at all wavelengths and was fit nicely with a single blackbody temperature (Paper I).
A fully automated SED fitting technique using a theoretical atmospheric model (Hauschildt, et al., 1999) was used to predict stellar photospheric fluxes. This fit technique is unlike previous excess searches that use the “empirical” color of main sequence stars to estimate stellar photospheric fluxes. For each star, fluxes at , , , , and were employed to fit the model spectra of a stellar photosphere. The standard Johnson and magnitudes were obtained by converting Tycho and magnitudes using Table 2 in Bessell (2000). For the 10 Hipparcos objects that did not have observed Tycho and magnitudes, and values were obtained from SIMBAD. Observed , , and magnitudes came from the 2MASS catalog. When any star was brighter than 5th magnitude at , , or in 2MASS, we set its uncertainty to 0.400 mag. The zero magnitudes in Cox (2000) were used to convert the observed magnitudes into a flux density (janskys). The current Hauschildt et al. stellar photosphere model (T. Barman 2004, private communication) is available for effective temperatures from 1700 to 10,000 K (in 100 K increments from 1700 to 3000 K and in 200 K increments from 3000 to 10,000 K). The stellar radius and effective temperature were used as free parameters to fit the observed fluxes with a minimization method.
We created model fluxes at each band by convolving each filter function with the model spectra. This method provides a more accurate representation of the observed flux especially where the passband includes significant spectral features such as the Balmer jump. Comparing the best-fit model spectra with the observed fluxes, we found that the model spectra always overestimated the - and -band fluxes. This perhaps arises from some missing opacity sources in the - and -bands of the model spectra. For consistency, we manually set the uncertainties of and -band magnitudes to 0.25 if the given uncertainty value is smaller than 0.25 mag to ensure a better fit.
Once the stellar photosphere was modeled, a dust component was fit with a blackbody curve. IRAS upper limits were not included in the dust fitting, but we mandated that the upper limits are always above the estimated total (star and dust) flux. Temperature dependent IRAS color corrections should be carefully considered. Both the stellar photosphere and dust emission contribute to the observed IRAS flux as follows;
| (1) |
where the subscript “unc” stands for “uncorrected.” Thus, accurate estimation of a color correction value requires not only the flux of the stellar photosphere but also that of the dust, which is obtained through the blackbody fitting. But the problem is that both dust flux and the color correction are a function of dust temperature, which requires an iterative process to determine the dust temperature in color-corrected IRAS dust flux. Instead we obtained the dust temperature by fitting the uncorrected IRAS fluxes. First, we “colored” the stellar photosphere (eq. [2]) by multiplying the appropriate color correction terms () before subtracting the stellar photosphere (eq. [3]):
| (2) |
| (3) |
, where the subscript stands for “model.” Then we fit the remaining IRAS fluxes with the “colored” blackbody curve (eq. [4]),
| (4) |
By combining equations (3) and (4) and using the stellar photosphere model described above, we obtained the best-fit temperatures of the stellar and dust emission. Then the correct total IRAS color correction terms were calculated by estimating the fractional color terms using a weighted average of photosphere and dust fluxes at each wavelength (eq. [5]):
| (5) |
where C1 and C2 are the fractional contributions of the stellar photosphere and dust to the total measured flux,
| (6) |
In displaying the IRAS observed magnitudes, we applied the prorated color correction terms to the IRAS measurements (eq. [6]). As in photosphere fitting, we created synthetic fluxes at each IRAS band by convolving IRAS filter functions with the blackbody curve.
SED fits were performed for all identified IRAS and Hipparcos stars, yielding very precise estimation of stellar photospheric fluxes (Fig. Set 2). When available, additional fluxes from ISO 111ISO measurements were taken from Silverstone (2000) and Habing et al. (2001). and/or Spitzer222These Spitzer MIPS measurements were taken from the references given in 3. measurements were used to better fit dust components. Four objects were dropped from our list due to possible cirrus contamination or no 60 excess based on ISO measurements reported in Silverstone (2000) except HIP 111278. For some objects, Spitzer Multiband Imaging Photometer for Spitzer (MIPS) data are available in the public archive but were not yet published. In such cases, we extracted photometry from MIPS pipeline data at 24 and 70 . No photometry was attempted on MIPS 160 pipeline data because of heavy contamination from a known “blue leak.”
Several Class I and II pre-main-sequence (PMS) stars were found from our SED fits, in which a typical SED of a Class I/II PMS star shows large and fluxes above the model spectrum and strong but flat excess in the IR. Because we are searching for IR excess among main-sequence stars, Class I and II PMS stars were subsequently eliminated from our sample. For completeness, the IRAS -identified Hipparcos class I & II PMS stars within 120 pc are listed in Table 1.
Many sources that passed the visual check, especially nearby stars, showed no IR excess in their SED. Color corrected IRAS fluxes were compared to the estimated photospheric fluxes. Stars with no IR excess ([FIRAS - Fphot] / 2.5) were eliminated except HIP 71284, where is the IRAS 60 flux density uncertainty. IR excess at HIP 71284 was confirmed by an ISO observation (Paper I). One hundred forty-six stars had IR excess ([FIRAS - Fphot] / 3.0), and nine stars showed marginal IR excess (2.5 [FIRAS - Fphot]/ 3.0). These marginal IR excess stars fall into a statistical domain in which 0.5% of non-excess stars may produce a false excess assuming Gaussian noise under pure statistical detection errors. Recent Spitzer observations show that three stars (HIP 65109, HIP 105090, & HIP 105858) that had marginal IR excess from IRAS are not IR-excess stars. In addition, even some stars with [FIRAS - Fphot] / 3.0 turn out to be false positives. For example, HIP 83137, passing all the tests above, had [FIRAS - Fphot] / = 4.3 and was considered one of the better new IR-excess candidates. However, recent Spitzer MIPS observations found no excess emission at 70 at HIP 83137 along with six other similar stars (HIP 8102, HIP 42913, HIP 49641, HIP 75118, HIP 98025, & HIP 104206).
All six bogus excess stars had IRAS excess emission detected at 60 only. To date, Spitzer has looked at a total of 26 such stars in our sample producing a false excess rate of 27% (7/26). Applying this rate to the remaining 54 stars with infrared excess emission detected at IRAS 60 alone, we anticipate that about 15 objects or 10% (15/146333146 = 146 + 9 (with marginal IR excess) + HIP 71284 - 10 bogus stars.) of our sample may turn out as non-excess stars.
Generally, a bogus excess can be produced in two quite different ways. One way is where a real, background, far-IR source is present in the beam when IRAS pointed toward a Hipparcos star. The other is where a 3 noise bump happens to fall near a Hipparcos star. Apparent excess sources rejected for both classes of reasons are listed in Table A4. The number of real background sources (mostly galaxies) anticipated in our sample can be estimated in a way analogous to that described in Section 2 of Zuckerman et al. (1995a); such an estimate agrees reasonably with the number of background galaxies listed in Table A4.
If the background noise has a normal distribution, then we anticipate that about one star in 500 could be contaminated by a 3.1 noise fluctuation. After our distance and color cuts described above, we were left with 25,800 Hipparcos dwarfs. Thus, of these, 50 might be contaminated by a noise fluctuation. Some constraint is supplied by examination of IRAS SCANPI traces which sometimes show the 60 peak position to be displaced from the stellar position. Background noise could be responsible, in total, for 20 Hipparcos stars listed in Table A4.
Nearby M-type stars are now known not to be strong IR-excess sources (e.g. Plavchan et al. 2005; Riaz et al. 2006), indeed the only one listed in Table 2 is AU Mic which is a very young star. There are 900 M-type dwarf stars in the Hipparcos catalog and the only one other than AU Mic that appeared in our cross correlation with IRAS was AX Mic, in which, however, a Spitzer MIPS observation showed that there is no 70 excess. According to the above estimates, we might have expected two bogus IRAS associations in these 900 stars, in reasonable agreement with the one, AX Mic that was actually found.
We finally present 146 IRAS identified Hipparcos IR-excess dwarfs in this paper. Among them 33 stars are newly identified as IR-excess stars from our survey, and only two objects out of these 33 newly identified IR-excess stars have marginal IR-excess (2.5 [FIRAS - Fphot] / 3.0).
3 Overview of previous IRAS , ISO , and Spitzer surveys for dusty debris disks
Comparison of IRAS with ISO and Spitzer demonstrates the power of all-sky surveys. Notwithstanding that IRAS flew more than 20 years ago, through careful analysis of its database, we have been able to discover perhaps as many as 33 main-sequence Hipparcos stars with previously unrecognized dusty debris disks detected at 60 wavelength. In comparison, only 22 new 60 excess stars were discovered in all ISO programs while 20 new 70 excess stars were announced in the 2004 and 2005 Spitzer-based literature (see below for references). Although ISO and Spitzer have higher sensitivities than IRAS , they are both pointed satellites with a much smaller sky coverage.
IRAS surveys and, significantly, some of their limitations are summarized in 1 of the present paper and in 3 of Zuckerman (2001). Previous to the present study, Silverstone (2000) represented the most comprehensive search of the IRAS catalogs for Vega-like 60 excess stars. However, Silverstone’s primary goal was to use ISO to detect dust at F- and G-type stars inconclusively detected by IRAS at 60 . He did not analyze his IRAS findings, and his search never reached publication. Thus, no IRAS survey published prior to 2005 is germane to issues addressed in the present paper.
ISO was a pointed satellite of modest sensitivity, and surveys by various groups added relatively few new Vega-like stars. Decin et al. (2003) give a comprehensive account of these surveys, a major goal of which was characterization of the time dependence of the Vega phenomenon. One limitation of these studies, as noted by Decin et al., is the quite uncertain ages of many of the excess stars. Indeed, we disagree with some of the ages in Table 1 of Decin et al. They describe some limitations to the results presented by Spangler et al. (2001), limitations due, in part, to the poorer than expected sensitivity of ISO .
A next advance was by Manoj & Bhatt (2005), who focused on deducing the lifetimes and temporal evolution of the dust around the Vega-like stars. In an innovative analysis, they considered the relative sky-plane velocity dispersions of the Vega-like stars and of Hipparcos stars in general to demonstrate that, at any given spectral type, the Vega-like stars are, on average, younger than the general population of field stars. They also showed that the average of the Vega-like stars declines with increasing velocity dispersion, that is, with increasing age. Because their analysis technique is very different from our’s and because their sample of excess stars is not called out explicitly in their paper, it is not possible to make a direct comparison between their results and ours. However, wherever their conclusions and ours do overlap, they appear to be consistent.
Most recently, Moór et al. (2006) compiled a list of 60 debris disks with high fractional dust luminosity, , and within 120 pc of Earth by searching the IRAS and ISO database. Forty-eight objects in Moor et al. are included in our survey, while 12 objects are absent. Among those 12 objects missing, four are not Hipparcos stars, and six of eight Hipparcos stars did not have a detection at 60 with IRAS and, therefore, did not satisfy our search criteria ( 2). The remaining two, HD 121812 (HIP 68160) and HD 122106 (HIP 68380), are rejected in the present paper due to possible cirrus contamination and the presence of a nearby galaxy, respectively (see Table A4 for the list of rejected sources). We included five objects (HIP 13005, HIP 25790, HIP 69682, HIP 77163, and HIP 83480) from the Moor et al. list of rejected suspicious objects; our reasoning is discussed in the notes for these individual objects in Table 2.
Five papers that appeared in 2004 or 2005 report Spitzer detections at 70 for a total of 20 Vega-like stars that had not previously been detected at 60 by IRAS and/or ISO (Meyer et al., 2004; Chen et al., 2005; Beichman et al., 2005; Low et al., 2005; Kim et al., 2005). Although it is not possible to tell exactly how many stars Spitzer pointed toward (searched) at 70 in these studies, it appears to be of order a few hundred. Thus, only about 10% of stars reveal far-IR dust emission at levels between IRAS and Spitzer sensitivities.
4 Sample Characteristics
Our IR-excess sample consists of 146 Hipparcos dwarfs within 120 pc of Earth. Figure 3 illustrates the distance and distribution of the sample. The relative paucity of debris disks from late-type stars has been previously well established and attributed to the IRAS detection threshold (Song et al., 2002b). However, grain removal by stellar wind drag at M-type stars could also be implicated (Plavchan et al., 2005).
Our stars are listed in Table 2 including 51 out of 58 stars from Paper I. The remaining seven objects had ISO detections but lacked an IRAS 60 detection, an absolute requirement in the present paper. The Hipparcos and the HD numbers are listed in columns (1) and (2), respectively. Spectral type, magnitude, and distance from Earth from the Hipparcos main catalog are given in columns (3), (4) and (5), respectively. The stellar radius and temperature, (col. [6]) and (col. [7]) are obtained from the SED fit. As described in 2, the fitting process was improved from the version used in Paper I and for some objects the best fit and deviate slightly from Paper I. For example, HIP 42430 was fit with of 1.83 and of 5600 K in Paper I, but the improved fit gives of 1.73 and of 5800 K in Table 2. Our estimations of are in good agreement with direct measurements such as those with the Very Large Telescope (VLT) interferometer as illustrated in Paper I. The accuracy of our stellar radius measurements is discussed in more detail in a separate paper (S. Kim et al. 2007, in preparation).
A single-temperature blackbody fit to the dust component yields (col. [8]) for each star, assuming blackbody radiation from dust grains in an optically thin disk. In the case of an IRAS detection at 60 , but with only upper limits at 25 and 100 , we set at 85 K so that the combined flux of the star and dust peaks near 60 . This approach leads to a conservative estimate of (col. [11], (= ). Additional measurements from Spitzer and/or ISO were used to better constrain dust temperature for stars in which such values are available in the literature or from our calculations. (see 2).
The characteristic orbital semimajor axis of dust particles, , is derived from = (/2)(/ and listed in column (9) in AU. The corresponding angular separation (arcseconds) between dust particles and the star is indicated in column (10). The conservative nature of and the angular separation – in the sense that the actual value of at a given star may be substantially larger than the value given in column (9) – is discussed in detail in Paper I. Using a simple model of a thin dust ring (see 5.1), dust mass (col. [12]) was estimated for 61 stars whose dust excess was detected at two or more wavelengths and whose dust radii lie between 9 and 100 AU. Table 2 lists dust mass for a total of 78 stars including 17 stars for which dust mass was obtained directly from submillimeter measurements.
Estimation of the age of a star that belongs to a known kinematic stellar group (Zuckerman & Song, 2004b) is relatively straightforward. For stars not presently known to be a member of such a group, age estimation is quite difficult and requires cross-checking of several different techniques (Decin et al. 2003; Zuckerman & Song 2004b and references therein). The age estimate and age estimation methods for each star are given in columns (13) and (14), respectively. We follow the same lettering convention for each method as indicated in Paper I. A comprehensive review of different techniques of age estimation is found in Zuckerman & Song (2004b).
When available, confirmation of dust excess from MIPS and/or ISO measurements are indicated in column (15) and additional notes for individual objects are marked in column (16). For completeness, we repeat the notes of Table 1 from Paper I in this paper. Finally, a list of rejected sources and the reason for rejection from our survey are presented separately in Table 4.
5 Dust Evolution over Time
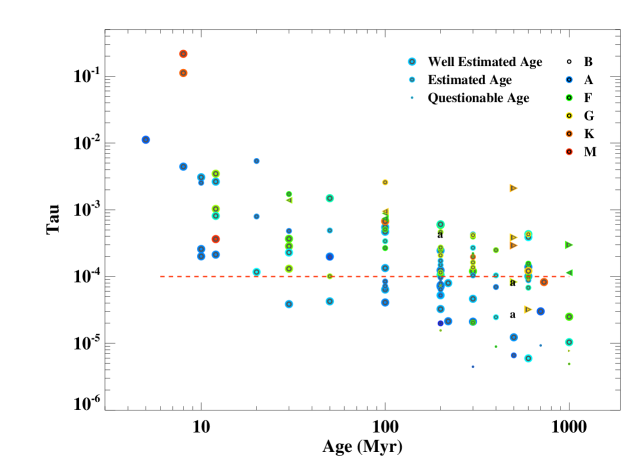
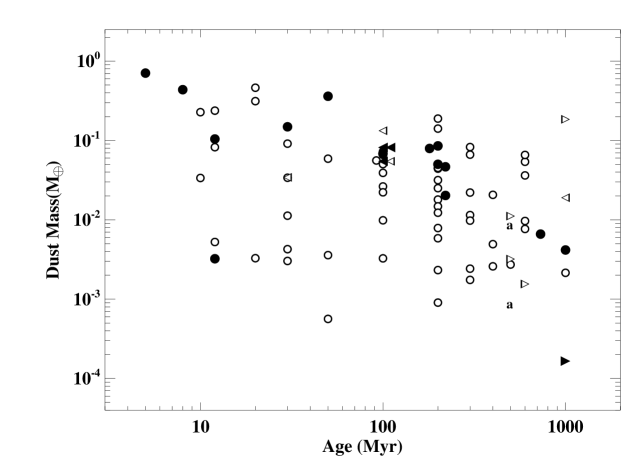
Figure 4 illustrates the temporal evolution of . The spectral type of each star is represented by the color of each circle, from dark blue for B-type to red for M-type. Circle size reflects the quality of our estimate of age; large, medium, and small circles depict good-, normal-, and low-quality age estimates, respectively, as given in column (13) of Table 2. The following list summarizes some characteristics indicated by the distribution of stars in Figure 4.
-
1.
For stars with ages between 10 Myr and 1 Gyr, the mean of stars with detectable excess emission declines in proportion to (age)0.7, but with a dispersion in detected of a factor 30 at a given age.
-
2.
The percentage of nearby stars with 60 excess emission detectable by IRAS diminishes with increasing stellar age.
-
3.
The minimum detected is for early-type (B, A, and F) stars and for later types. This is due to IRAS sensitivity limits and the uncertainty of photospheric flux estimation.
-
4.
At any given age, late-type stars tend to have the largest .
As we mentioned in 3, no pre-2005 analysis of IRAS data is germane to the time evolution of fractional dust excess, . By contrast, three teams (Habing et al., 2001; Spangler et al., 2001; Decin et al., 2003) investigated the temporal evolution of the dust using the ISO database. All three studies suffer to some degree from small numbers of detected ISO sources or uncertain/incorrect stellar ages or both. Decin et al. (2003) noticed that there are few young stars with , which also appears in our Figure 4. This rarity of young low stars may be due to the fact that there are not many young early-type stars in the solar vicinity (say 50 pc).
We can roughly quantify item (2) by dividing the IRAS stars into three age bins, (a) 10-50 Myr, (a) 50-500 Myr, and (c) 500-5000 Myr. We assume that, in a given volume of space near Earth, stars are uniformly distributed in age for ages up to 1 Gyr. For older stars one first loses all main-sequence A-type stars - these evolve off the main-sequence in 1-2 Gyr–followed by loss of F-type main-sequence stars at ages between 2 and 4 Gyr (Schaller et al., 1992).
From Figure 4, there are 26 stars in bin (a), 74 in bin (b), and 24 in bin (c). By our assumption of equal numbers of stars of any given age in the volume accessible to the sensitivity of IRAS , the age bin (b) contains 10 times more stars in total – with and without a dusty disk – than does bin (a). Since bin (b) in Figure 4 contains about 2.8 times the number of Vega-like stars as does bin (a), the probability that a star will be Vega-like is 3.5 times greater between ages of 10 and 50 Myr than between 50 and 500 Myr.
Similarly, we can estimate the probability that a star in age bin (c) will be Vega-like. We ignore for just a moment the loss of A-and F- type stars in bin (c) as a result of evolution off the main sequence. In that case, because bin (c) contains 10 times more stars in total - with and without a dusty disk – than does bin (b) but fewer Vega-like stars (24 vs. 74), the probability that a star will be Vega-like in age bin (b) would be 30 times greater than in bin (c). However, because there is a sequential loss of A- and F-type main-sequence stars at ages 1 Gyr, and because these spectral types dominate the IRAS detected 60 excess stars, we estimate that if a star has an age appropriate for bin (b), then the probability of its being Vega-like is only 10 times (rather than 30 times) greater than the probability of being Vega-like if its age falls in that of bin (b). Then the probability of any given nearby star in age bin (a) being Vega-like is 35 times greater than this probability is in bin (c).
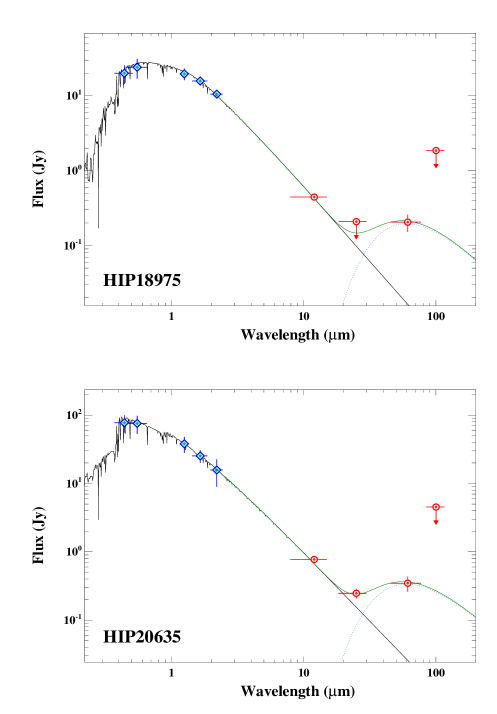
The preceding discussion pertains to how the probability of being Vega-like declines with age. We can estimate the absolute value of this probability in two ways. First, two stars in Table 2 are members of the Hyades (Figure 2: HIP 18975 = VB 160 and HIP 20635 = VB 54) although both have cautionary notes and the 60 excesses cannot be regarded as definite until confirmed with additional data. IRAS could have detected excess 60 emission comparable to = at Hyades stars with V 6, which corresponds to a mid-F- type star. According to Table 1 in Stern et al. (1995), 40 Hyades members have a mag brighter than 6. Thus, at an age of 600 Myr, 5% of A- through mid-F- type stars in the Hyades are Vega-like above the 60 flux level accessible to IRAS .444Spangler et al. (2001) reported a 60 ISO detection of Hyades member HIP 20261, but at a flux level, 50 mJy, below the IRAS detection limit..
Field A-type stars supply a second sample to estimate the probability that a star will show the Vega-phenomenon. We find, in essential agreement with some previous determinations, that IRAS detected 60 excess emission at 20% of A-type stars with out to 28 pc (10 of 50 stars) and with 4 out to 40 pc (22 of 119 stars). The percentage of F-type stars that show the Vega phenomenon at comparable levels of appears to be noticeably smaller, but definitive statistics should wait for results from Spitzer.
Notwithstanding the much larger probability of a star being Vega-like at young ages, there appears to be very little distinction with age in peak seen in Figure 4 and noted in item (1) above. This suggests that the Vega-phenomenon, at least at the higher levels of measured by IRAS , may be mostly the result of occasional large and violent collisional events rather than many small-scale, dust-producing events added together. For example, there was a very substantial and recent collisional event at the G-type main-sequence star BD +20 307, first detected by IRAS at 12 and 25 (Song et al., 2005).
Item (4) noted above might be anticipated in a collisional cascade model (cf., Dominik & Decin 2003). In such a model, collisions grind dust particles down to smaller and smaller sizes until sufficiently small particles are blown out of the system by radiation pressure from the star. Lower luminosity, later type stars will retain more small particles in orbit that in total can possess a large emitting area; thus is increased. The larger expected for late-type stars in a Dominik & Decin (2003) model is illustrated in their Figure 1f. Earlier, Song (2001) had suggested that late-type stars display larger than early-type stars based on the limited data available to him at that time.
5.1 Relationship among , Disk Mass, Radius, and Stellar Age
Perhaps the quantities of most interest are disk dust mass, disk radial extent, and disk evolution with time. The total mass (M) of dust in a disk may be written:
| (7) |
where N is the total number of grains in the disk and and are the density and radius of a typical grain. For an optically thin dusty ring/shell of characteristic radius R,
| (8) |
Then,
| (9) |
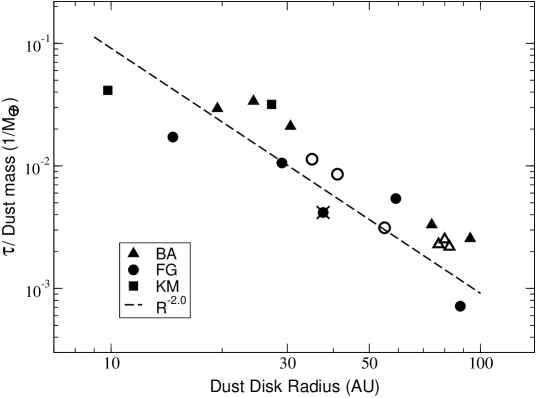
Thus, if characteristic grain size and density do not vary much among various optically thin dust disks, then one expects /M to vary as the inverse square power of the disk radius, R. Figure 5 shows this to be approximately the case for dust disks with semimajor axes between 10 and 100 AU, where we have taken and R from Table 2, and disk mass from the submillimeter literature.
The significance of the filled and open symbols in Figure 5 is as follows. The figure was initially prepared containing only the filled symbols that represent dust mass determinations based on submillimeter data published prior to 2006. The dashed line was deemed a reasonable “fit” to these solid symbols and we used it to derive disk dust masses for many stars in Table 2 as outlined below. Then, while the present paper was being refereed, a paper presenting submillimeter measured masses for six Table 2 stars appeared (HD 14055, 15115, 21997, 127821, 206893, and 218396; Williams & Andrews 2006). These six stars appear in our Figure 5 as open symbols, and because they lie along the dashed line, they clearly indicate the viability of our method.
While recognizing a caveat of statistics of small numbers, relative to the dashed line the early-type stars preferentially lie somewhat above the later type stars . This difference could be attributed to smaller grains around the later-type stars (as discussed in 5). However, this model requires that these grains are sufficiently small that they are unable to radiate like blackbodies at their temperature and thus, at a given distance from the star, are hotter than blackbody grains would be at that same distance.
Rather few stars appear in Figure 5 as a direct consequence of the limited number of published measurements of submillimeter fluxes for Vega-like stars. In addition, we plot only stars for which far-IR excess emission has been measured in at least two wavelengths; for such stars we can estimate and, thus, .
Because is easier to measure (especially with Spitzer ) than is a submillimeter flux, we use Figure 5 to derive initial estimates of dust masses for many stars listed in column (12) of Table 2. Combining IRAS , ISO and Spitzer data, all stars with masses listed in Table 2 and plotted in Figure 6 have measured excess IR emission in at least two wavelengths. As mentioned in 4 above and emphasized in Paper I, the method used to calculate the values of Rdust listed in Table 2 will sometimes substantially underestimate the true Rdust. Thus, the Table 2 dust mass estimates should be regarded with some caution.
The filled symbols in Figure 6 indicate a dust mass measurement at submillimeter wavelengths. We expect that stars plotted with ages 10 Myr still retain significant amounts of orbiting primordial dust left over from the star formation process. Thus, when considering the evolution of disk masses in dust, these stars should not be compared with the older stars whose dust is of a second generation. Figure 5 in Najita & Williams (2005), based solely on submillimeter data, is suggestive of dust mass decreasing with time. However, when stars with ages 10 Myr are omitted, the remaining submillimeter data are consistent with constant average dust mass at stars with ages between 30 and 1000 Myr, as suggested by our simple model from Figure 5, and the resulting open points are plotted in Figure 6.
Najita & Williams (2005) consider in some detail planet formation models of Kenyon & Bromley (2004a,2004b). According to the discussion in Najita & Williams, in these models a wave of planet formation in the disk propagates outward generating, as time progresses, dusty debris at successively larger characteristic radii. According to the models, for times perhaps as long as 1 Gyr, the total mass in small grains sensibly remains constant, while, in contrast, the reprocessed luminosity (i.e., ) emitted by the collisional debris begins to decline at a much earlier time ( 10 Myr). This is because, as the wave of planet formation moves outward, grains of a given size subtend increasingly smaller solid angles the farther they are located from the star. Comparing our results (Fig. 4 and 7) with these models, both a decrease in and an increase in R appears plausible between 10 and 1000 Myr.
Figure 8 is a plot of versus disk radius. The six stars with 10-3 all have estimated ages of 20 Myr. Thus, much of their dust may be a remnant of the star formation process, rather than second generational. For the other stars, no correlation is apparent between and R. Although a grain of a given radius located close to a star will absorb more stellar radiation than one far away, the lifetime of close-in grains might be shorter than for distant grains, and these two effects may roughly cancel, on average.
5.2 Algol-type binary stars with far-IR excess emission
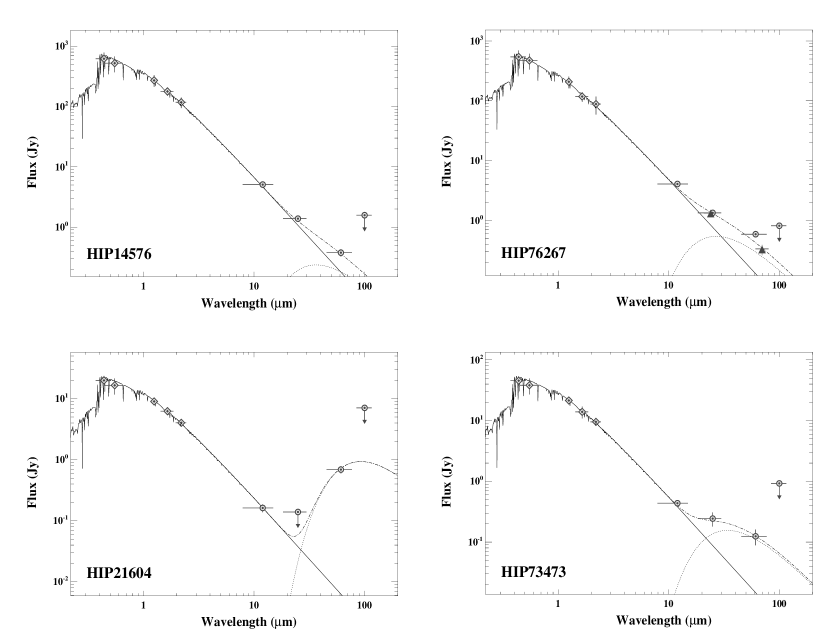
An Algol is a binary in which the less massive stellar component fills its Roche lobe and the other, which does not, is not degenerate (Batten, 1989). Four stars in Table 2 are eclipsing binaries of the Algol type, including Algol A itself. HIP 76267 was long ago recognized as a 60 IRAS excess star (Aumann, 1985). The Rieke et al. (2005) Spitzer survey at 24 included three Algols. For HIP 76267, they report a just-significant, 29%, excess according to their criteria (the Spitzer measured flux must be 1.25 times the expected photosphere to be regarded as significant). Rieke et al. also report a 7% excess at 24 for Algol A, although this does not meet their significance threshold of 25%. For HD 40183 their measured 24 flux was only 0.88 times the expected photosphere. Although the IRAS FSC reports detection of HD 40183 at 12, 25, and 60 , we see no evidence of an excess at any wavelength.
The far-IR excess emission at the four Algols might be generated by free-free and bound-free transitions in ionized gas or by cool dust or both. The Algol-type binary stars are susceptible to emission in ionized gas because a small H II region is created around the primary star by material transferred from the secondary star. We first consider far-IR emission in an ionized gas disk orbiting a late B-type primary in Algols listed in Table 3. We assume an electron density ne = cm-3 and disk radius r = cm (Peters, 1989; Guinan, 1989). Code et al. (1976) give the flux between 0 and 1100 Å received at Earth for the B7 star Leo. This translates to photons s-1 emitted by Leo and capable of ionizing hydrogen. The excitation parameter (E), i.e. the number of photons per second required to maintain an H II region, is
| (10) |
(Osterbrock, 1974). With = 2 1013 cm3 s-1 at 10,000 K, and E = 2 ionizing photons s-1, an H II region with ne = cm-3 and r = cm can be supported.
Considering the four Algols with SEDs displayed in Figure 9, we assume a characteristic distance of 30 pc and a characteristic excess flux at 60 equal to 0.4 Jy. The orbiting ionized disk described in the preceding paragraph would have a 60 optical depth 0.2 (Osterbrock, 1974) and could account for this excess flux. Thus, it is plausible that ionized gas, rather than dust, could generate the excess far-IR emission in some or even all Algols.
Cool dust might also be present in some of these systems. The fact that Algol itself and HIP 73473 are both triple systems (Worek, 2001) may supply a clue as to why cool dust is present at all. In addition to the characteristic mass transfer between primary and secondary, analysis indicates mass is also lost from Algol systems (Batten, 1989). If a tertiary component is present, then the system could be analogous in essential respects to binary post-asymptotic giant branch (post-AGB) stars, many of which are known to be orbited by a dusty circumbinary disk (e.g., Waters et al. 1991). That is, the central object (a single star in the case of the post-AGB stars and a binary in the case of Algols), ejects mass, some of which is captured into a dusty surrounding disk by the gravity of an orbiting companion.
While such a model might apply to Algol A and to HIP 73473, it need not necessarily apply to other Algols with far-IR excess emission. One obvious test would be a search for evidence of a third star in the HIP 21604 and HIP 76267 systems.
6 Summary and Conclusions
The 1983 all-sky IRAS far-IR survey yielded a wealth of information about the properties of cool dust in orbit around main sequence stars. However, notwithstanding decades of ground- and space-based follow-up projects including ISO , as of 2004 when we began the research reported here, in our opinion, a consistent, convincing evolutionary picture of these dusty stars had not been published. In particular, while various researchers had cross-correlated various stellar catalogs against the IRAS catalog, none had used the Hipparcos catalog. Stellar distances and proper motions provided by the Hipparcos and Tycho catalogs yield information useful for establishing ages of dusty stars; reliable ages are essential if correct evolutionary sequences are to be deduced. Also, as a consequence of the rather large IRAS beam-size and inadequate attention to elimination of background confusion, some previous stellar studies with IRAS have suffered from the inclusion of false positive far-IR-excess stars.
In the research reported here we have taken special effort to deduce stellar ages and to eliminate false positives. Just as it is possible to deduce many properties of stellar clusters and associations even though some stars are mistakenly included as members, we trust that our Table 2 IRAS sample is clean enough that our conclusions will stand the test of time. Nonetheless, because ages of nearby field stars are notoriously difficult to estimate accurately and because of limitations with the IRAS database, we recognize that some entries in the tables and figures presented in this paper will be in error.
IRAS was most effective for the study of luminous B- and A-type main-sequence stars. In agreement with some earlier studies, we find that IRAS detected excess emission at 60 from about 20% of nearby A-type stars. This percentage will certainly rise as the A stars are examined with far-IR photometers more sensitive than those aboard IRAS . In particular, we find that about 10% of stars of various spectral classes are revealed to display far-IR dust emission at brightness levels between IRAS and Spitzer sensitivities. Although this 10% subsumes stellar age, spectral types, and distance from Earth and thus is potentially subject to selection effects, it is consistent with the well-defined TW Hydra association sample of Low et al. (2005). Using heterogeneous samples, Smith et al. (2006) and Bryden et al. (2006) also reported about 10% of stars show dust excess in the MIPS 70 band, but below IRAS sensitivity.
From their analysis of ISO data sets, especially the volume-limited sample of Habing et al. (2001), Decin et al. (2003) deduced that the percentage of stars with detectable 60 emission diminishes with age. However, the small data set of Habing et al. (2001) and difficulties with estimating stellar age, precluded a meaningful quantitative result in our opinion. With our larger and more robust database we can derive that the probability of 60 excess emission detectable with the sensitivity of IRAS is about 35 times larger for stars with ages in the range 10-50 Myr compared to such stars with ages 500 Myr within the volume within 120 pc of Earth.
While it is generally agreed that measurements at submillimeter wavelengths are best for the derivation of dust masses, by means of a simple model that relates submillimeter and far-IR fluxes, we are able to derive dust masses for numerous stars that lack submillimeter data. These masses lie in the range between 0.0005 and 0.5 M⊕. For stars with ages between 30 and 1000 Myr, these dust masses appear to depend little, if at all, on age. Based on Figure 5, and as described in 5.1, our model indicates that far-IR data can be used, quite reliably, to predict a submillimeter flux and, thus, a disk dust mass. As a consequence, disk dust masses can generally be derived based solely on Spitzer data provided that excess flux is measured at two or more well-separated wavelengths with MIPS and/or the Infrared Spectrograph (IRS).
Four Algol binary stars appear to display excess emission at 60 wavelength, although the existence of the excess is perhaps not compelling in all cases. We considered models in which the emission is generated by free-free and bound-free emission in orbiting ionized gas or by orbiting dust particles, dust perhaps associated with a tertiary (third) stellar component. Future studies will be required to clarify the dominant physical mechanism(s) involved.
Additional results of our study include: (1) Peak () does not vary much at all ages later than 10 Myr; this might be because occasional catastrophic dust-generating events can occur at any age. (2) The spread of measured at ages 10 Myr is about a factor of 10, increasing to about 100 at later ages; given the measured peak (item 1) and IRAS threshold (), the measured spread of cannot be greater than 100. (3) At any given age late-type stars tend to have the largest . (4) For stars with ages between 10 and 1000 Myr, the mean of stars with IRAS detectable far-IR excess emission declines in proportion to (age)0.7. (5) For early-type stars between ages of 10 and 100 Myr, the typical radius of a dusty debris disk appears to be smaller than for stars with ages between 100 Myr and 1 Gyr. (6) The very largest taus ( ) are associated only with disks that have relatively small radii. (7) IRAS detected excess 60 emission from 20 % of nearby A-type stars. (8) Four Algol-type eclipsing binaries, including Algol A itself, display 60 emission, generated by free-free and bound-free transitions in ionized gas, by dust grains, or by both. (9) Gl 803 (AU Mic, 12 Myr old) is the only M-type, non-T Tauri, Hipparcos dwarf star to display 60 excess emission in the IRAS Catalogs.
Appendix A Appendix material
| IRAS | Contamination | Additional | Reason of | ||
|---|---|---|---|---|---|
| HIP | HD | Source | Source | Data Source | Rejection††
1. There exists a nearby extended source within 3 IRAS positional error ellipse.
2. SED shows that IRAS 60 or MIPS 70 detection falls on the stellar photosphere. 3. No source was detected at the expected stellar position in MIPS 70 image. 4. There exists a 2nd bright star within 3 IRAS positional error ellipse. 5. IRAS 60 excess is likely caused by cirrus contamination. 6. This star, a member of the Pleiades cluster, is likely contaminated by cirrus (Kalas et al., 2002). 7. IRAS SCANPI shows 1′ offset in inscan direction where the listed galaxy is located. 8. 3 IRAS positional error ellipse does not include the target star. 9. Moór et al. (2006) rejected this star based on their Spitzer MIPS observation. 10. Infrared excess had 2.5 detection at IRAS 60 band (see 2 for the definition of ). 11. IRAS FSC long format indicates a large offset between 60 and 12 positions. 12. IRAS SCANPI shows 30 offset in inscan direction where the listed galaxy is located. 13. Spitzer MIPS 70 image shows extended emission. 14. There exists a huge background galaxy behind this star. |
| 1468 | 1407 | F00157+1907 | UGC 00169 | NED | 1 |
| 2021 | 2151 | F00235-7731 | 2 | ||
| 8102‡‡Both IRAS & ISO reported excess emission at 60 , and Greaves et al. (2004) reported excess emission at 850 . However, Spitzer MIPS observation shows stellar photosphere detection at 70 . | 10700 | F01416-1611 | MIPS | 3 | |
| 8796 | 11443 | F01502+2919 | 2 | ||
| 8817 | … | F01506+2312 | 2MASX J01532347+2327067 | NED | 1 |
| 9236 | 12311 | F01572-6148 | 2 | ||
| 12843 | 17206 | F02427-1846 | MIPS | 3 | |
| 13847 | 18622 | F02563-4030 | 2 | ||
| 14897 | 20010 | F03095+1351 | 2 | ||
| 15197 | 20320 | F03134-0900 | 2 | ||
| 16276 | 20110 | F03190+8352 | HIP 16267 | 4 | |
| 17378 | 23249 | F03408-0955 | 2 | ||
| 17439 | 23484 | F03423-3826 | ISO | 5 | |
| 17531 | 23338 | 03421+2418 | 5,6 | ||
| 17573 | 23408 | F03428+2412 | NGC 1432 | NED | 1 |
| 17579 | 23432 | 03429+2423 | 5,6 | ||
| 17608 | 23480 | F03433+2347 | 5,6 | ||
| 17921 | 23950 | F03469+2205 | 5,6 | ||
| 21010 | 28447 | F04273+2800 | 2MASX J04302705+2807071 | NED | 7 |
| 22449 | 30652 | F04471+0652 | 2 | ||
| 23818 | 33095 | F05049-1927 | 1 | ||
| 25110 | 33564 | F05142+7911 | IRAS F05142+7911 | MIPS | 1 |
| 25732 | 36150 | 05271-0050 | 5 | ||
| 27100 | 39014 | F05446-6545 | 5 | ||
| 28360 | 40183 | F05558+4456 | 2 | ||
| 30252 | 44958 | F06207-5112 | 8 | ||
| 32277 | … | F06407+4040 | HIP 32275 | 4 | |
| 32349 | 48915 | 06429-1639 | 2 | ||
| 32435 | 53842 | F06539-8355 | MIPS | 9 | |
| 34473 | 55864 | F07091-7024 | 2 | ||
| 35457 | 56099 | F07149+5913 | MIPS | 9 | |
| 35789 | 58853 | F07225-6432 | IRAS F07225-6432 | 1 | |
| 37279 | 61421 | F07366+0520 | MIPS | 2 | |
| 40167 | 68255 | F08093+1747 | 10 | ||
| 42913 | 74956 | 09433-5431 | MIPS | 3 | |
| 43100 | 74738 | F08436+2856 | HIP 43103 | 4 | |
| 44923 | 78702 | F09067-1807 | MIPS | 5 | |
| 44915 | 78752 | F09068-2844 | 5 | ||
| 45238 | 80007 | F09126-6930 | 2 | ||
| 46853 | 82328 | F09294+5154 | 2 | ||
| 46984 | 82821 | F09319+0346 | 2MASX J09343627+0332421 | NED | 1 |
| 49641 | 87887 | F10053-0007 | MIPS | 3 | |
| 49669 | 87901 | F10057+1212 | 2 | ||
| 54835 | 97455 | F11107+5541 | SBS 1110+556 | NED | 1 |
| 57583 | … | F11457-2150 | 11 | ||
| 57757 | 102870 | F11481+0202 | 2 | ||
| 57759 | 102902 | F11482-3252 | Unknown galaxy | NED | 12 |
| 58001 | 103287 | F15512+5358 | 2 | ||
| 58364 | 103913 | 11554+2524 | NED | 1 | |
| 59307 | 105686 | F12074-3425 | GdF J1209598-344142 | NED | 1 |
| 60112 | 107228 | F12171+0549 | NGC 4266 | NED | 1 |
| 60902 | 108653 | F12263+0126 | SDSS J122856.95+010907.4 | NED | 1 |
| 61932 | 110304 | F12387-4841 | 2 | ||
| 61941 | 110379 | F12390-0110 | 2 | ||
| 61947 | … | F12394+4319 | 2MASX J12414864+4302494 | NED | 1 |
| 62956 | 112185 | F12518+5613 | 2 | ||
| 63973 | 113767 | 13036-4924 | NGC 4945A | NED | 1 |
| 65109 | 115892 | F13177-3627 | MIPS | 2 | |
| 65378 | 116656 | F13219+5511 | 2 | ||
| 66249 | 118098 | F13321-0020 | ISO | 2 | |
| 67927 | 121370 | F13522+1838 | 2 | ||
| 68160 | 121812 | F13549+2336 | 6 | ||
| 68380 | 122106 | F13571-0318 | APMUKS(BJ) B135713.55-031828.8 | NED | 1 |
| 70497 | 126660 | F14235+5204 | 2 | ||
| 72339 | 130322 | F14449-0004 | APMUKS(BJ) B144458.55-000415.4 | NED | 1 |
| 72659 | 131156 | F14491+1918 | 2 | ||
| 75039 | 136580 | F15182+4109 | 2MASX J15200834+4059114 | NED | 1 |
| 75118 | 136407 | F15182-1522 | MIPS | 3 | |
| 76641 | 139907 | F15374+4401 | UGC 09959 | NED | 1 |
| 77634 | 141556 | 15477-3328 | 6 | ||
| 78072 | 142860 | F15541+1548 | MIPS | 2 | |
| 78527 | 144284 | F16009+5841 | 2 | ||
| 78594 | 143840 | F16001-0440 | MIPS | 10 | |
| 79807 | 147094 | F16159+5229 | 2MASX J16171300+5222153 | NED | 1 |
| 81693 | 150680 | F16393+3141 | 2 | ||
| 83137 | 153377 | F16567-0136 | MIPS | 3 | |
| 83343 | … | F16599+2300 | 13 | ||
| 84696 | 156635 | F17162-0245 | 1 | ||
| 85104 | … | F17223+4811 | 9 | ||
| 85576 | 158373 | F17265-0957 | ISO | 6 | |
| 85790 | 159139 | 17299+2826 | CGCG 170-036 | NED | 1 |
| 86032 | 159561 | F17326+1235 | 2 | ||
| 86974 | 161797 | F17444+2744 | 2 | ||
| 87815 | 164330 | F17559+6236 | ISO | 6 | |
| 89937 | 170153 | F18220+7242 | 2 | ||
| 92683 | 174966 | 18505+0141 | 14 | ||
| 93371 | 176270 | F18576-3708 | IC 4812 | NED | 1 |
| 93449 | … | F18585-3701 | NGC 6729 | NED | 1 |
| 98025 | 189207 | F19544+6227 | MIPS | 3 | |
| 98433 | 189478 | 19575+0647 | 6 | ||
| 99240 | 190248 | F20039-6619 | 2 | ||
| 104206 | 199391 | F20593-8053 | MIPS | 3 | |
| 105090 | 202560 | F21141-3904 | MIPS | 2 | |
| 105858 | 203608 | F21223-6535 | MIPS | 2 | |
| 106368 | 204942 | F21297-2422 | APMUKS(BJ) B212943.47-242303.3 | NED | 1 |
| 107556 | 207098 | F21442-1621 | 2 | ||
| 108594 | … | F21563-6220 | APMUKS(BJ) B215622.59-622020.9 | NED | 1 |
| 108870 | 209100 | F21598-5700 | MIPS | 2 | |
| 111544 | 214168 | F22335+3921 | HIP 111546 | 5 | |
| 111558 | … | F22330-5154 | ESO 238-IG 019 | NED | 1 |
| 114996 | 219571 | F23145-5830 | ISO | 2 | |
| 118182 | … | F23558+5106 | HIP 118188 | 5 | |
| 118268 | 224617 | F23567+0634 | 6 |
References
- Aumann (1985) Aumann, H. H. 1985, PASP, 97, 885
- Aumann et al. (1984) Aumann, H. H., Gillett, F. C., Beichman, C. A., de Jong, T., Houck, J. R., Low, F. J., Neugebauer, G., Walker, R. G., & Wesseilus, P. R. 1984, ApJ, 278, L23
- Backman & Paresce (1993) Backman, D. E., & Paresce, F. 1993, in Protostars and Planets III, ed. V. Mannings, A.P. Boss, & S. S. Russell (Tucson: Univ. Arizona Press), 1253
- Batten (1989) Batten, A. H. 1989, in “Algols”, ed A.H. Batten, Kluwer Academic Publishers, Dordrecht, p. 1
- Beckwith et al. (2000) Beckwith, S. V. W., Henning, T., & Nakagawa, Y. 2000, in Protostars and Planets IV, ed. V. Mannings, A. P. Boss, & S. S. Russell (Tuscon: Univ. Arizona Press), 533
- Beichman et al. (2005) Beichman, C. A., Bryden, G., Rieke, G. H., Stansberry, J. A., Trilling, D. E., Stapelfeldt, K. R., Werner, M. W., Engelbracht, C. W., Blaylock, M., Gordon, K. D., Chen, C. H., Su, K. Y. L., & Hines, D. C. 2005, ApJ, 622, 1160
- Bessell (2000) Bessell, M. 2000, PASP, 112, 961
- Bryden et al. (2006) Bryden, G. et al. 2006, ApJ, 636, 1098
- Chen et al. (2005) Chen, C. H., Patten, B. M., Werner, M. W., Dowell, C. D., Stapelfeldt, K. R., Song, I., Stauffer, J. R., Blaylock, M., Gordon, K. D., & Krause, V. 2005, ApJ, 634, 1372
- Code et al. (1976) Code, A.D., Bless, R.C., Davis, J. & Brown, R.H. 1976, ApJ, 203, 417
- Cox (2000) Cox, A. N., ed., 2000 Allen’s Astrophysical Quantities. AIP Press and Springer, New York
- Decin et al. (2003) Decin, G., Dominik, C., Waters, L. B. F. M., & Waelkens, C. 2003, ApJ, 598, 636
- Dominik & Decin (2003) Dominik, C. & Decin, G. 2003, ApJ, 598, 626
- Greaves et al. (2004) Greaves, J. S., Wyatt, M. C., Holland, W. S., & Dent, W. R. F. 2004, MNRAS, 351, L54
- Guinan (1989) Guinan, E.F. 1989, in “Algols”, editor A.H. Batten, Kluewer Academic (Dordrecht), 35
- Habing et al. (2001) Habing, H. J., Dominik, C., Jourdain de Muizon, M., Laureijs, R. J., Kessler, M. F., Leech, K., Metcalfe, L., Salama, A., Siebenmorgen, R., Trams, N., & Bouchet, P. 2001, A&A, 365, 545
- Hauschildt, et al. (1999) Hauschildt, P. H., Allard, F., & Baron, E. 1999, ApJ, 512, 377
- Jura et al. (2004) Jura, M., et al. 2004, ApJS, 154, 453
- Kalas et al. (2002) Kalas, P., Graham, J. R., Beckwith, S. V. W., Jewitt, D. C., & Lloyd, J. P. 2002, ApJ, 567, 999
- Kenyon & Bromley (2004a) Kenyon, S. J. & Bromley, B. C. 2004a, AJ, 127, 513
- Kenyon & Bromley (2004b) Kenyon, S. J. & Bromley, B. C. 2004b, ApJ, 602, L133
- Kim et al. (2005) Kim J. et al. 2005, ApJ, 632, 659
- Kouwenhoven et al. (2005) Kouwenhoven, M. B. N., Brown, A. G. A., Zinnecker, H., Kaper, L., & Portegies Zwart, S. F. 2005, A&A, 430, 137
- Lagrange et al. (2000) Lagrange, A. M., Backman, D. E., & Artymowicz, P. 2000 in Protostars and Planets IV, eds. Mannings, V., Boss, A. P., Russell, S. S. (Tucson: University of Arizona Press), 639
- Low et al. (2005) Low, F. J., Smith, P. S., Werner, M., Chen, C., Krause, V., Jura, M., & Hines, D. C. 2005, ApJ, 631, 1170
- Lowrance et al. (2000) Lowrance, P. J., et al. 2000, ApJ, 541, 390
- Manoj & Bhatt (2005) Manoj, P. & Bhatt, H. C. 2005, A&A, 429, 525
- Meyer et al. (2004) Meyer, M. R. et al. 2004, ApJS, 154, 422
- Moór et al. (2006) Moór, A., Ábrahám, P., Derekas, A., Kiss, C., Kiss, L. L., Apai, D., Grady, C., & Henning, T. 2006, ApJ, 644, 525
- Najita & Williams (2005) Najita, J. & Williams, J. P. 2005, ApJ, 635, 625
- Odenwald (1986) Odenwald, S. F. 1986, ApJ, 307, 711
- Osterbrock (1974) Osterbrock, D.E. 1974, ”Astrophysics of Gaseous Nebulae”, W.H. Freeman & Company, San Francisco, p.21 & 79
- Peters (1989) Peters, G.J. 1989, in ”Algols”, editor A.H. Batten, Kluewer Academic (Dordrecht), 9
- Plavchan et al. (2005) Plavchan, P., Jura, M., Lipscy, S. J. 2005, ApJ, 631, 1161
- Pollack et al. (1994) Pollack, J. B., Hollenback, D., Beckwith, S., Simonelli, D. P., Roush, T., & Fong, W. 1994, ApJ, 421, 615
- Kim et al. (2007) Kim, S., Rhee, J. H. & Song, I. 2007, ApJ, in preparation
- Riaz et al. (2006) Riaz, B., Mullan, D. J., & Gizis, J. E. 2006, ApJ, 650, 1133
- Rieke et al. (2005) Rieke G.H. et al. 2005, ApJ, 620, 1010
- Schaller et al. (1992) Schaller, G., Schaerer, D., Meynet, G., & Maeder, A. 1992, A&AS, 96, 269
- Silverstone (2000) Silverstone M. 2000, The Vega phenomenon: evolution and multiplicity. PhD thesis. Univ. Calif., Los Angeles. 194 pp.
- Smith et al. (2006) Smith, P. S., Hines, D. C., Low, F. J., Gehrz, R. D., Polomski, E. F., Woodward, C. E. 2006, ApJ, 644, L125
- Song (2001) Song, I. 2001, in ASP Conf. Ser. 244, Young Stars Near Earth: Progress and Prospects, ed. R. Jayawardhana & T. Greene (San Francisco: ASP), 221 (S2001)
- Song et al. (2002a) Song, I., Bessell, M. S., & Zuckerman, B. 2002a, A&A, 385, 862 (SBZ)
- Song et al. (2000) Song, I., Caillault, J. -P., Barrado y Navascues, D., & Stauffer, J. R. 2000, ApJ, 533, L41 (S2000)
- Song et al. (2002b) Song, I., Weinberger, A., J., Becklin, E. E., Zuckerman, B., & Chen, C. 2002b, ApJ, 124, 514
- Song, Zuckerman, & Bessell (2003) Song, I., Zuckerman, B., & Bessell, M. S. 2003, ApJ, 599, 342 (SZB)
- Song et al. (2005) Song, I., Zuckerman, B., Weinberger, A. J., Becklin, E. E. 2005, Nature, 436, 363
- Spangler et al. (2001) Spangler, C., Sargent, A. I., Silverstone, M. D., Becklin, E. E., & Zuckerman, B. 2001, ApJ, 555, 932
- Stauffer et al. (2005) Stauffer, J. R. et al. 2005, AJ, 130, 1834
- Stern et al. (1995) Stern, R. A., Schmitt, J. H. M. M., Kahabka, P. T. 1995, ApJ, 448, 683
- Waters et al. (1991) Waters, L.B.F.M., Trams, N. R., Waelkens 1991, in ”The Infrared Spectral Region of Stars”, eds C. Jaschek & Y. Andrillat, Cambridge University Press, p. 40
- Williams & Andrews (2006) Williams, J. P., & Andrews, S. M. 2006, ApJ, 653, 1480
- Worek (2001) Worek, T. F. 2001, PASP, 113, 964
- Zuckerman (2001) Zuckerman, B. 2001, ARA&A, 39, 549
- Zuckerman et al. (1995b) Zuckerman, B., Forveille, T., & Kastner, J. H. 1995b, Nature, 373, 494 (ZFK)
- Zuckerman et al. (1995a) Zuckerman, B., Kim, S. S., & Liu, T. 1995a, ApJ, 446, L79
- Zuckerman & Song (2004a) Zuckerman, B., & Song, I. 2004a, ApJ, 603, 738 (Paper I)
- Zuckerman & Song (2004b) Zuckerman, B., & Song, I. 2004b, ARA&A, 42, 685
- Zuckerman et al. (2001a) Zuckerman, B., Song, I., Bessell, M. S., & Webb, R. A. 2001a, ApJ, 562, L87 (ZSBW)
- Zuckerman et al. (2001b) Zuckerman, B., Song, I., & Webb, R. A. 2001b, ApJ, 559, 388 (ZSW)
- Zuckerman & Webb (2000) Zuckerman, B., & Webb, R. A. 2000, ApJ, 535, 959 (ZW)


| HIP | HD | Other | Sp. Type | V | Distance |
|---|---|---|---|---|---|
| (mag) | (pc) | ||||
| 17890 | 275877 | XY Per | A2IIev | 9.44 | 120.0 |
| 23873 | 240764 | RW Aur A | G5V:e… | 10.3 | 70.5 |
| 26295 | 36910 | CQ Tau | F2IVe | 10.7 | 99.5 |
| 56354 | 100453 | … | A9Ve | 7.79 | 111.5 |
| 56379 | 100546 | KR Mus | B9Vne | 6.70 | 103.4 |
| 58520 | 104237 | DX Cha | A:pe | 6.60 | 116.1 |
| 82323 | … | V1121 Oph | K5 | 11.25 | 95.1 |
| V | D | angle | Dust mass | age | Age | Dust Excess | |||||||||
|---|---|---|---|---|---|---|---|---|---|---|---|---|---|---|---|
| HIP | HD | Sp. Type | (mag) | (pc) | () | (K) | (K) | (AU) | (arcsec) | (Myr) | Method††Age Methods: S2000: Song et al. (2000); S2001: Song (2001); SBZ: Song et al. (2002a); ZFK: Zuckerman et al. (1995b); ZSBW: Zuckerman et al. (2001a); ZSW: Zuckerman et al. (2001b); ZW: Zuckerman & Webb (2000); SZB: Song, Zuckerman, & Bessell (2003); a: UVW ; (Zuckerman & Song, 2004b); b: X-ray emission; e.g., Song, Zuckerman, & Bessell (2003); c: lithium age; (Song, Zuckerman, & Bessell, 2003); d: location on an A-star Hertzsprung-Russell diagram; (Lowrance et al., 2000) | Confirmation | Notesαα
1. binary.
2. New debris disk candidate. 3. Caution: IRAS SCANPI shows high background fluctuation near IRAS 60 detection. 4. HIP 7345 (=49 Cet) is the only known main-sequence A-type star with CO emission detected with a radio telescope (ZFK), thus suggesting a very young age. But its galactic space motion UVW () with respect to the Sun is not indicative of extreme youth (U is positive toward the Galactic center). 5. HIP 8241 shows the age of the Pleiades on an A star HR diagram (Lowrance et al., 2000) but of the Hyades in UVW measurements. 6. There is a galaxy at 48 East of HIP 13005 in the cross-scan direction as described in Paper I. However, a more careful check of the IRAS 60 offset using the FSC long format indicates that both IRAS 12 and 60 detections have the same offsets away from the galaxy in the same cross-scan direction. Thus, we include HIP 13005 with a caution. 7. No age estimate is given for HIP 13005, HIP 14576, HIP 96468, & HIP 110867 8. Eclipsing binary of the Algol type. 9. Spectroscopic binary. 10. Caution: IRAS SCANPI shows 30 offset IRAS 60 detection from the stellar position in in-scan direction. 11. There are two FSC detections for HIP 19704 separated by 34 in the in-scan direction. One has 12 and 25 detections, the other has a 60 detection. The long format of FSC locates the 60 source on HIP 19704. 12. In addition to the point-like 60 source reported in the FSC, there is an extended optical source 70 from the IRAS position of HIP 19893 in the in-scan direction. Jura et al. (2004) found no strong excess up to 35 in this star. Thus the IRAS excess at 60 should be regarded with caution. 13. Caution: there is a galaxy 90 East of HIP 22439. 14. Caution: there is a galaxy 55 East of the FSC position at the 3 edge of the error ellipse, mostly in the cross-scan direction. 15. Caution: IRAS FSC detection is 40 West of HIP 27980, and IRAS SCANPI profile is very broad. 16. Caution: there is a galaxy 58 away from the IRAS position of HIP 28230 in the cross-scan direction. 17. There is a ROSAT All-Sky Survey X-ray source 44 from HIP 32480, but UVW indicates an old age. 18. Location on A-star HR diagram near HR 4796 is suggestive of a 10 Myr age, but the V component of UVW (-16,-44,-9;Moór et al. 2006) is quite unlike that of most very young stars. 19. HIP 42430 is a binary. 20. Caution: IRAS SCANPI shows a bad profile fit to the 60 source. 21. Kouwenhoven et al. (2005) say HIP 53524 and HIP 61782 are LCC members. 22. Caution: IRAS SCANPI shows no source detection. 23. The M-star companion LDS 2662 to HIP 63584 is very young based on its location on an versus color magnitude diagram (e.g., Figure 2 in SZB). 24. Moór et al. (2006) rejected HIP 69682 based on a nearby 2MASS source with an excess in the -band. However, no NED identified extended source exists within 2 from this star and the FSC long format indicates that the 60 detection falls on the star itself. The Galactic space motion (UVW) and absence of lithium and of X-ray emission all point to an old star. There is no evidence on the Digital Sky Survey and 2MASS All Sky QuickLook Images () of a nearby galaxy. Yet is very large. 25. HIP 73145 is an Upper Centaurus Lupus member. 26. HIP 73473 has significant X-ray flux. 27. Caution: there exists a large galaxy at 80 East of HIP 76375. 28. Moór et al. (2006) rejected HIP 77163 & HIP 83480 based on their location near the wall of the Local Bubble. |
||
| (1) | (2) | (3) | (4) | (5) | (6) | (7) | (8) | (9) | (10) | (11) | (12) | (13) | (14) | (15) | (16) |
| 746 | 432 | F2III-IV | 2.3 | 16.7 | 3.36 | 7200 | 120 | 28 | 1.68 | 2.50E-05 | 2.15E-03 | 1000 | a,b,c | … | |
| 1185 | 1051 | A7III | 6.8 | 88.3 | 1.87 | 8000 | 40 | 173 | 1.97 | 4.32E-04 | 600 | a,d | … | ||
| 4267 | 5267 | A1Vn | 5.8 | 112.6 | 2.67 | 10000 | 85 | 86 | 0.76 | 8.77E-05 | 200 | a,d | … | 1,2,3 | |
| 5626 | 6798 | A3V | 5.6 | 83.5 | 2.25 | 10000 | 75 | 93 | 1.12 | 1.49E-04 | 1.41E-01 | 200? | a,d | … | |
| 6686 | 8538 | A5Vv | 2.7 | 30.5 | 3.90 | 8400 | 85 | 88 | 2.90 | 5.95E-06 | 600 | a,d | … | ||
| 6878 | 8907 | F8 | 6.7 | 34.2 | 1.19 | 6600 | 45 | 59 | 1.74 | 2.08E-04 | 3.84E-02‡‡Dust mass measurements are directly from submillimeter observations. | 200? | a,b,c | MIPS/ISO | |
| 7345 | 9672 | A1V | 5.6 | 61.3 | 1.66 | 10000 | 80 | 60 | 0.99 | 7.94E-04 | 3.13E-01 | 20? | ZFK | … | 4 |
| 7805 | 10472 | F2IV/V | 7.6 | 66.6 | 1.28 | 7000 | 70 | 30 | 0.45 | 3.68E-04 | 3.39E-02 | 30 | ZSW | MIPS | |
| 7978 | 10647 | F8V | 5.5 | 17.4 | 0.99 | 6400 | 65 | 22 | 1.28 | 4.16E-04 | 2.21E-02 | 300? | a,b,c | … | |
| 8122 | 10638 | A3 | 6.7 | 71.7 | 1.57 | 8200 | 85 | 33 | 0.47 | 4.69E-04 | 100 | a,d | … | ||
| 8241 | 10939 | A1V | 5.0 | 57.0 | 1.94 | 10000 | 75 | 80 | 1.41 | 6.44E-05 | 4.52E-02 | 200? | a,d | MIPS | 2,5 |
| 9570 | 12471 | A2V | 5.5 | 113.5 | 3.28 | 10000 | 85 | 105 | 0.93 | 1.01E-04 | 600 | a,d | … | ||
| 10054 | 12467 | A1V | 6.0 | 68.4 | 1.73 | 9200 | 60 | 94 | 1.38 | 8.72E-05 | 8.45E-02 | 200?? | a,d | MIPS | 2 |
| 10670 | 14055 | A1Vnn | 4.0 | 36.1 | 1.96 | 10000 | 75 | 80 | 2.24 | 7.18E-05 | 2.86E-02‡‡Dust mass measurements are directly from submillimeter observations. | 100? | a,d | … | |
| 11360 | 15115 | F2 | 6.8 | 44.8 | 1.23 | 7200 | 65 | 35 | 0.78 | 5.08E-04 | 4.48E-02‡‡Dust mass measurements are directly from submillimeter observations. | 100? | a,b,c | MIPS/ISO | |
| 11486 | 15257 | F0III | 5.3 | 47.6 | 2.26 | 7400 | 85 | 39 | 0.84 | 1.14E-04 | 1.90E-02 | 1000 | a,d | … | 2 |
| 11847 | 15745 | F0 | 7.5 | 63.7 | 1.21 | 7600 | 85 | 22 | 0.35 | 1.72E-03 | 9.13E-02 | 30? | d | MIPS/ISO | |
| 12361 | 16743 | F1III/IV | 6.8 | 60.0 | 1.58 | 7200 | 40 | 119 | 1.98 | 5.94E-04 | 200 | a,d | MIPS | ||
| 12964 | 17390 | F3IV/V | 6.5 | 45.1 | 1.39 | 7200 | 55 | 55 | 1.23 | 2.00E-04 | 8.52E-02 | 300?? | a | MIPS | |
| 13005 | … | K0 | 8.1 | 67.7 | 2.17 | 5200 | 85 | 18 | 0.28 | 1.11E-03 | … | b | … | 6,7 | |
| 13141 | 17848 | A2V | 5.3 | 50.7 | 1.88 | 8200 | 55 | 97 | 1.92 | 6.39E-05 | 6.59E-02 | 100 | a,d | MIPS | |
| 14576 | 19356 | B8V | 2.1 | 28.5 | 4.13 | 9200 | 250 | 13 | 0.46 | 1.67E-05 | … | … | MIPS | 2,7,8 | |
| 15197 | 20320 | A5m | 4.8 | 36.8 | 2.00 | 7800 | 95 | 31 | 0.85 | 2.46E-05 | 2.59E-03 | 400? | a,d | MIPS | 9 |
| 16449 | 21997 | A3IV/V | 6.4 | 73.8 | 1.57 | 9000 | 60 | 82 | 1.12 | 4.90E-04 | 2.24E-01‡‡Dust mass measurements are directly from submillimeter observations. | 50? | a,d | MIPS | |
| 16537 | 22049 | K2V | 3.7 | 3.2 | 0.69 | 5200 | 40 | 27 | 8.47 | 8.30E-05 | 2.61E-03‡‡Dust mass measurements are directly from submillimeter observations. | 730 | S2000 | MIPS/ISO | |
| 18437 | 24966 | A0V | 6.9 | 103.5 | 1.50 | 10000 | 85 | 48 | 0.47 | 2.58E-04 | 10 | d | … | ||
| 18859 | 25457 | F5V | 5.4 | 19.2 | 1.19 | 6400 | 85 | 16 | 0.81 | 1.31E-04 | 3.68E-03 | 30 | a,b,c | MIPS/ISO | |
| 18975 | 25570 | F2V | 5.4 | 36.0 | 1.83 | 7000 | 85 | 28 | 0.80 | 8.86E-05 | 600 | Hyades | … | 2,3 | |
| 19704 | 27346 | A9IV | 7.0 | 114.5 | 2.57 | 7600 | 70 | 70 | 0.62 | 2.61E-04 | 600? | a,d | … | 2,10,11 | |
| 19893 | 27290 | F4III | 4.3 | 20.3 | 1.65 | 7200 | 80 | 31 | 1.53 | 2.30E-05 | 300? | a,b | … | 12 | |
| 20635 | 27934 | A7IV-V | 4.2 | 47.0 | 2.60 | 9000 | 85 | 67 | 1.44 | 4.72E-05 | 600 | Hyades | … | 2,10 | |
| 21604 | 29365 | B8V | 5.8 | 110.7 | 3.06 | 8800 | 75 | 97 | 0.88 | 3.78E-04 | 200? | a,d | … | 2,8 | |
| 22226 | 30447 | F3V | 7.9 | 78.1 | 1.31 | 7200 | 65 | 37 | 0.48 | 8.85E-04 | 1.33E-01 | 100 | a | MIPS | |
| 22439 | 30743 | F3/F5V | 6.3 | 35.4 | 1.46 | 6400 | 40 | 86 | 2.45 | 2.28E-04 | 1000 | a,b,c | … | 2,13 | |
| 22845 | 31295 | A0V | 4.6 | 37.0 | 1.67 | 9000 | 80 | 49 | 1.33 | 8.44E-05 | 2.22E-02 | 100? | a,d | MIPS | |
| 23451 | 32297 | A0 | 8.1 | 112.1 | 1.24 | 8400 | 85 | 28 | 0.25 | 5.38E-03 | 4.62E-01 | 20? | d | … | |
| 24528 | 34324 | A3V | 6.8 | 85.8 | 1.59 | 8800 | 100 | 28 | 0.33 | 1.72E-04 | 1.48E-02 | 200? | d | … | |
| 25197 | 34787 | A0Vn | 5.2 | 104.3 | 3.26 | 10000 | 120 | 52 | 0.50 | 6.97E-05 | 2.07E-02 | 400? | a,d | … | 2 |
| 25790 | 36162 | A3Vn | 5.9 | 105.6 | 2.92 | 8800 | 85 | 72 | 0.69 | 2.49E-04 | 600? | a,d | … | 14 | |
| 26453 | 37484 | F3V | 7.2 | 59.5 | 1.36 | 7000 | 90 | 19 | 0.32 | 2.85E-04 | 1.13E-02 | 30 | a,b,c | MIPS | |
| 26966 | 38206 | A0V | 5.7 | 69.2 | 1.63 | 10000 | 85 | 53 | 0.76 | 1.99E-04 | 6.13E-02 | 50 | a,d | MIPS | |
| 27072 | 38393 | F7V | 3.6 | 9.0 | 1.18 | 6600 | 90 | 15 | 1.64 | 7.71E-06 | 4.48E-04‡‡Dust mass measurements are directly from submillimeter observations. | 1000?? | a,b | MIPS | |
| 27288 | 38678 | A2Vann | 3.5 | 21.5 | 1.65 | 9000 | 220 | 6 | 0.30 | 1.34E-04 | 100 | a,d | MIPS | ||
| 27321 | 39060 | A3V | 3.9 | 19.3 | 1.37 | 8600 | 110 | 19 | 1.01 | 2.64E-03 | 8.99E-02‡‡Dust mass measurements are directly from submillimeter observations. | 12 | Pic | MIPS | |
| 27980 | 39833 | G0III | 7.7 | 46.7 | 1.23 | 6000 | 70 | 20 | 0.45 | 2.79E-03 | 700 | a,b,c | … | 2,15 | |
| 28103 | 40136 | F1V | 3.7 | 15.0 | 1.52 | 7400 | 185 | 6 | 0.38 | 2.04E-05 | 300? | a,b,d | MIPS | ||
| 28230 | 40540 | A8IVm | 7.5 | 89.9 | 1.45 | 7800 | 90 | 25 | 0.28 | 6.06E-04 | 200 | d | … | 2,16 | |
| 32480 | 48682 | G0V | 5.2 | 16.5 | 1.08 | 6400 | 60 | 29 | 1.73 | 8.93E-05 | 600?? | a,b | MIPS | 17 | |
| 32775 | 50571 | F7III-IV | 6.1 | 33.2 | 1.38 | 6600 | 45 | 68 | 2.08 | 1.63E-04 | 8.26E-02 | 300? | a,b,c | MIPS | |
| 33690 | 53143 | K0IV-V | 6.8 | 18.4 | 0.88 | 5400 | 80 | 9 | 0.50 | 1.97E-04 | 1.87E-03 | 300? | a,b,c | MIPS | |
| 34276 | 54341 | A0V | 6.5 | 92.9 | 1.59 | 10000 | 85 | 51 | 0.55 | 2.01E-04 | 10 | d | … | 18 | |
| 34819 | 55052 | F5IV | 5.8 | 107.1 | 4.74 | 6800 | 45 | 251 | 2.35 | 1.01E-04 | 300?? | a,c | … | 2,3 | |
| 35550 | 56986 | F0IV… | 3.5 | 18.0 | 2.13 | 7200 | 60 | 71 | 3.95 | 8.93E-06 | 4.94E-03 | 400?? | a,b,d | MIPS | 9 |
| 36906 | 60234 | G0 | 7.6 | 108.6 | 2.78 | 6200 | 85 | 34 | 0.32 | 4.29E-04 | 600? | a,b | … | 2 | |
| 36948 | 61005 | G3/G5V | 8.2 | 34.5 | 0.81 | 5600 | 60 | 16 | 0.48 | 2.58E-03 | 7.24E-02 | 100? | a,b,c | MIPS | |
| 39757 | 67523 | F2mF5IIp | 2.8 | 19.2 | 3.41 | 6800 | 85 | 50 | 2.64 | 5.38E-06 | 2000 | a,b,c | … | ||
| 40938 | 70298 | F2 | 7.2 | 70.9 | 1.77 | 6800 | 85 | 26 | 0.37 | 3.54E-04 | 3000 | a,b | … | 2 | |
| 41152 | 70313 | A3V | 5.5 | 51.4 | 1.54 | 10000 | 80 | 56 | 1.09 | 5.24E-05 | 1.80E-02 | 200 | a,d | MIPS | |
| 41307 | 71155 | A0V | 3.9 | 38.3 | 2.02 | 10000 | 130 | 29 | 0.73 | 4.09E-05 | 3.77E-03 | 100 | a,d | MIPS | |
| 42028 | 72660 | A1V | 5.8 | 100.0 | 2.39 | 10000 | 85 | 77 | 0.77 | 7.07E-05 | 200 | a,d | … | 2 | |
| 42430 | 73752 | G3/G5V | 5.1 | 19.9 | 1.73 | 5800 | 80 | 21 | 1.06 | 3.21E-05 | 1.55E-03 | 600 | S2000 | … | 19 |
| 43970 | 76543 | A5III | 5.2 | 49.0 | 1.86 | 8800 | 85 | 46 | 0.94 | 1.04E-04 | 400? | a,d | … | 2 | |
| 44001 | 76582 | F0IV | 5.7 | 49.3 | 1.73 | 8000 | 85 | 35 | 0.72 | 2.22E-04 | 300?? | a,d | … | ||
| 45758 | 80425 | A5 | 6.6 | 98.1 | 2.43 | 7600 | 85 | 45 | 0.46 | 2.70E-04 | 300? | a,d | … | 2 | |
| 48164 | 84870 | A3 | 7.2 | 89.5 | 1.59 | 8000 | 85 | 32 | 0.37 | 5.48E-04 | 100 | d | … | 1 | |
| 48541 | 85672 | A0 | 7.6 | 93.1 | 1.19 | 9200 | 85 | 32 | 0.35 | 4.82E-04 | 30? | a,d | … | ||
| 51438 | 91375 | A2III | 4.7 | 79.4 | 3.10 | 10000 | 85 | 99 | 1.26 | 2.42E-05 | 400?? | a,d | … | 20 | |
| 51658 | 91312 | A7IV | 4.7 | 34.3 | 1.84 | 8200 | 40 | 179 | 5.23 | 1.06E-04 | 200 | a,d | … | 9 | |
| 52462 | 92945 | K1V | 7.7 | 21.6 | 0.77 | 5200 | 45 | 23 | 1.11 | 6.74E-04 | 3.91E-02 | 100 | SBZ | MIPS | |
| 53524 | 95086 | A8III | 7.4 | 91.6 | 1.49 | 8200 | 85 | 32 | 0.35 | 1.49E-03 | 50 | d | … | 2,21 | |
| 53910 | 95418 | A1V | 2.3 | 24.3 | 2.84 | 10000 | 120 | 45 | 1.88 | 1.23E-05 | 2.73E-03 | 500 | UMa | … | |
| 53911 | … | K8Ve | 11.1 | 56.4 | 1.11 | 4000 | 140? | 2 | 0.04 | 2.17E-01 | 8 | TWHya | MIPS | ||
| 55505 | 98800 | K4V | 9.1 | 46.7 | 1.97 | 4200 | 160 | 3 | 0.07 | 1.12E-01 | 8 | TWA | MIPS | 9 | |
| 56253 | 99945 | A2m | 6.1 | 59.8 | 1.72 | 8200 | 85 | 37 | 0.62 | 1.04E-04 | 300? | a,d | … | ||
| 56675 | 101132 | F1III | 5.6 | 42.1 | 1.95 | 7000 | 50 | 88 | 2.11 | 1.42E-04 | 300 | a,b,c,d | … | 2,22 | |
| 57632 | 102647 | A3Vvar | 2.1 | 11.1 | 1.67 | 8800 | 160 | 11 | 1.06 | 4.25E-05 | 5.64E-04 | 50 | S2001 | MIPS | |
| 60074 | 107146 | G2V | 7.0 | 28.5 | 0.97 | 6200 | 55 | 29 | 0.97 | 9.50E-04 | 8.99E-02‡‡Dust mass measurements are directly from submillimeter observations. | 100 | a,b,c | MIPS | |
| 61174 | 109085 | F2V | 4.3 | 18.2 | 1.62 | 6800 | 180 | 5 | 0.30 | 1.20E-04 | 300 | a,b,c | MIPS | ||
| 61498 | 109573 | A0V | 5.8 | 67.1 | 1.59 | 10000 | 110 | 30 | 0.46 | 4.43E-03 | 2.11E-01‡‡Dust mass measurements are directly from submillimeter observations. | 8 | HR 4796A | MIPS | |
| 61782 | 110058 | A0V | 8.0 | 99.9 | 1.09 | 8800 | 130 | 11 | 0.12 | 2.54E-03 | 3.37E-02 | 10? | LCC | IRS | 21 |
| 61960 | 110411 | A0V | 4.9 | 36.9 | 1.49 | 9000 | 85 | 38 | 1.05 | 6.23E-05 | 9.86E-03 | 100?? | a,d | MIPS | |
| 63584 | 113337 | F6V | 6.0 | 37.4 | 1.50 | 7200 | 100 | 18 | 0.48 | 1.01E-04 | 3.59E-03 | 50? | a,b | … | 23 |
| 64375 | 114576 | A5V | 6.5 | 112.6 | 2.63 | 8200 | 85 | 56 | 0.51 | 3.90E-04 | 600 | a,d | … | 1 | |
| 64921 | 115116 | A7V | 7.1 | 85.4 | 1.53 | 8400 | 80 | 39 | 0.46 | 3.39E-04 | 100? | a,d | … | ||
| 68101 | 121384 | G8V | 6.0 | 38.1 | 2.95 | 5200 | 45 | 91 | 2.41 | 2.47E-04 | 3000 | a,b,c | … | ||
| 68593 | 122652 | F8 | 7.2 | 37.2 | 1.07 | 6400 | 60 | 28 | 0.76 | 1.36E-04 | 1.17E-02 | 300? | a,b,c | MIPS | |
| 69682 | 124718 | G5V | 8.9 | 61.3 | 0.98 | 5800 | 85 | 10 | 0.17 | 2.11E-03 | 500 | a,b,c | … | 24 | |
| 69732 | 125162 | A0sh | 4.2 | 29.8 | 1.72 | 9000 | 100 | 32 | 1.09 | 5.22E-05 | 5.86E-03 | 200? | a,d | MIPS | |
| 70090 | 125473 | A0IV | 4.1 | 75.8 | 3.98 | 10000 | 120 | 64 | 0.85 | 2.11E-05 | 9.48E-03 | 300 | a,d | … | |
| 70344 | 126265 | G2III | 7.2 | 70.1 | 2.12 | 6200 | 85 | 26 | 0.37 | 3.85E-04 | 500 | a,b | … | ||
| 70952 | 127821 | F4IV | 6.1 | 31.7 | 1.30 | 6800 | 50 | 55 | 1.76 | 2.58E-04 | 8.26E-02‡‡Dust mass measurements are directly from submillimeter observations. | 200? | a,b | … | |
| 71075 | 127762 | A7IIIvar | 3.0 | 26.1 | 3.08 | 8000 | 55 | 151 | 5.80 | 1.04E-05 | 1000 | a,d | … | ||
| 71284 | 128167 | F3Vwvar | 4.5 | 15.5 | 1.39 | 6600 | 40 | 88 | 5.70 | 4.91E-06 | 6.37E-03‡‡Dust mass measurements are directly from submillimeter observations. | 1000?? | a,b,c | MIPS/ISO | |
| 73049 | 131625 | A0V | 5.3 | 75.8 | 2.49 | 9000 | 85 | 64 | 0.86 | 7.39E-05 | 200 | a,d | … | 2 | |
| 73145 | 131835 | A2IV | 7.9 | 111.1 | 1.26 | 8600 | 90 | 26 | 0.24 | 3.07E-03 | 2.28E-01 | 10 | d | … | 25 |
| 73473 | 132742 | B9.5V | 4.9 | 93.3 | 3.94 | 8800 | 150 | 31 | 0.34 | 7.22E-05 | 7.61E-03 | 500 | a,d | … | 2,8,26 |
| 73512 | 132950 | K2 | 9.1 | 30.4 | 0.75 | 4800 | 85 | 5 | 0.18 | 1.17E-03 | 3000?? | … | … | 2 | |
| 74596 | 135502 | A2V | 5.3 | 69.4 | 2.24 | 10000 | 65 | 123 | 1.77 | 3.26E-05 | 200 | a,d | … | ||
| 74946 | 135382 | A1V | 2.9 | 56.0 | 5.86 | 9400 | 50 | 481 | 8.60 | 9.29E-06 | 700?? | a,d | … | ||
| 76127 | 138749 | B6Vnn | 4.2 | 95.3 | 4.16 | 10000 | 75 | 171 | 1.80 | 1.99E-05 | 200? | a,d | … | ||
| 76267 | 139006 | A0V | 2.2 | 22.9 | 2.72 | 10000 | 190 | 17 | 0.76 | 2.41E-05 | 7.64E-04 | 500 | a,b,d | MIPS | 8 |
| 76375 | 139323 | K3V | 7.6 | 22.3 | 0.85 | 5200 | 29 | 64 | 2.87 | 7.86E-04 | 5000?? | a,b | … | 2,27 | |
| 76635 | 139590 | G0V | 7.5 | 55.1 | 1.40 | 6200 | 85 | 17 | 0.31 | 3.93E-04 | 5000?? | a,b | … | ||
| 76736 | 138965 | A5V | 6.4 | 77.3 | 1.47 | 9600 | 140 | 16 | 0.21 | 1.17E-04 | 3.28E-03 | 20 | a,d | MIPS | 2 |
| 76829 | 139664 | F5IV-V | 4.6 | 17.5 | 1.26 | 7000 | 75 | 25 | 1.46 | 1.15E-04 | 7.88E-03 | 200? | a,b,c | MIPS | |
| 77163 | 140775 | A1V | 5.6 | 117.8 | 3.25 | 10000 | 40 | 472 | 4.01 | 1.39E-04 | 600 | a,d | … | 28 | |
| 77542 | 141569 | B9 | 7.1 | 99.0 | 1.49 | 9200 | 110 | 24 | 0.25 | 1.12E-02 | 3.32E-01‡‡Dust mass measurements are directly from submillimeter observations. | 5 | HD 141569 | MIPS | |
| 78554 | 143894 | A3V | 4.8 | 54.3 | 2.27 | 9000 | 45 | 211 | 3.89 | 4.64E-05 | 300 | a,d | … | ||
| 81126 | 149630 | B9Vvar | 4.2 | 92.7 | 4.91 | 9400 | 80 | 157 | 1.70 | 3.01E-05 | 700 | a,d | … | 1 | |
| 81641 | 150378 | A1V | 5.8 | 92.9 | 2.23 | 10000 | 95 | 57 | 0.62 | 1.24E-04 | 4.42E-02 | 200 | a,d | … | 1 |
| 81800 | 151044 | F8V | 6.5 | 29.4 | 1.21 | 6200 | 55 | 35 | 1.22 | 8.30E-05 | 1.11E-02 | 500 | a,b | MIPS/ISO | |
| 82405 | 151900 | F1III-IV | 6.3 | 59.8 | 2.30 | 6600 | 85 | 32 | 0.54 | 2.98E-04 | 1000 | a,d | … | 2,10 | |
| 83480 | 154145 | A2 | 6.7 | 94.9 | 1.99 | 8400 | 85 | 45 | 0.48 | 4.28E-04 | 300? | d | … | 28 | |
| 85157 | 157728 | F0IV | 5.7 | 42.8 | 1.43 | 8600 | 90 | 30 | 0.71 | 2.67E-04 | 2.63E-02 | 100? | a,d | … | |
| 85537 | 158352 | A8V | 5.4 | 63.1 | 2.52 | 8400 | 70 | 85 | 1.35 | 6.81E-05 | 5.39E-02 | 600? | a,d | MIPS | |
| 87108 | 161868 | A0V | 3.7 | 29.1 | 1.91 | 9400 | 85 | 54 | 1.87 | 7.84E-05 | 2.51E-02 | 200? | a,d | MIPS | |
| 87558 | 162917 | F4IV-V | 5.8 | 31.4 | 1.50 | 6600 | 85 | 20 | 0.67 | 2.49E-04 | 400? | a,b,c | … | ||
| 88399 | 164249 | F5V | 7.0 | 46.9 | 1.27 | 6800 | 70 | 27 | 0.60 | 1.03E-03 | 8.23E-02 | 12 | ZSBW | MIPS/ISO | |
| 90185 | 169022 | B9.5III | 1.8 | 44.3 | 6.66 | 10000 | 100 | 155 | 3.50 | 4.46E-06 | 300?? | a,b,d | … | ||
| 90936 | 170773 | F5V | 6.2 | 36.1 | 1.34 | 7000 | 50 | 61 | 1.69 | 4.63E-04 | 1.89E-01 | 200? | a,b,c | MIPS/ISO | |
| 91262 | 172167 | A0Vvar | 0.0 | 7.8 | 2.58 | 10000 | 80 | 93 | 12.10 | 2.14E-05 | 8.37E-03‡‡Dust mass measurements are directly from submillimeter observations. | 220 | Vega | MIPS | |
| 92024 | 172555 | A7V | 4.8 | 29.2 | 1.52 | 8000 | 320 | 2 | 0.08 | 8.10E-04 | 12 | ZSBW | MIPS | ||
| 93542 | 176638 | A0Vn | 4.7 | 56.3 | 2.11 | 10000 | 120 | 34 | 0.60 | 9.70E-05 | 1.23E-02 | 200? | a,d | … | |
| 95261 | 181296 | A0Vn | 5.0 | 47.7 | 1.61 | 9600 | 150 | 15 | 0.32 | 2.13E-04 | 5.25E-03 | 12 | ZSBW | MIPS/ISO | |
| 95270 | 181327 | F5/F6V | 7.0 | 50.6 | 1.39 | 6600 | 75 | 25 | 0.50 | 3.47E-03 | 2.38E-01 | 12 | ZSBW | MIPS | |
| 95619 | 182681 | B8/B9V | 5.7 | 69.1 | 1.71 | 10000 | 85 | 55 | 0.80 | 1.95E-04 | 50? | a,d | … | ||
| 96468 | 184930 | B5III | 4.3 | 94.3 | 4.01 | 10000 | 60 | 259 | 2.75 | 3.52E-05 | … | … | … | 2,7 | |
| 99273 | 191089 | F5V | 7.2 | 53.5 | 1.39 | 6600 | 95 | 15 | 0.29 | 1.39E-03 | 3.43E-02 | 30 | a,b,c | MIPS | 9 |
| 99473 | 191692 | B9.5III | 3.2 | 88.0 | 6.63 | 10000 | 85 | 213 | 2.43 | 6.60E-06 | 500? | a,d | … | ||
| 101612 | 195627 | F1III | 4.8 | 27.6 | 1.70 | 7400 | 65 | 51 | 1.86 | 1.11E-04 | 3.17E-02 | 200? | a,d | MIPS | |
| 101769 | 196524 | F5IV | 3.6 | 29.9 | 3.63 | 6800 | 130 | 23 | 0.77 | 1.56E-05 | 9.05E-04 | 200?? | a,b,c | … | 2,9 |
| 101800 | 196544 | A2V | 5.4 | 54.3 | 1.65 | 9000 | 100 | 31 | 0.57 | 3.86E-05 | 4.07E-03 | 30 | a,d | MIPS | 9 |
| 102409 | 197481 | M1Ve | 8.8 | 9.9 | 0.86 | 3500 | 50 | 9 | 0.98 | 3.64E-04 | 8.80E-03‡‡Dust mass measurements are directly from submillimeter observations. | 12 | ZSBW | MIPS | |
| 103752 | 199475 | A2V | 6.4 | 83.3 | 1.83 | 8800 | 85 | 45 | 0.55 | 2.45E-04 | 200 | a,d | … | 2 | |
| 105570 | 203562 | A3V | 5.2 | 110.4 | 4.02 | 9000 | 85 | 104 | 0.95 | 8.80E-05 | 600? | a,d | … | 1 | |
| 106741 | 205674 | F3/F5IV | 7.2 | 52.6 | 1.22 | 7200 | 85 | 20 | 0.39 | 3.96E-04 | 300? | a,b | … | ||
| 107022 | 205536 | G8V | 7.1 | 22.1 | 0.89 | 5600 | 80 | 10 | 0.46 | 2.92E-04 | 3.20E-03 | 500 | a,b | … | |
| 107412 | 206893 | F5V | 6.7 | 38.9 | 1.24 | 6600 | 55 | 41 | 1.07 | 2.72E-04 | 3.18E-02‡‡Dust mass measurements are directly from submillimeter observations. | 200? | a,b | MIPS/ISO | |
| 107649 | 207129 | G2V | 5.6 | 15.6 | 0.98 | 6000 | 55 | 27 | 1.74 | 1.21E-04 | 9.67E-03 | 600 | SZB | MIPS/ISO | |
| 108809 | 209253 | F6/F7V | 6.6 | 30.1 | 1.10 | 6200 | 75 | 18 | 0.58 | 7.33E-05 | 2.60E-03 | 200?? | a,b,c | MIPS/ISO | |
| 109857 | 211336 | F0IV | 4.2 | 25.7 | 1.86 | 7800 | 65 | 62 | 2.41 | 1.56E-04 | 6.58E-02 | 600? | a,c,d | … | |
| 110867 | 210681 | K0III | 8.1 | 61.8 | 1.87 | 5200 | 85 | 16 | 0.26 | 7.15E-04 | … | … | … | 2,7 | |
| 111278 | 213617 | F1V | 6.4 | 52.9 | 1.57 | 7600 | 55 | 69 | 1.32 | 9.35E-05 | 4.9E-02 | 600? | a,d | MIPS | |
| 113368 | 216956 | A3V | 1.2 | 7.7 | 1.81 | 8600 | 65 | 73 | 9.60 | 7.98E-05 | 2.41E-02‡‡Dust mass measurements are directly from submillimeter observations. | 220 | Fomalhaut | MIPS | |
| 114189 | 218396 | A5V | 6.0 | 39.9 | 1.37 | 7800 | 50 | 77 | 1.94 | 2.29E-04 | 1.00E-01‡‡Dust mass measurements are directly from submillimeter observations. | 30 | a,d | ISO | |
| 116431 | 221853 | F0 | 7.3 | 71.2 | 1.48 | 7400 | 85 | 26 | 0.37 | 7.38E-04 | 5.47E-02 | 100 | a | MIPS/ISO |
Note. — Calculations use 1 AU=215
| HIP | HD | Other | Rieke et al. (2005) | This Paper | Triple | |
|---|---|---|---|---|---|---|
| Observed? | Excess? | Excess? | System? | |||
| 14576 | 19356 | Algol A | yes | 1.07 (no) | marginal? | yes |
| 21604 | 29365 | HU Tau | no | strong | ? | |
| 28360 | 40183 | Aur | yes | 0.88 (no) | nothing | ? |
| 73473 | 132742 | Lib | no | 2 wavelengths | yes | |
| 76267 | 139006 | CrB | yes | 1.29 (yes) | 2 wavelengths | ? |