Stars and Gas in the Inner Parts of Galaxies seen in SAURON Integral Field Observations
Abstract
We give two examples of spiral galaxies that show non-circular gas motions in the inner kiloparsecs, from SAURON integral field spectroscopy. We use harmonic decomposition of the velocity field of the ionized gas to study the underlying mass distribution, employing linear theory. The higher order harmonic terms and the main kinematic features of the observed data are consistent with an analytically constructed simple bar model. We also present maps of a number of strong absorption lines in M 100, derive simple stellar populations and correlate them with features in the gas kinematics.
keywords:
galaxies: bulges, galaxies: evolution, galaxies: formation, galaxies: kinematics and dynamics, galaxies: spiral, galaxies: structure, galaxies: nuclei, galaxies: individual (NGC 5448, M 100),
, ,
, , ,
1 Introduction
Although circular rotation is the dominant kinematic feature of galactic disks, it is clear from observations and theory that in many galaxies non-circular motions are also present (e.g. Freeman et al. 1965, Shlosman et al. 1989). Non-axisymmetric motion can, in fact, be a crucial ingredient in determining the evolution of a galaxy, by triggering star formation, or by building a central mass concentration.
We know that many galaxies show non-axisymmetric mass-distributions: near-infrared photometric studies show that at least 70% of the galaxies in the nearby Universe show strong or weak bars (Eskridge et al. 2000, Knapen et al. 2000a). Such asymmetric features in the mass-distribution will produce non-circular motions, although also other effects, such as interactions with other galaxies, can cause them. Gas, being more responsive to perturbations and instabilities than stars, will show these non-circular motions more easily. Athanassoula (1992) shows how gas streaming manifests itself in galaxies with strong bars. Her calculations show that one can use the motion of the gas, as measured in two dimensions, to derive information about the mass distribution in galaxies, especially if these are relatively isolated. This has not been done very often in the literature up to now, since good, high resolution data is scarce, and up to recently a good theoretical framework was lacking.
Recently, Wong, Blitz & Bosma (2004) have quantified the strength of bars and spiral arms using HI and CO velocity fields of a number of nearby galaxies. They used a harmonic decomposition formalism developed by Schoenmakers et al. (1997), and compared the results with analytical models. Here we do the same with much higher resolution optical emission line data, obtained with the Integral Field Spectrograph SAURON, for NGC 5448, an early-type spiral galaxy. More details can be found in Fathi et al. (2005; F05).
From the SAURON data one can not just measure emission lines, but also absorption lines. In the second part of this paper we present absorption line maps of the central regions of M100, together with some simple stellar population models, recently published by Allard et al. (2006; A06). Absorption lines, contrary to integrated colours, are relatively insensitive to dust absorption, so that more accurate ages and other stellar population parameters can be obtained.
In the future we plan to perform a harmonic decomposition (also called kinemetry, see Krajnovic et al. 2006) on the full sample SAURON early-type spirals, presented in Falcón-Barroso et al. (2006), and analyse statistically the non-axisymmetric motions in the centers of nearby spirals.
2 A bar signature in the gas velocity field of NGC 5448
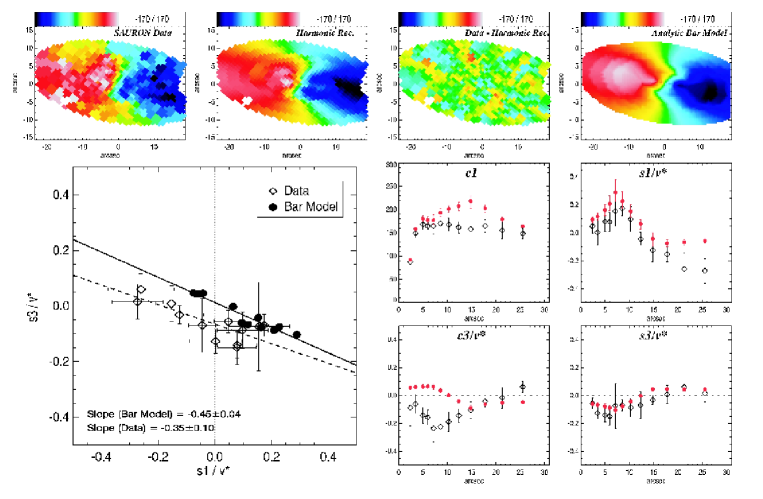
In Fig. 1 we show the observed velocity field of NGC 5448 from the [OIII] emission line at 5007Å. Clearly visible is the streaming at the bottom right and top left. Decomposing the velocity field into Fourier harmonic components using
| (1) |
where =3, cn and sn give us information about the nature of the perturbations. As mentioned in F05, c1, c3 and s3 give information about possible = 2 perturbations. These coefficients are plotted in the figure, along with an analytic bar model, which shows how well such a model can reproduce the complex observations (for details see F05). At the bottom left we show the normalized s1 vs. s3 term. A negative slope in this diagram shows that the velocity field indicates the presence of a bar, and not a warped disk.
Another galaxy with strong non-axisymmetric gas motions in the central regions is M 100 (NGC 4321). Knapen et al. (2000b) present an H image with strong streaming motions, and model it with a numerical model. Wong et al. (2004) perform a harmonic Fourier decomposition. In Allard et al. (2006) we show that the [OIII] map of M100 accurately reproduces the non-axisymmetric features, and that these features are also found in the stellar kinematics.
These two cases show that the SAURON data are well suited to measure bars, purely on the basis of the kinematics. The kinematics offer an easier way, as opposed to imaging, to measure the bar potential, and give usable results even in the presence of considerable dust extinction.
3 Stellar populations in the inner regions of M 100
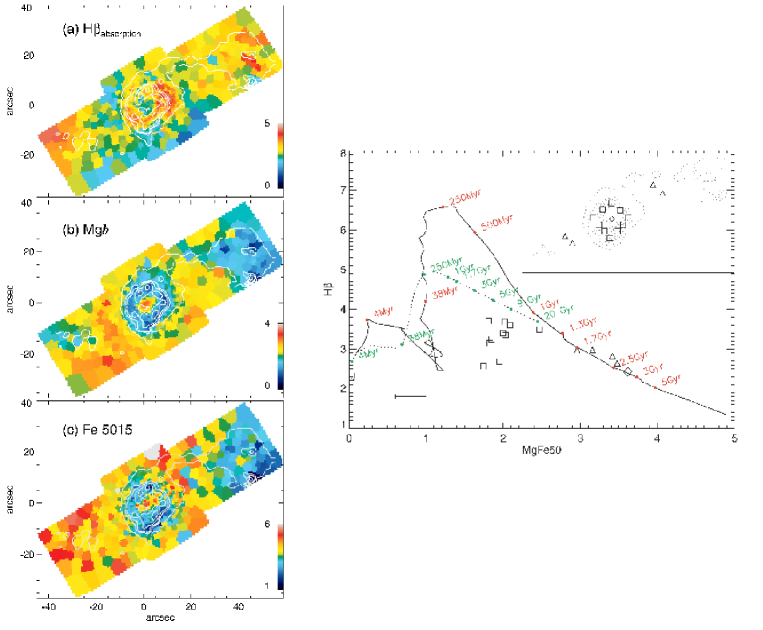
SAURON not only produces maps of emission lines, due to ionized gas, but also absorption line maps for some strong lines. In Fig. 2 we show H, Mg b and Fe 5015 lines, derived in the Lick system (Worthey et al. 1994). To obtain these maps, one has to remove the emission lines first (see Sarzi et al. 2006). The maps show that the center of M 100 is relatively old. Going outwards, a very young ring follows, after which there is a region with stars of about 108 years (see A06). On the right side of Fig. 2 we show several regions in and around the ring in a plot of MgFe50 (= ) against H, together with SSP models of Bruzual & Charlot (2003). In general, the models are able to fit the data. In some places in the star forming ring, however, at MgFe50 2Å SSPs are not able to explain the observations any more. Here a solution would be a mix of a 1.5 Gyr old stellar population and one of more younger bursts. Such a picture ties in extremely well with the theoretical and numerical understanding we have of the nuclear ring zone in M100 (Knapen et al. 1995). When one looks in detail, the youngest stellar populations are found at the contact points between the ring and the dust lanes. More detailed modelling of the stellar populations in this galaxy is done in A06.
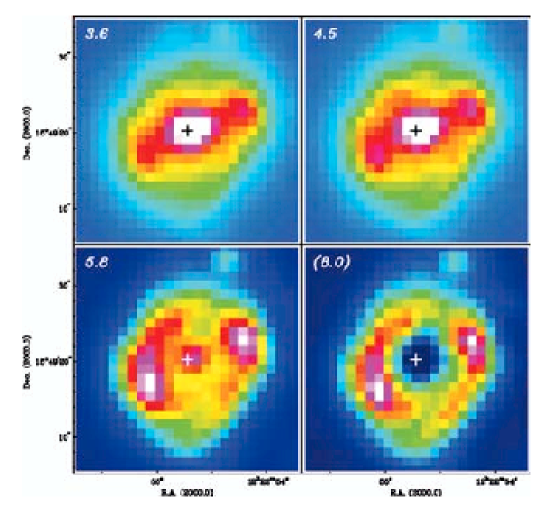
Another indication of how complex the stellar populations and the distribution of the interstellar matter in the inner regions of M 100 are, is shown in Fig. 3. Here we show Spitzer Space Telescope (SST) images at 4 different wavelengths. At the shorter wavelengths (3.6 and 4.5m) the maps look like the 2.2m map of Knapen et al. (1995), showing the nuclear part of the bar. These maps are relatively free of dust extinction. At larger wavelengths (5.8 and 8m) the emission comes mostly from tiny dust grains and polycyclic aromatic hydrocarbons (PAHs). These latter maps show especially the star formation regions, similar to the -band image of Knapen et al. (1995). A comparison of the exponential scale lengths of bulge and disk between several optical wavelengths and the 3.6 m gives almost identical values, reinforcing the conclusion by Beckman et al. (1996) that the galaxy does not contain much dust, except in localised areas.
4 Discussion and Conclusions
In the previous sections we have shown two applications of integral field spectroscopy aimed at understanding the nature of the central regions of spiral galaxies. We show that, in contrast to long slit spectroscopy, we can detect streaming motions of the ionized gas, and use them to measure the potential. Although something similar can also be done from the photometry, there are more assumptions involved here, since one has to look through the dust, and make assumptions for M/L ratios as a fuction of position. In a galaxy like M100, where the stellar populations are strongly varying, estimating M/L purely from colours and absorption line strengths will not be easy at all. Up to now we have only analyzed the Sa galaxy NGC 5448 in detail. Once we have analyzed the full sample of Falcón-Barroso et al. (2006) we will be able to derive statistics on the number of bars, and their strengths, based for the first time on kinematic data. These statistics will be important, among other topics, in assessing whether AGN activity is related to the presence of bars (e.g., Shlosman et al. 1989).
In the second application we show line strength maps of a galaxy with a circumnuclear ring. Since most Sb galaxies are very dusty in their inner regions one cannot learn too much from broad band colours, unless the galaxy has a special orientation (e.g., Peletier et al. 1999). From three line strength maps we find that the galaxy has zones with different ages. In the ring itself we show that apart from the young stars there is also an underlying old stellar population. M 100 is a beautiful case where many phenomena can be seen that play a role in the inner regions of spiral galaxies. The outer and inner parts of its bar have been detected both in near-IR (ground-based and Spitzer) photometry and in the gas kinematics, and a ring separating the two. Abundant star formation occurs within and near the ring, with 2 hot spots at the end of the inner bar. Young stars are formed where the velocity dispersion of the gas is low (Allard et al. 2005). At present we are studying the stellar populations of the sample of Sa galaxies of Falcón-Barroso et al. (2006) in the same way. Many galaxies of that sample show young stellar populations in circumnuclear rings or disks, showing that for most galaxies the central regions are not dominated by a bright, old stellar bulge. More details can be found in Peletier et al. (in preparation).
References
- Allard et al. (2005) Allard, E. L., Peletier, R. F., & Knapen, J. H. 2005, ApJl, 633, L25
- Allard et al. (2006) Allard, E. L., Knapen, J. H., Peletier, R. F., & Sarzi, M. 2006, MNRAS, 867
- Athanassoula (1992) Athanassoula, E. 1992, MNRAS, 259, 345
- Beckman et al. (1996) Beckman, J. E., Peletier, R. F., Knapen, J. H., Corradi, R. L. M., & Gentet, L. J. 1996, ApJ, 467, 175
- Bruzual & Charlot (2003) Bruzual, G., & Charlot, S. 2003, MNRAS, 344, 1000
- Eskridge et al. (2000) Eskridge, P. B., et al. 2000, AJ, 119, 536
- Falcón-Barroso et al. (2006) Falcón-Barroso, J., et al. 2006, MNRAS, 369, 529
- Fathi et al. (2005) Fathi, K., van de Ven, G., Peletier, R. F., Emsellem, E., Falcón-Barroso, J., Cappellari, M., & de Zeeuw, T. 2005, MNRAS, 364, 773
- Freeman (1965) Freeman, K. C. 1965, MNRAS, 130, 183
- Knapen et al. (1995) Knapen, J. H., Beckman, J. E., Shlosman, I., Peletier, R. F., Heller, C. H., & de Jong, R. S. 1995, ApJl, 443, L73
- Knapen et al. (2000) Knapen, J. H., Shlosman, I., & Peletier, R. F. 2000a, ApJ, 529, 93
- Knapen et al. (2000) Knapen, J. H., Shlosman, I., Heller, C. H., Rand, R. J., Beckman, J. E., & Rozas, M. 2000b, ApJ, 528, 219
- Krajnović et al. (2006) Krajnović, D., Cappellari, M., de Zeeuw, P. T., & Copin, Y. 2006, MNRAS, 366, 787
- Peletier et al. (1999) Peletier, R. F., Balcells, M., Davies, R. L., Andredakis, Y., Vazdekis, A., Burkert, A., & Prada, F. 1999, MNRAS, 310, 703
- Sarzi et al. (2006) Sarzi, M., et al. 2006, MNRAS, 366, 1151
- Schoenmakers et al. (1997) Schoenmakers, R. H. M., Franx, M., & de Zeeuw, P. T. 1997, MNRAS, 292, 349
- Shlosman et al. (1989) Shlosman, I., Frank, J., & Begelman, M. C. 1989, Nature, 338, 45
- Wong et al. (2004) Wong, T., Blitz, L., & Bosma, A. 2004, ApJ, 605, 183
- Worthey et al. (1994) Worthey, G., Faber, S. M., Gonzalez, J. J., & Burstein, D. 1994, ApJs, 94, 687
- (20)