On the Possibility of Identification of a Short/Hard Burst GRB 051103 with the Giant Flare from a Soft Gamma Repeater in the M81 Group of Galaxies
Abstract
The light curve, energy characteristics, and localization of a short/hard GRB 051103 burst are considered. Evidence in favor of identifying this event with a giant flare from a soft gamma repeater in the nearby M81 group of interacting galaxies is discussed.
1 Introduction
Observations of giant flares from SGR 1900+14 on August 27, 1998, and from SGR 1806-20 on December 27, 2004 renewed discussions of an old suggestion that some of short/hard gamma-ray bursts may represent initial pulses of giant flares from considerably more remote gamma repeaters (Mazets & Golenetskii, 1981; Mazets et al., 1982). The energy of the initial pulse of the giant flare from SGR 1806-20 was found of – erg, making it possible to estimate the maximum distance at which flares of this kind can still be revealed as short bursts to be 30–50 Mpc (Mazets et al., 2005; Hurley et al., 2005; Palmer et al., 2005; Terasawa et al., 2005; Mereghetti et al., 2005). Such estimates give reason to believe that giant flares can be detected not only in galaxies of the Local group, but also in nearby galaxies and clusters of galaxies, such as, e.g., clusters in Virgo, Ursa Major, Leo.
The available data on giant flares in three SGRs originated in the Milky Way outline the expected temporal and spectral characteristics of short gamma-ray bursts that could be indicative of a flare from another galaxy. Such a burst must have the shape of a single pulse with a steep leading edge ( 5–15 ms) and quasi-exponential decay with 50–70 ms at a total pulse width of 200–300 ms. Of course, such an idealized light curve will actually be distorted by noticeable faster fluctuations of the emission intensity. The energy spectrum of a burst must be rather hard in the initial part of the pulse and extend to 10–15 MeV. In the course of the burst, the spectrum rapidly evolves to become considerably softer by the end of the pulse. Although, at first sight, these specific features do not make cardinal differences from a wide variety of short/hard gamma-ray bursts observed, a closer inspection of the Konus catalog of short bursts accumulated in 1994–2002 (Mazets et al., 2002), suggests that the fraction of events with the characteristics specified does not exceed several percent of the total number of short bursts. Naturally, a decisive argument in favor of identification of the short burst with a giant remote flare would be that a galaxy with a redshift of is found in the region of its localization.
It is widely believed that neutron stars passing through the SGR stage are young. Their age estimated e.g. by the secular variation of the period, , does not exceed yr. In accordance with the assumption that the most probable candidates in a search for SGR are galaxies with a high rate of formation of massive stars, Popov and Stern (2006) subjected to a statistical analysis the BATSE data on short gamma-ray bursts. They concluded that the fraction of the possible extragalactic flares among the short bursts recorded by BATSE does not exceed several percent and the best target to search for giant flares is a cluster of galaxies in Virgo. Nakar et al. (2006) estimated the fraction of SGR flares relative to all short/hard bursts to be .
On November 3, 2005 the Konus-Wind gamma-burst spectrometer detected an intensive short/hard gamma-ray burst. The GRB 051103 was also observed by the spacecraft HETE-2 (FREGATE instrument), Mars Odyssey (GRS and HEND), Swift (BAT, outside the field of view), and RHESSI (PCA). As a result, this interplanetary network (IPN) localized the burst source. The center of the error box has coordinates , (J2000) (Golenetskii et al., 2005). The area of the error box (at the level) is 260 sq. arcmin. The localization area lies close to the M81 galaxy but does not overlap with its optical image. The box center is 21 arcmin away from the center of M81.
Lipunov et al. (2005) reported that the localization region definitely lies outside the spiral arms of the M81 galaxy, but noted that the structure of the galaxy is appreciably distorted by the tidal interaction. If GRB 051103 is not related to the flare in SGR, it would be expected, with a certain probability, that an optical transient (OT) should appear in the IPN box. A search for an OT has been performed, but yielded only the upper limit to its brightness: (Lipunov et al., 2005), (Klose et al., 2005), and (Ofek et al., 2005). A search for high-energy emission from the IPN box during a burst of length s was performed on the Milagro gamma-ray observatory. Also, only the upper limit to the integral fluence was obtained: erg cm-2 (0.25–25 TeV) (Parkinson, 2005). If only these results are considered, identification of GRB 051103 with the giant flare from an SGR in M81 seems to be hardly probable.
The group of close interacting galaxies M81 (D=3.6 Mpc), which includes several galaxies and about ten smaller stellar structures, has also been studied during many years by means of radio and X-ray astronomy. Results of these studies taken into account change the situation. There appear important arguments indicating that the probability of association of GRB 051103 with the M81 group is rather high. This evidence will be considered further in discussion.
2 Observations and localization
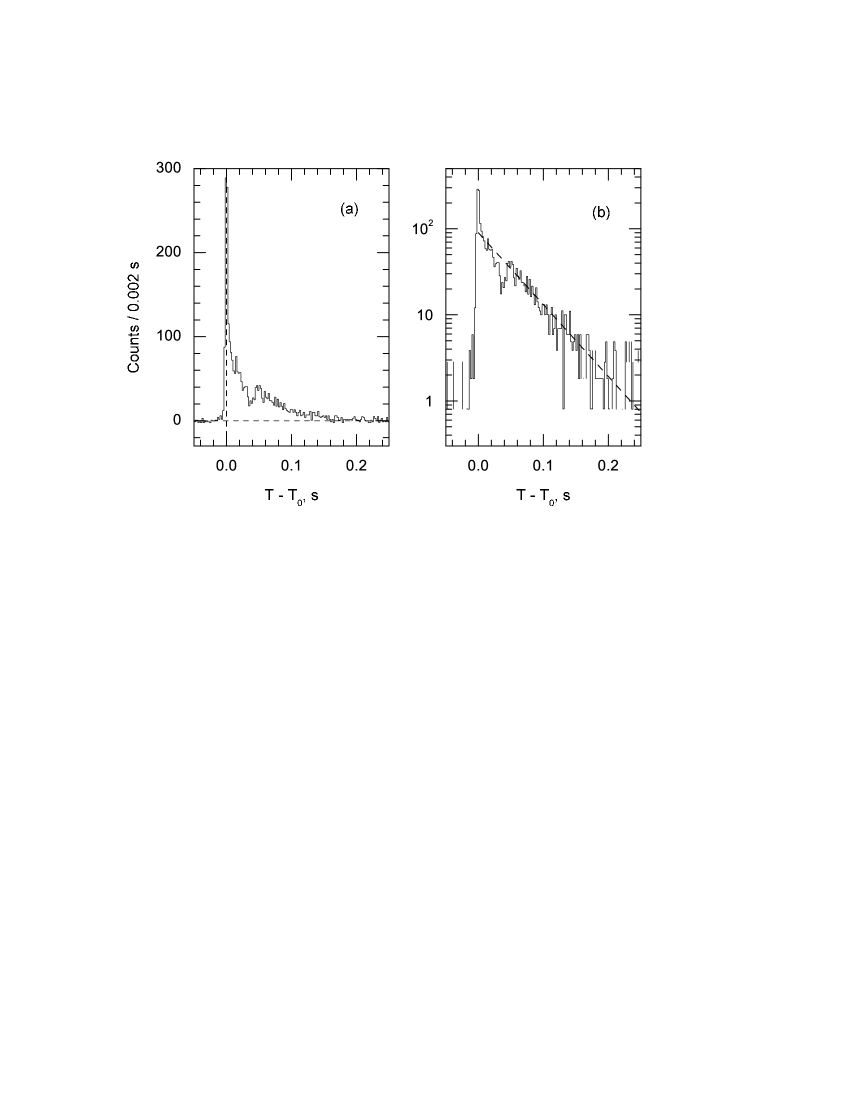
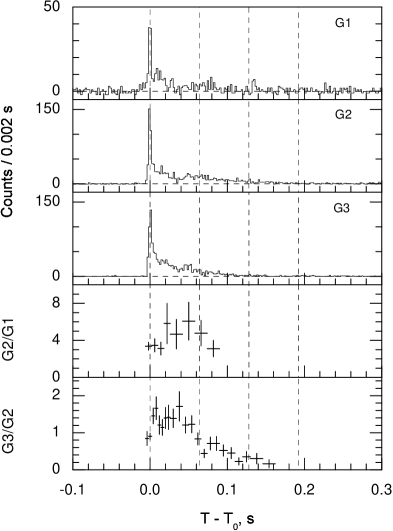
The light curve of GRB 051103, recorded in a wide range of energies (18–1100 keV) with a resolution of 2 ms, is shown in Fig. 1 in linear (a) and semilog (b) scales. The burst has the form of a single pulse with a steep leading edge ( ms) and a quasi-exponential decay ( ms). The total duration of the burst is ms. The time profiles for three energy windows, G1 (18–70 keV), G2 (70–300 keV), and G3 (300–1100 keV), and the hardness ratios G2/G1 and G3/G2 are shown in Fig. 2.
The variations of the hardness with time and especially the run of G3/G2 indicate that the spectrum shows a clearly pronounced evolution and rapidly becomes softer. In the course of a burst, three multichannel spectra were measured with an accumulation time of 64 ms for each spectrum. To improve a poor statistics of counts the weaker spectra 2 and 3 were summarized. The response matrix of the detector was calculated for the known incident angle of radiation. The photon spectra of the burst were obtained by fitting their intensity and shape to the instrumental energy loss spectra using XSPEC v. 11.3.
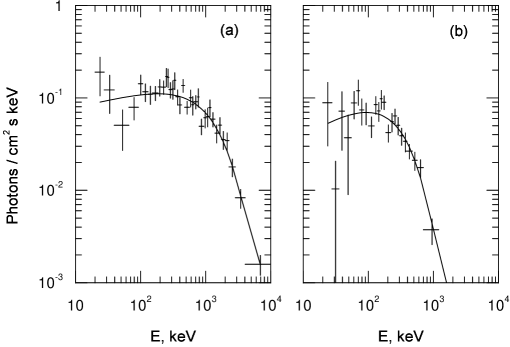
Spectrum 1 covers the most intense and hardest part of the burst. Emission is seen up to 10 MeV. The spectrum is well fit by a power-law distribution with an exponential cutoff , which transforms at high energies into a decaying power-law tail (Band model). The parameters have the following values:
Here and henceforth the errors in the parameters and energy estimates correspond to a confidence probability of 90%. It should be noted that, in contrast to the most of short/hard bursts, the spectra under consideration have . The peak energy of the spectrum, keV. The energy fluence for the time interval ms is erg cm-2. The 2-ms peak flux, erg cm-2 s-1.
The sum spectrum (2+3) characterizes the final stage of the burst. Emission is observed up to MeV. The spectrum is well described by a power-law model with an exponential cutoff (Fig. 3b) with , (), keV. The fluence in the interval 65–192 ms is erg cm-2.
With account taken of the radiation arrived before (Fig. 1) and on the assumption that the spectrum of this radiation is close to spectrum 1, the total fluence of the whole burst is erg cm-2.
For triangulation of the source of GRB 051103 the positions of the most remote spacecraft Mars Odyssey and Wind spacecraft (distance from the Earth 1.6 million kilometers), and the position of near-Earth orbiting Swift spacecraft were chosen as the main vertices of IPN. The choice among the two alternative localization regions, represented by intersections of the triangulation rings of Mars Odyssey and Wind–Swift was based on the fact that the S2 detector on Wind, which recorded the burst, scans the northern hemisphere over the ecliptic. Data of other near-Earth spacecraft, HETE-2 and RHESSI confirm this localization.
The coordinates of the center and corners of the error box are listed in Table 1.
3 Discussion
The near group of galaxies M81 is constituted by six principal members with luminosities of to (Yun et al., 1999). The central part of the group is represented by three galaxies: M81, M82, and NGC 3077. The M81 group has been intensively studied during many years. While observations in the visible band gave only little sign of tidal interactions in this group, studies by VLA at a wavelength of 21 cm yielded convincing evidence of the strong influence of tidal forces on the structure of the group (Yun et al., 1999). Yun et al. (1994) discovered that the three central components of the M81 group are embedded in a cloud of atomic hydrogen with a mass of . About one fourth of this mass is distributed in the space between the galaxies in the form of filaments, spirals, and bridges connecting the galaxies. The complex structure of the distribution of densities and radial velocities of HI was formed upon a close approach of galaxies, accompanied by intensive disintegration of their outer regions by the tidal interaction. Yun et al. (1999) performed a numerical modeling of the galaxy interaction within the capabilities of the restricted three-body problem. According to this simulation, the galaxies collided about 300 million years ago. The disks and gas envelopes of the less massive galaxies NGC 3071 and M82 suffered the strongest disruptions and years ago correspondingly. These estimates are in an agreement with the other available estimates of the time when star formation processes were enhanced in disintegrated regions.
Irregular dwarf galaxies, most probably of tidal origin, have been observed in the maximum-density HI regions. Makarova et al. (2002) using the Hubble Space Telescope obtained color–magnitude diagrams for four dwarf galaxies Holm IX, BKN3, Arp-loop, and Garland. Main sequence stars, bright blue stars, red supergiants, and red giants are represented in these diagrams in various ratios. A study of the diagrams demonstrated that the process of star formation at a rate of – yr-1 occurred in the time interval from 20 to 200 million years ago. It is natural to assume that stars were also formed, even though at a lower rate, in other, less dense HI regions.
Sun et al. (2005) performed a deep spectral survey of the integral stellar emission in the region M81/M82/NGC 3077. They discovered a widely distributed stellar population in the space between the galaxies. The distribution of the emission intensity follows the structure of atomic hydrogen clouds. The emission spectra of this stellar population are the same to the east and west of M81 and to the south of M82. This may mean that either the stars had belonged to the disk of M82 destroyed upon close approach to M81 several hundred million years ago or were formed in dense HI regions.
The Chandra X-ray observatory performed a survey of the M81 galaxy and its close vicinity (Swartz et al., 2003). As a result, 177 X-ray sources were discovered, which mainly are accreting binary systems with a luminosity erg s-1. Most of these sources lie within the disk of M81, and about one third of sources lie outside the isophote and fourteen ones of them fall within the IPN box. There are four sources which coincide with supernova remnants in the disk of M81 and one with the supernova SN1993J. It should be noted that SGR in the Galaxy are being intensively studied as persistent sources of soft X-ray radiation, with luminosities of – erg s-1 (Göğüş et al., 2002; Mereghetti et al., 2006). Such a luminosity lies below the threshold of sensitivity of the Chandra observatory in the survey of M81.
Thus, all the data presented above definitely indicate that apart from massive atomic hydrogen clouds, in the space between the M81, M82, and NGC 3077 galaxies a widespread stellar population exists, including neutron stars. It is quite probable that the formation of a larger part of these stars was induced by a close approach of the galaxies about 300 million years ago.
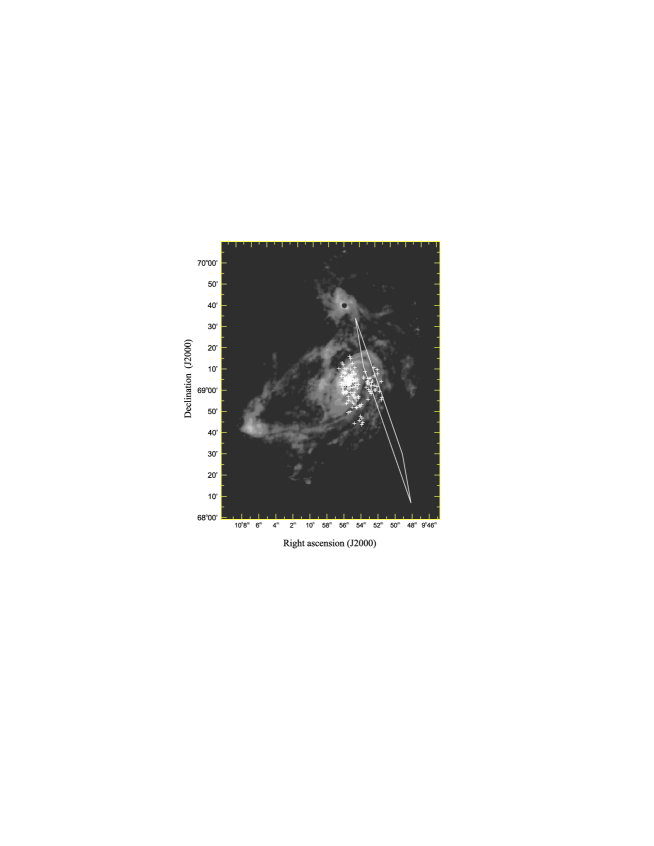
Figure 4 shows the 21-cm map111See Yun, www.astro.umass.edu/myun/m81hi.html of the M81/M82/NGC 3077 group, on which the IPN box of GRB 051103 (Golenetskii et al., 2005) is overplotted and the positions of the X-ray sources discovered in the M81 galaxy and its vicinity (Swartz et al., 2003) are marked. The figure clearly demonstrates that the IPN box envelops the region that contains a considerable fraction of the intergalactic HI and intergalactic stellar population of M81. This eliminates the main objections to the possible association of the GRB 051103 burst with the giant flare in the M81 group of galaxies and strongly enhances the plausibility of this association. If the flare is emitted by a soft gamma repeater in the M81 group, its energy will come to erg. This value exceeds the flare energy in SGR 1806-20 by only a factor of 2–3.
To draw more decisive conclusions, additional studies of IPN box area in the optical, X-ray, and radio wave bands are necessary.
References
- Göğüş et al. (2002) Göğüş, E., et al. 2002, ApJ, 577, 929
- Golenetskii et al. (2005) Golenetskii, S., et al. 2005, GCN Circ. 4197
- Hurley et al. (2005) Hurley, K., et al. 2005, Nature, 434, 1098
- Klose et al. (2005) Klose, S., et al. 2005, GCN Circ. 4207
- Lipunov et al. (2005) Lipunov, V., et al. 2005, GCN Circ. 4206
- Makarova et al. (2002) Makarova, L.N., et al. 2002, A&A, 396, 473
- Mazets & Golenetskii (1981) Mazets, E.P., & Golenetskii, S.V. 1981, Ap&SS, 75, 47
- Mazets et al. (1982) Mazets, E.P., Golenetskii, S.V., Guryan, Yu.A., & Ilyinskii, V.N. 1982, Ap&SS, 84, 173
- Mazets et al. (2002) Mazets, E.P., et al. 2002, astro-ph/0209219
- Mazets et al. (2005) Mazets, E.P., et al. 2005, astro-ph/0502541
- Mereghetti et al. (2005) Mereghetti, S., et al. 2005, ApJ, 624, L105
- Mereghetti et al. (2006) Mereghetti, S., Esposito, P., & Tiengo A. 2006, Ap&SS, in press, astro-ph/0608364. v.1
- Nakar et al. (2006) Nakar, E., et al. 2006, ApJ, 640, 849
- Ofek et al. (2005) Ofek, E.O., et. al. 2005, GCN Circ. 4208
- Palmer et al. (2005) Palmer, D.M., et al. 2005, Nature, 434, 1107
- Parkinson (2005) Parkinson, P.S. 2005, GCN Circ. 4249
- Popov & Stern (2006) Popov, S.B., & Stern, B.E. 2006, MNRAS, 365, 885
- Sun et al. (2005) Sun, W.-H., et al. 2005, ApJ, 630, L133
- Swartz et al. (2003) Swartz, D.A., Ghosh, K.K., & McCollough, M. L. 2003, ApJS, 144, 213
- Terasawa et al. (2005) Terasawa, T., et al. 2005, Nature, 434, 1110
- Yun et al. (1994) Yun, M.S., Ho, P.T.P., & Lo, K.Y. 1994, Nature, 372, 530
- Yun et al. (1999) Yun, M.S., 1999, Proc. of IAU Symp. 186, Galaxy Interactions at Low and High Redshifts, ed. J.E. Barnes, & D.B. Sanders (Dordrecht: Kluwer), 81
| RA (J2000) | Dec (J2000) | |
|---|---|---|
| Box center | ||
| Corners 1 | ||
| 2 | ||
| 3 | ||
| 4 |