On the Origin of the Type Ia Supernova Width-Luminosity Relation
Abstract
Brighter Type Ia supernovae (SNe Ia) have broader, more slowly declining -band light curves than dimmer SNe Ia. We study the physical origin of this width-luminosity relation (WLR) using detailed radiative transfer calculations of Chandrasekhar mass SN Ia models. We find that the luminosity dependence of the diffusion time (emphasized in previous studies) is in fact of secondary relevance in understanding the model WLR. Instead, the essential physics involves the luminosity dependence of the spectroscopic/color evolution of SNe Ia. Following maximum-light, the SN colors are increasingly affected by the development of numerous Fe II/Co II lines which blanket the -band and, at the same time, increase the emissivity at longer wavelengths. Because dimmer SNe Ia are generally cooler, they experience an earlier onset of Fe III to Fe II recombination in the iron-group rich layers of ejecta, resulting in a more rapid evolution of the SN colors to the red. The faster -band decline rate of dimmer SNe Ia thus reflects their faster ionization evolution.
Subject headings:
radiative transfer – supernovae; cosmology1. Introduction
Although normal Type Ia supernovae (SNe Ia) are generally considered a homogeneous class, they nevertheless show substantial ( mag) variations in luminosity at peak. The use of SNe Ia for cosmology measurements thus relies on empirical calibration techniques. Most common among these is the width-luminosity relation (Phillips et al., 1999). Bright SNe Ia generally have broad -band light curves (LCs) which decline slowly after peak. Dimmer SNe Ia have narrower, more quickly declining LCs.
Understanding the physical origin of the width-luminosity relation (WLR) is a primary goal of the theory and modeling of SNe Ia. Unfortunately, a full theoretical description of the SN Ia explosion mechanism is still lacking. Normal SNe Ia are widely believed to be the thermonuclear disruption of carbon-oxygen white dwarfs near the Chandrasekhar limit, however a number of uncertainties remain regarding the structure of the progenitor, the precise ignition conditions, and the physics of the turbulent nuclear combustion that unbinds the star.
Fortunately, these uncertainties need not be fully resolved in order to study the WLR. In SN Ia explosions, hydrodynamic and nuclear burning processes last only minute. The subsequent luminosity is powered entirely by the decay of radioactive elements synthesized in the explosion, in particular in the decay chain . The LCs of SNe Ia are therefore fully determined by the composition and density structure of the material ejected in the explosion. Naturally, the mass of produced () is the primary determinate of the peak brightness of the event. Observations indicate that for normal objects, spans the range , with a typical value .
The challenge thus falls to radiative transfer theory to explain why SNe Ia with larger also have broader -band LCs. Most previous transfer studies have emphasized diffusion arguments of one sort or another (Höflich et al., 1996, 2002; Pinto & Eastman, 2001; Mazzali et al., 2001). In SNe Ia, the ejecta remain optically thick for the first several months after explosion. The width of the bolometric LC is related to the time scale for photons to escape the ejecta by diffusion. In principle, the WLR could be explained if brighter SNe Ia have higher effective opacities and hence a longer diffusion time. Different authors have invoked different physical arguments to motivate this sort of opacity dependence (see §2).
In this paper, we stress that the WLR does not in fact hinge on the bolometric diffusion time, but is instead principally a broadband phenomenon. In particular, the -band LC depends sensitively on the rate at which the SN colors evolve progressively redward following maximum light. Dimmer SNe Ia exhibit a faster color evolution than brighter SNe Ia; this turns out to be a primary reason for their relatively faster -band decline rates. A relevant theoretical explanation of the WLR should therefore focus on the effect has on the spectroscopic/color evolution of SNe Ia, rather than on the overall diffusion time-scale.
In what follows, we use realistic time-dependent multi-group radiative transfer calculations to explain the physical origin of the WLR in a set of Chandrasekhar-mass SN Ia models. We demonstrate that the faster color evolution of dimmer models reflects their faster ionization evolution. Following maximum-light, the SN colors are increasingly affected by the development of numerous Fe II/Co II lines which blanket the -band and, at the same time, increase the emissivity at longer wavelengths. Because dimmer SNe Ia are generally cooler, they experience an earlier onset of Fe III to Fe II recombination in the iron-group rich layers of ejecta, resulting in a more rapid evolution of the SN colors to the red. This explains their faster -band decline rate.
2. Previous Theoretical Studies
Previous radiative transfer studies of SNe Ia have occasionally reproduced the basic trend of the WLR among sets of models with varying . In these studies, the model relation is typically explained by claiming a strong luminosity dependence of the diffusion time. To the extent that the transfer calculations include the relevant multi-wavelength processes, color evolution effects are also captured in the simulations as a matter of course. Sometimes their relevance to the WLR is explicitly recognized and quantified (e.g., Mazzali et al., 2001).
Using simple dimensional arguments, one can show that the photon diffusion time (and hence bolometric LC width) scales with mean opacity as . In SNe Ia, the dominant opacities are due to electron scattering and bound-bound line transitions, the latter of which is enhanced by Doppler broadening in the differentially expanding ejecta. Iron group species (iron, cobalt, and nickel) have the largest line opacity, due to their complex atomic structure. The iron group line opacities increases sharply to the blue, due to the larger number of lines at shorter wavelengths.
At least three different (though related) arguments have been given as to why (and hence the diffusion time) should increase with , each emphasizing a different physical mechanism.
Höflich et al. (2002, see also ()) emphasize the temperature dependence of the diffusion time. Because SNe Ia with larger have higher temperatures, the bulk of the radiation energy is concentrated at shorter wavelengths. Since the line opacity increases sharply to the blue, the effective mean opacity (and hence the diffusion time) increases with .
Pinto & Eastman (2001, see also ()) emphasize the effect of the ionization state on the diffusion time. They argue that is largely determined by the rate at which blue/ultraviolet photons fluoresce to longer wavelengths via interaction with iron group elements, thereby enhancing photon escape. They suggest that fluorescence is more efficient in singly, as opposed to doubly ionized species. Because SNe Ia with lower are cooler and less ionized, the diffusion time is shorter.
Mazzali et al. (2001) emphasize the effect of the ejecta composition on the diffusion time. SNe Ia with large have a greater abundance of iron group elements, and thus presumably larger opacities.
In fact, all three of the above mentioned diffusion effects must be operative at some level in the LCs of SNe Ia. The magnitude of the effects (in sum) can be quantified by direct examination of the model bolometric LCs. If diffusion time arguments are indeed of prime relevance in explaining the WLR, it follows that the bolometric LCs of brighter models must be significantly broader than those of dimmer models. However, in the previous studies this bolometric behavior is not explicitly demonstrated using detailed multi-group transfer calculations and realistic opacities.
In the following, we present a set of model calculations in which the shape of the bolometric LCs in fact shows very little direct dependence on . Variations in the diffusion time are therefore of secondary relevance in addressing the -band WLR. Instead, the model WLR primarily reflects the faster spectroscopic/color evolution of SNe Ia with lower . It is therefore of fundamental importance (and a primary goal of this paper) to explain in detail the physics controlling the rate of color evolution in SNe Ia.
Because the flux mean opacity itself depends on the spectral energy distribution of the radiation field, the physics controlling the color evolution of SNe Ia is of course deeply intertwined with that determining the diffusion time. In the end, however, the relative importance of each can be quantified by comparing the strength of the WLR in the broadband versus the bolometric LCs of SNe Ia. We suggest below that such an analysis may be very useful in furthering our understanding of SNe Ia.
| 0.70 | 15.56 | 19.34 | -19.46 | -19.34 | -19.35 | 0.81 | 1.09 | 0.72 | 0.83 | -0.017 | 0.568 |
| 0.63 | 15.55 | 19.00 | -19.36 | -19.25 | -19.27 | 0.82 | 1.17 | 0.77 | 0.84 | -0.007 | 0.621 |
| 0.56 | 15.54 | 18.70 | -19.24 | -19.14 | -19.18 | 0.83 | 1.28 | 0.82 | 0.88 | 0.011 | 0.693 |
| 0.49 | 15.56 | 18.36 | -19.11 | -19.02 | -19.08 | 0.84 | 1.38 | 0.86 | 0.91 | 0.034 | 0.750 |
| 0.42 | 15.52 | 17.85 | -18.96 | -18.87 | -18.97 | 0.84 | 1.45 | 0.92 | 0.94 | 0.057 | 0.802 |
| 0.35 | 15.51 | 17.22 | -18.78 | -18.71 | -18.83 | 0.84 | 1.53 | 0.98 | 0.96 | 0.089 | 0.851 |
3. Models
In a companion paper (Woosley et al., 2006, hereafter Paper I), we perform an extensive parameter study of SN Ia LCs using 1-dimensional (1D) hydrodynamical models of the explosion. Here we focus on a restricted set of those models in order to demonstrate the basic transfer physics underlying the WLR. Each model is a derivative of the spherical Chandrasekhar mass explosion model, M070103, which has a four zone stratified compositional structure. From the center out, these zones consist of: 0.1 of stable iron group elements; 0.7 of ; 0.3 of intermediate mass elements (IMEs; silicon,sulfur, calcium, argon); and 0.3 of unburned carbon/oxygen. Mild mixing is applied at the zone interfaces. The synthetic LCs and spectral time-series of model M070103 are in good agreement with observed normal SNe Ia (Paper I).
A simple prescription is used to vary the abundance in model M070103, allowing us to isolate the effect of on the LCs. New models are constructed by reducing the abundance of everywhere by a fractional amount (viz., and %) while increasing the abundance of IMEs by a corresponding amount. This amounts to a variation of from 0.35 to 0.7 while maintaining a fixed velocity distribution of . Because the energy released in burning to IMEs is comparable to burning to , the dynamics of the explosion will not be greatly affected by the compositional change. The ejecta structures bear resemblance to some 1D delayed-detonation or pulsed-detonation models (Höflich et al., 1995).
We compute synthetic LCs of the models using the multi-dimensional time-dependent Monte Carlo radiative transfer code SEDONA (Kasen et al., 2006). Given a homologously expanding SN ejecta structure, SEDONA calculates the emergent spectral time series at high wavelength resolution. Broadband LCs are then constructed by convolving the spectra with the appropriate filter transmission functions. The code includes a detailed gamma-ray transfer procedure to determine the rate of radioactive energy deposition, and a radiative equilibrium solution of the temperature structure. No ad-hoc inner boundary condition is employed. Ionization and excitation are computed assuming local thermodynamic equilibrium, and bound-bound line transitions are treated using the expansion opacity formalism and an approximate two-level atom approach to wavelength redistribution, assuming a constant redistribution probability for all lines. We have used SEDONA to recalculate the broadband LCs of the scaled models used to study the WLR in Pinto & Eastman (2001) and found excellent agreement with the results presented there. See Kasen et al. (2006) for a detailed code description and verification.
4. Origin of the Width-Luminosity Relation
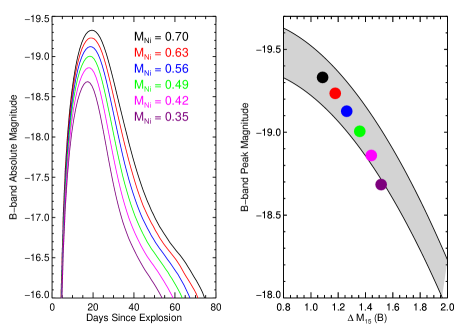
The WLR is often quantified as a relation between peak -band magnitude, , and the drop in -band magnitude 15 days after peak, . Table 1 lists the relevant observable parameters of the synthetic LC models discussed in the previous section. In the models, the variation of from 0.35 to 0.70 results in a variation in from -18.71 to -19.34 mag, and in from 1.53 to 1.09 mag. As seen in Figure 1, the models obey a clear WLR, with a slope that agrees reasonably (though not exactly) with the observed one of Phillips et al. (1999).
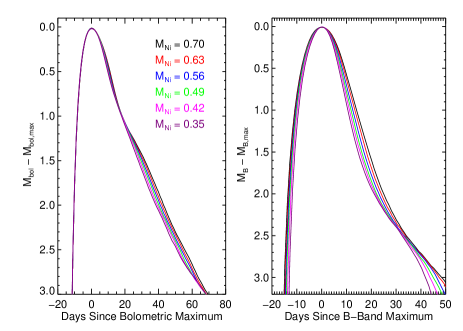
The model WLR obtained in Figure 1 is not attributable to a strong systematic dependence of the diffusion time on , as emphasized in previous studies. On the contrary, the bolometric rise time to maximum and the bolometric decline rate are similar among all models: days, mag. As seen in Figure 2, differences in the bolometric LCs are maximal (though still modest) when measured 30 days after -maximum: mag. Thus, in this set of models, the luminosity dependence of the diffusion time is in fact of secondary relevance in understanding the WLR.
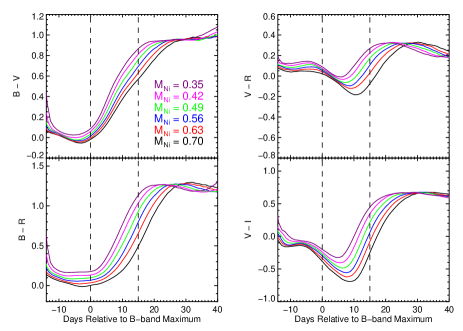
Instead, we identify the crucial physical effect to be that of on the spectroscopic/color evolution of the models. As seen in Figure 3, all models have very similar colors at -band maximum, with and within and mag. Thereafter, the color curves diverge, with the dimmer models evolving redward more rapidly. By 15 days after -maximum, differences in and color have grown to nearly 0.3 and 0.6 mag respectively. It is this faster color evolution of the dimmer models that accounts for their larger .
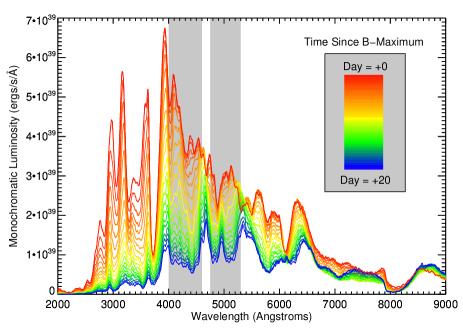
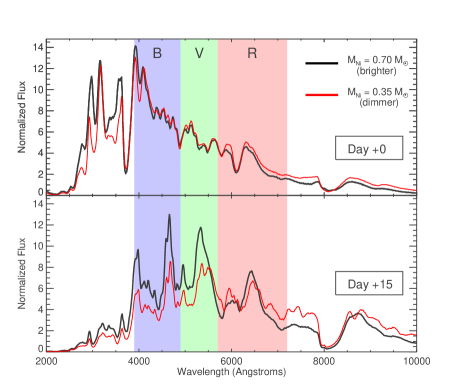
The origin of this color evolution behavior can be traced directly to the impact of iron-group lines on the post-maximum spectra. Soon after maximum light, the -band is increasingly affected by the development of Fe II/Co II lines (Figure 4). Especially prominent are the strong absorption blends at wavelengths 4000-4600 Å and 4800-5300 Å, however a pseudo-continuum of numerous weaker lines also contribute to the overall line blanketing in the blue. At the same time, a large number of blended Fe II/Co II lines emerge in the far red and near-infrared, enhancing the pseudo-continuum emissivity at these wavelengths (Kasen, 2006). The net effect of the onset of the Fe II/Co II lines is thus to redistribute flux absorbed in the blue part of the spectrum to longer wavelengths. Naturally, the rate at which these lines develop plays a critical role in determining the color evolution (and hence -band decline rate) of SNe Ia.
In general, Fe II/Co II lines become prominent once the layers of ejecta rich in (since decayed to iron/cobalt) begin to recombine from doubly to singly ionized, a process which occurs quite suddenly at temperature K. For the epochs at and before -band maximum, the iron/cobalt-rich layers of ejecta ( ) have K and Fe II/Co II lines are weak or absent in all model spectra (see Figure 5; top panel). At these times, the optical continuum is pseudo-blackbody and the spectral and color differences among the models are minor, even when is varied by a factor of two. The brighter/broader SNe Ia have a bluer color, but by a relatively small amount, as noted in observations (Phillips et al., 1999).
In the weeks following maximum light, however, the layers of iron-rich ejecta progressively cool to K and, as these layers recombine, the Fe II/Co II lines become steadily stronger. The exact rate at which the lines develop depends sensitively on the overall ejecta temperature scale. Models with lower have generally lower temperatures and hence an earlier onset of Fe III to Fe II recombination. As seen in Figure 5 (bottom panel) by 15 days after maximum the line blanketing is much stronger (and the colors much redder) in the lower model. The larger of the dimmer model thus reflects the more rapid development of the Fe II/Co II lines.
To be clear, the WLR is not merely a consequence of the generally redder colors of dimmer SNe Ia, but rather of the faster rate at which the colors evolve in these objects. In considering this spectroscopic effect, it is useful to keep in mind that the temperature differences among normal SNe Ia are expected to be rather small. The ejecta temperature (as determined by the balance of radiative heating and cooling) scales with luminosity as and hence . A factor of two difference in therefore amounts to only a difference in temperature. If the SN spectrum is reasonably characterized by a blackbody, the corresponding variations in or color would be relatively small ( mag). Indeed, this is essentially why the pre-maximum and maximum light colors of normal SNe Ia show only a mild dependence on .
In the post-maximum epochs, however, the SN Ia spectrum increasingly deviates from blackbody due to the burgeoning strength of the Fe II/Co II lines. The strength of these lines depends very sensitively on the ionization state. The ionization in turn obeys an extremely non-linear dependence on temperature, undergoing sudden recombination at K. Thus, in the post-maximum epochs, small differences in temperature translate to large differences in and color. The onset of this non-linear behavior is why the decline rate offers a good diagnostic of the SN temperature scale, and hence luminosity. Other approaches to calibrating SNe Ia, such as the CMAGIC method (Wang et al., 2003) and the correlation (Wang et al., 2005) are likewise explained by the same strong dependence of the SN colors on the ionization state during the weeks following maximum light.
At around 30 days after -maximum, the iron group layers of ejecta finish completely recombining from doubly to singly ionized. From this time on, differences in the ionization state among the models cease to be of great significance. The color curves reconverge and the models enter a phase of nearly identical color evolution (see Figure 3). The same general behavior is noted in the observations (Lira, 1996; Phillips et al., 1999). For this reason, the decline rate measured over longer time periods (e.g., ) provides a less sensitive measure of the model peak magnitude.
5. Relevance To Observations
The observed color evolution of SNe Ia bears a striking similarity to the model behavior of Figure 3 (e.g., Wang et al., 2005, Figure 1). Normal SNe Ia display fairly uniform colors at maximum light; thereafter the dimmer objects become redder more quickly. The observed differences in color at day are comparable to the differences in .
Folatelli (2004) quantifies the spectral evolution of SNe Ia directly using equivalent width measures. His approach nicely illustrates the sudden growth of Fe II/Co II features (there labeled “Mg II”) in the -band beginning just after maximum light. The rate at which these features develop is shown to correlate tightly with . Such analyses clearly point to the spectroscopic nature of the WLR.
The construction of bolometric LCs from observations of SNe Ia can be used to further explore this issue. If the luminosity dependence of the diffusion time is in fact central to explaining the WLR, one expects to observe a strong width luminosity relation in the bolometric LCs of SNe Ia. It is currently unclear from the limited observational sample whether such a relation exists at all. Phillips et al. (2006), for example, construct bolometric LCs from - and (when available) -band observations of 15 SNe Ia. The bolometric decline rates of the sample show some degree of scatter, but no clear correlation with the peak bolometric magnitude .
The bolometric LC constructions of Contardo et al. (2000), which use primarily -band observations, do show a noisy correlation between and (see also Stritzinger et al., 2006). This correlation, however, may in large part reflect the lack of ultraviolet and near-infrared (NIR) data used in the bolometric constructions. At day 15 after -maximum, for example, 20% or more of the SN Ia flux may occur at NIR wavelengths (Suntzeff, 2003). As the NIR contribution at day 15 is relatively greater in the dimmer SNe Ia, constructions may systematically overestimate the value of for dimmer objects by as much as mag. This behavior is seen in our models (Table 1) where one notes that exhibits a much stronger dependence on than does the true bolometric decline rate . In fact, the slope of our model WLR agrees fairly well with the empirical one of Contardo et al. (2000), suggesting that the observed correlation reflects, in large part, the role of color evolution.
Clearly the construction of true bolometric LCs for a sample of SNe Ia using UV through -band observations would be of great value in constraining the radiative transfer in SNe Ia. In the specific models studied in this paper, differences in the bolometric LCs are relatively small, and attributable to the reduction in flux mean opacity which accompanies the onset of Fe II/Co II lines (Pinto & Eastman, 2001; Kasen, 2006). The bolometric differences become most prominent around 30 days after -maximum, when the brighter models show a slight rise to a secondary bolometric maximum. Differences in diffusion time may therefore be somewhat more relevant in formulations of the WLR employing later time data.
The bolometric LCs of SNe Ia may also depend sensitively on the ejecta kinetic energy and the radial distribution of (see Paper I). By varying these two other parameters, it is possible to construct sets of models that show greater or lesser degrees of scatter and/or correlation in the bolometric WLR. In addition, NLTE effects (not included here) may also contribute to a stronger luminosity dependence of the bolometric LCs, especially if the probability of wavelength redistribution in lines is strongly temperature dependent. Such issues will be the subject of future studies. However, because the rate of color evolution dominates the -band decline rate, the WLR should remain a robust luminosity calibration even when the bolometric LCs of SNe Ia show significant random variations.
The bolometric rise time to maximum is the same for all models in this paper: days. The -band rise time (), on the other hand, depends on the color evolution. Because iron group recombination occurs earlier in lower models, their colors begin evolving redward at earlier epochs. Thus, in both models and observations, the dimmer SNe Ia exhibit a shorter .
Because Fe II/Co II line blanketing generally increases to the blue, the WLR will usually be stronger in bluer wavelength bands. The -band, for instance, is impacted by the development of Fe II/Co II lines to a lesser extent than the -band. This leads, in both models and observations, to a slower -band decline rate and a weaker dependence of on the peak -band magnitude .
The -band decline rate also has an intimate connection to the double-peaked morphology of the far red and NIR LCs of SNe Ia. The flux absorbed in Fe II/Co II lines at blue wavelengths is redistributed to the red, eventually leading to a NIR secondary maximum (Pinto & Eastman, 2000b; Kasen, 2006). Naturally, in both models and observations, SNe Ia with faster -band decline rates have earlier NIR secondary maxima.
On the whole, one recognizes that the ionization evolution of iron group elements is the most significant physical factor in understanding SN Ia LCs and the WLR. The faster overall spectroscopic and photometric evolution of dimmer SNe Ia reflects, primarily, their faster ionization evolution.
In addition, the distribution of iron group elements in the ejecta can be identified as a crucial secondary parameter in the WLR. All models in this paper have substantial iron group abundance out to . If the iron group elements are mixed to yet higher velocities, the development of Fe II/Co II lines will be hastened and intensified. Thus, for given , enhancing the iron group abundance in the outer layers of ejecta increases the -band decline rate. The relatively low dispersion in the observed WLR suggests that normal SNe Ia exhibit limited variability in their iron group distributions. The physical origin of this regularity, however, can only be addressed by detailed first principle explosion modeling of SNe Ia.
Fortunately for future precision cosmology experiments, the radiative transfer effects identified in this paper can be used to monitor and limit deviations in the WLR. Variations in the velocity distribution of iron group elements, for example, can be constrained by measuring the Doppler-shifts of iron features in the SN Ia spectra. NIR observations provide additional indicators of the ionization evolution and iron group distribution in the ejecta (Kasen, 2006). Close inspection of well sampled color curves (or spectral time series) should reveal equivalent or improved calibration techniques and may be useful in quantifying subtle deviations from the standard evolution. These and related tests should be feasible with the data from ongoing observational campaigns, and will help to limit the intrinsic scatter or evolutionary biases potentially affecting SNe Ia cosmology experiments. With the aid of detailed transfer models such as those presented here, refinements to the calibration techniques need not rely on the fortuitous discovery of empirical correlations, but can be devised to reflect the essential physics of SN Ia light curves.
References
- Contardo et al. (2000) Contardo, G., Leibundgut, B., & Vacca, W. D. 2000, A&A, 359, 876
- Folatelli (2004) Folatelli, G. 2004, New Astronomy Review, 48, 623
- Höflich et al. (2002) Höflich, P., Gerardy, C. L., Fesen, R. A., & Sakai, S. 2002, ApJ, 568, 791
- Höflich et al. (1996) Höflich, P., Khokhlov, A., Wheeler, J. C., Phillips, M. M., Suntzeff, N. B., & Hamuy, M. 1996, ApJ, 472, L81+
- Höflich et al. (1995) Hoflich, P., Khokhlov, A. M., & Wheeler, J. C. 1995, ApJ, 444, 831
- Kasen (2006) Kasen, D. 2006, ApJ, 649, 939, (astro-ph/0606449)
- Kasen et al. (2006) Kasen, D., et al. 2006, ApJ, accepted (astro-ph/0606111)
- Khokhlov et al. (1993) Khokhlov, A., Mueller, E., & Hoeflich, P. 1993, A&A, 270, 223
- Lira (1996) Lira, P. 1996, Masters Thesis, 3
- Mazzali et al. (2001) Mazzali, P. A., Nomoto, K., Cappellaro, E., Nakamura, T., Umeda, H., & Iwamoto, K. 2001, ApJ, 547, 988
- Phillips et al. (1999) Phillips, M. M., Lira, P., Suntzeff, N. B., Schommer, R. A., Hamuy, M., & Maza, J. 1999, AJ, 118, 1766
- Phillips et al. (2006) Phillips, M. M., et al. 2006, AJ, 131, 2615
- Pinto & Eastman (2000a) Pinto, P. A., & Eastman, R. G. 2000a, ApJ, 530, 744
- Pinto & Eastman (2000b) —. 2000b, ApJ, 530, 757
- Pinto & Eastman (2001) —. 2001, New Astronomy, 6, 307
- Suntzeff (2003) Suntzeff, N. B. 2003, From Twilight to Highlight: The Physics of Supernovae, 183
- Stritzinger et al. (2006) Stritzinger, M., et al. 2006, A&A, 131, 2615
- Wang et al. (2003) Wang, L., Goldhaber, G., Aldering, G., & Perlmutter, S. 2003, ApJ, 590, 944
- Wang et al. (2005) Wang, X., Wang, L., Zhou, X., Lou, Y.-Q., & Li, Z. 2005, ApJ, 620, L87
- Woosley et al. (2006) Woosley, S., Kasen, D., Blinnikov, S., & Sorokina, E. 2006, ApJ, submitted.