MOST111Based on data from the MOST satellite, a Canadian Space Agency mission, jointly operated by Dynacon Inc., the University of Toronto Institute of
Aerospace Studies and the University of British Columbia with the assistance of the University of Vienna. DETECTS g-MODES IN THE LATE-TYPE Be STAR
CMi (B8Ve)
Abstract
The Microvariability and Oscillations of stars (MOST) satellite has detected low-amplitude light variations (1 mmag) in the Be star CMi (B8Ve). The observations lasted 41 days and the variations have typical periods days. We demonstrate that the dominant frequencies are consistent with prograde high-order g-modes of excited by the Fe-bump of opacity in an intermediate-mass () star with a nearly critical rotation period of 0.38 days. This is the first detection of nonradial g-mode pulsations in a Be star later than B6 leading to the possibility that pulsations are excited in all classical Be stars.
1 INTRODUCTION
Be stars are non-supergiant, rapid rotators, which at times show emission in the Balmer and certain metallic lines. They are often called “classical Be stars” to distinguish them from other emission line stars such as Herbig Ae/Be stars and Algol systems (see Porter & Rivinius, 2003, for a recent review on Be stars). The line emission is assumed to arise in a geometrically thin disk consisting of matter ejected from the central star. Such circumstellar disks have actually been imaged by long-baseline interferometry for several Be stars including CMi (e.g. Tycner et al., 2005). Our target star, CMi (HD 58715, HR 2845), is a bright but ’quiet’ late-type Be star (B8Ve; ); no photometric variations were found by Pavlovski et al. (1997). The star shows only gradual and small long-term variations in H emission (e.g., Hanuschik et al., 1996) arising from a relatively small disk of stellar radii (e.g. Tycner et al., 2005).
Other Be stars, particularly of early-type, often show short-term photometric variations of less than a few days. The causes of these variations are assumed to be pulsation and rotational modulation (see Porter & Rivinius, 2003, for a review). Many early-type Be stars exhibit line-profile variations indicating the presence of non-radial pulsations (e.g. Rivinius et al., 2003). Multi-periodic photometric variations are also the signature of non-radial pulsations such as those found recently by MOST for Oph (O9.5Ve; Walker et al., 2005a) and HD 163868 (B5Ve; Walker et al., 2005b). Until now, there has been no clear indication of pulsations for late-type Be stars. Baade (1989) searched for, but failed to detect any, line-profile variations in B8-B9.5 stars. There were very small photometric variations in a few late-type Be stars, but these were judged to be mono-periodic (e.g., Pic B9Ve, Balona et al 1992; Crv B8Vne, Barrera et al. 1991) and attributed to rotational modulation.
It is of critical importance to know if nonradial pulsations are excited even in late-type Be stars because it would indicate that all Be stars may have nonradial pulsations which could play a critical role in mass ejection. Excitation of g-modes in late-type Be stars is likely because the cool boundary of the distribution of Be stars on the HR diagram (Zorec et al., 2005) roughly coincides with the cool boundary of the Slowly Pulsating B (SPB) stars (Pamyatnykh, 1999), and because prograde g-modes can be excited even in a rapidly rotating star (Walker et al., 2005b). With this motivation we observed CMi with MOST and indeed discovered multi-periodic light variations, albeit of low amplitude.
2 THE MOST PHOTOMETRY
The MOST satellite was launched on June 2003 and the original mission is described by Walker et al. (2003). A 15/17.3 cm Rumak-Maksutov telescope feeds two CCDs, one for tracking and the other for science, through a single, custom, broadband filter (350 – 700 nm). Starlight from Primary Science Targets () is projected onto the science CCD as a fixed (Fabry) image of the telescope pupil covering about 1500 pixels for high photometric stability and insensitivity to detector flatfield irregularities and the effect of particle irradiation on individual pixels. The experiment was designed to detect photometric variations with periods of minutes at micro-magnitude precision and does not rely on comparison stars or flat-fielding for the Fabry photometry. There is no direct connection to any photometric system. Tracking jitter was dramatically reduced by early 2004 to 1 arcsec which led to significantly higher precision in the Fabry photometry.
The observations received from the satellite were reduced by RK. Outlying data points generated by poor tracking or cosmic ray hits were removed. MOST suffers from parasitic light, mostly Earthshine, at certain orbital phases, with the amount and phase depending on the stellar coordinates, spacecraft roll and season of the year. Data are also recorded for Fabry images from seven of the eight lenses adjacent to the target Fabry lens in order to track the stray light background. These background signals were combined in a mean and subtracted from the target photometry. This also corrected for bias, dark and background signals and their variations. The reductions basically followed the scheme outlined earlier by Rucinski et al. (2004).
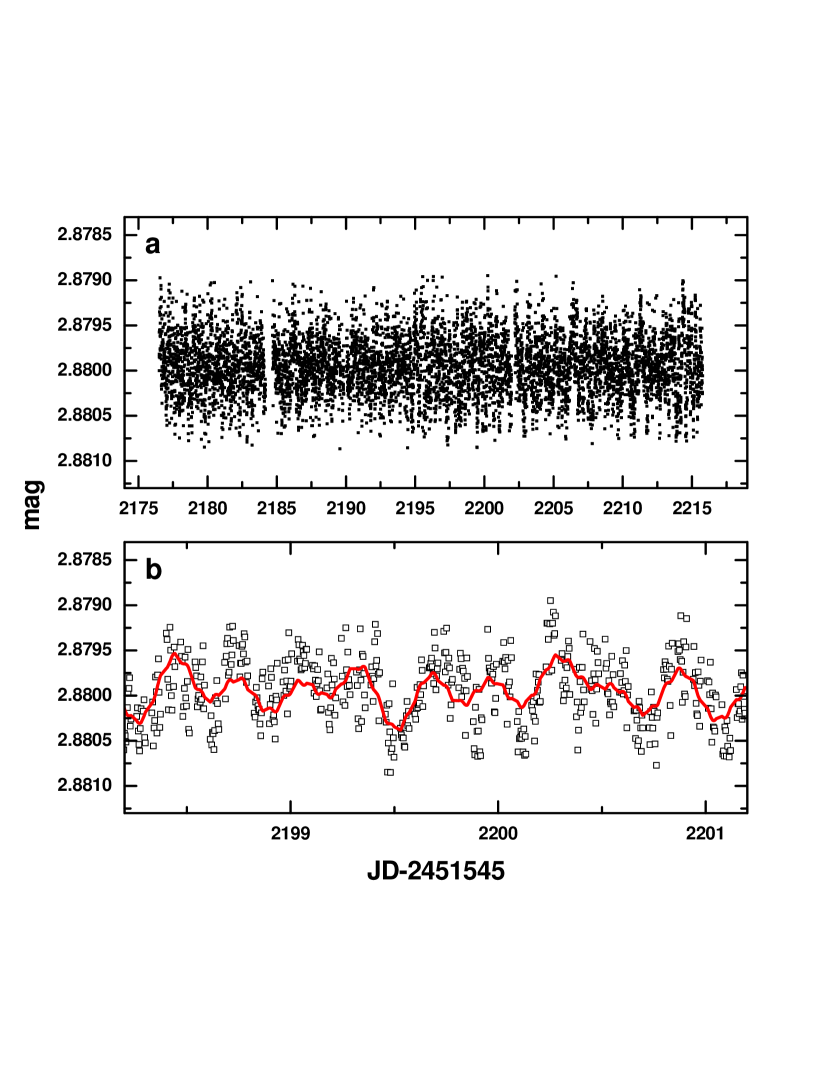
MOST observed CMi from December 16 2005 till January 26 2006 for a total of 41 days. Observing time was split between CMi and another field such that only 45% of each 101 min orbit was available for CMi. In addition to the 45% duty cycle over the 41 days, there was a single 12 hour gap. Individual exposures were 8 sec taken every 20 sec (the sampling time). For the final frequency analysis mean magnitudes were calculated from data accumulated every 5 min. The RMS scatter of the individual 8-sec exposures is 0.300 mmag and 0.070 mmag for the the 5-min means.
Figure 1 displays the full 41-day light curve for the 5-min means with time in heliocentric JD. A 3-day expanded portion of the light curve is shown in the second panel. The solid line in the lower panel is the reconstructed lightcurve obtained with the most significant peaks in the frequency analysis discussed below. The complete light curve can be downloaded from the MOST Public Data Archive 111The MOST Public Data Archive is available at www.astro.ubc.ca/MOST..
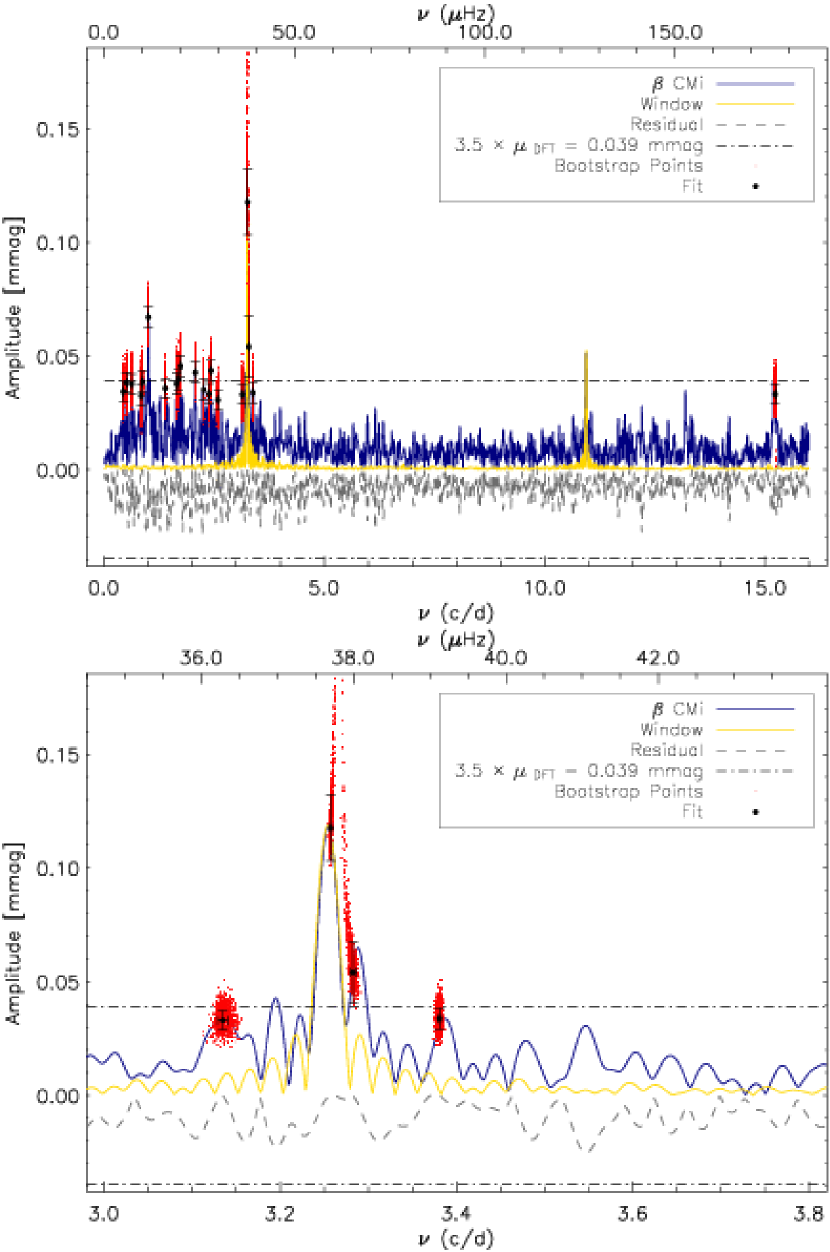
Figure 2 displays the discrete Fourier transform (DFT) of the MOST light curve for . The frequency analysis was performed by CC using his CAPER software (Walker et al., 2005b; Saio et al., 2006). Frequencies with amplitudes mmag (3.5 times the noise level averaged over the spectrum from 0 to 15 cycles day-1) are identified in Figure 2. The plot includes the spectral window function and shows the residual amplitude spectrum after removal of the 20 highest peaks. The peak at 1 cycles day-1 is an artifact of the Earth’s rotation and the satellite’s Sun-synchronous orbit, and their modulation of parasitic light. The peak at 15.2 cycles day-1 is an artifact related to MOST’s orbital frequency.
There are two dominant features in the DFT, with frequencies of cycles day-1 (S/N 8.5) and cycles day-1 (S/N 3.5). The spacing between these two frequencies is cycles day-1. The high S/N values for these frequencies and detailed comparison with the background recorded in the MOST Fabry field demonstrates that these two signals are intrinsic to CMi.
There are also nearby frequencies at cycles day-1 (S/N 2.9) and cycles day-1 (S/N 2.8). However, given their relatively low signal-to-noise, we do not consider these to be definitive detections in this data set. There is also evidence for significant stellar variability at frequencies below 3 cycles day-1 but its origin is unclear.
We have performed the frequency analysis on the data, both with the long-term trends removed and left in the time series. The frequency identifications reported above are unaffected, which is consistent with the very clean spectral window of the MOST photometry and the expected lack of power leakage from low to higher frequencies in the Fourier spectrum of these data.
Error bars for the fit parameters are determined by a bootstrap process (e.g., Wall & Jenkins, 2003). A large number of trial light curves (10000 in this case) are generated by randomly sampling the light curve. The fitting procedure is repeated for each new light curve resulting in a distribution for each fit parameter. The error bars are 1 standard deviation in each of the parameter distributions (see for example Saio et al 2006). Note that these frequencies are well determined although the amplitudes of the main peaks have moderate uncertainties.
3 MODELS
To understand the cause of the periodic variations detected by MOST we have performed a pulsational stability analysis for rapidly rotating main-sequence star models of and , whose evolutionary tracks pass close to the position of CMi (Fig.3). The evolutionary models were computed in the same way as in Walker et al. (2005b), and the stability analysis was performed based on the method of Lee & Baraffe (1995). An initial chemical composition of is adopted. The opacity was obtained from OPAL tables (Iglesias & Rogers, 1996). The centrifugal force is approximately included in the spherical symmetric hydrostatic equilibrium as
| (1) |
where is the pressure, is the distance from the center, is the local gravitational acceleration, is the matter density, and is the angular frequency of rotation. The rotation frequency is assumed to be constant throughout the stellar interior and evolution. Evolutionary tracks calculated with rotation frequencies of mHz (1.73 cycles day-1) and mHz (2.59 cycles day-1) are shown in Figure 3. These tracks stop where the centrifugal force exceeds the gravitational force in equation (1) at the stellar surface. A track not including rotational effects has also been calculated and is also shown in Figure 3.
Figure 3 also shows an approximate position of CMi with error bars, which is estimated as follows. Zorec et al. (2005) obtained for CMi as apparent parameters and converted them to mean values averaged over the whole stellar surface. These parameters yield . On the other hand, Fabregat & Reglero (1990) obtained an absolute magnitude of from the data of photometry corrected for circumstellar emission. Combining this value with a bolometric correction for B8V of (Flower, 1977) yields . Furthermore, combining Fabregat & Reglero’s magnitude of 3.02 (corrected for circumstellar emission) with the Hipparcos parallax (Perryman et al., 1997) and the above bolometric correction, we obtain . From these estimates we have adopted for the luminosity of CMi. For the effective temperature, Flower (1977) gives for the spectral type B8V. Combining this value and Zorec et al.’s value, we have adopted .
CMi is located close to the cool edge of the SPB instability region of the HR diagram (Pamyatnykh, 1999). Our models confirm this observation (see Figure 4). Along our evolutionary tracks without rotation the cooler boundary of the instability region appears at for , for , and for . The excited modes in our , non-rotating models, are high-order g-modes excited by the Fe-opacity bump (Gautschy & Saio, 1993; Dziembowski et al., 1993).
Since CMi is a rapid rotator, we have to include the rotation effects in the stability analysis of g-modes. Nonradial pulsations of a rapidly-rotating star cannot be represented by a single spherical harmonic and coupled with toroidal velocity fields. In our analysis the angular dependence of pulsation amplitude is expanded using eight spherical harmonics for a given azimuthal order ( for toroidal velocity field), where () for even modes and () for odd modes with (see e.g., Unno et al, 1989, for general discussions on nonradial pulsations of rotating stars). We adopt the convention that a negative represents a prograde mode (in the co-rotating frame) with respect to the stellar rotation. Even (odd) modes are symmetric (anti-symmetric) with respect to the equatorial plane. We designate the angular-dependence type of a mode by a set of (,), in which is defined as the value of the largest-amplitude component.
Figure 5 shows frequencies (in the observers’ frame) of low surface order ( and ) modes excited in evolutionary models of rotating at frequencies of mHz and mHz as a function of the effective temperature. Comparing this figure with Figure 4, we find that the cooler boundary of instability is bluer than in the non-rotating case. Fewer modes are excited in more rapidly rotating models. This implies rapid rotation tends to stabilize g-mode pulsations.
The pulsation frequency in the observers’ frame is given as
where is the pulsation frequency in the frame co-rotating at frequency . Therefore, pulsation frequencies in the observer’s frame for high-order g-modes and r-modes (for which ) tend to group depending on the value just as seen in Figure 5. All the excited prograde modes () seen in Figure 5 are sectoral () g-modes, while all the excited retrograde () modes are r-modes (in which toroidal motion is dominant) in those rapidly rotating models. No retrograde g-modes are excited in this figure. We note that, as shown in Appendix A, the stability of pulsation modes differs considerably if we use the so-called traditional approximation in which the horizontal component of the angular velocity of rotation is neglected.
Under the assumption of mHz (1.73 cycles day-1), the periodic light variations of CMi are approximately reproduced by r-modes of . On the other hand, the observed variations are identified as sectoral prograde g-modes of if we assume mHz (2.59 cycles day-1). In the former case another three groups of frequencies are expected to be observed in the estimated range of CMi, while in the latter case only one group of frequencies should be observed (Fig.5). Since MOST has detected only one group of frequencies around 3.26 cycles day-1 in CMi (§2), we conclude that a model rotating at mHz (2.59 cycles day-1) is more appropriate.222The slower rotation model might appear to be saved if the low-amplitude frequencies around 2 cycles day-1 in Fig.2 were assigned to g-modes of and the main frequencies around 3.26 cycles day-1 to r-modes of . We consider this highly unlikely, however, since r-modes are not expected to yield luminosity variations much larger than the sectoral g-modes of , and because no peaks around 4 cycles day-1 corresponding to g-modes of are detected. For this rotation rate pulsations excited at are prograde sectoral high-radial order (19th–33rd) g-modes. The frequencies in the co-rotating frame range over . Frequency spacings between two adjacent modes lie in a range from cycles day-1 to cycles day-1. Since the frequency resolution expected from the data is approximately cycles day-1, only a few frequencies are expected to be resolved just as the DFT indicates (Fig. 2).
The top panels of Figure 5 show the rotation angular frequency normalized by the Keplerian frequency . For a given , increases as the model evolves because the stellar radius increases. Since the equatorial radius is larger than the mean radius, the rotation velocity becomes critical at the equator with ; probably at . Figure 5 indicates that models with mHz rotate nearly critically at the effective temperature of CMi. (For models with mHz, , not appropriate for CMi.) This supports Townsend et al’s (2004) claim that classical Be stars may be rotating much closer to their critical velocities than is generally supposed. It is also consistent with the recent statistical property found by Cranmer (2005) that the coolest Be stars rotate nearly critically.
4 DISCUSSION
We have found nonradial g-mode pulsations excited in the late-type Be star CMi (B8Ve). This confirms that CMi belongs to the new class of SPBe stars, like HD163868 (Walker et al., 2005b). We have identified pulsation modes as prograde-sectoral g-modes of , based on the comparison between the observed frequencies and theoretical ones excited by the Fe bump of opacity in rapidly rotating models. The fact that only one group of frequencies is detected by MOST is consistent with our prediction of the pulsational stability if CMi rotates nearly critically. This supports the recent claims (Townsend, et al., 2004; Cranmer, 2005) that classical Be stars rotate more rapidly than previously thought (70–80% of the critical rate; e.g. Porter, 1996; Chauville et al., 2001). The observed amplitudes are small ( mmag). Since CMi lies close to the red edge of the instability region on the HR diagram, the pulsational instability is not strong and hence the pulsation amplitudes are expected to be small.
Our discovery of nonradial pulsations in CMi suggests the possibility that nonradial pulsations are involved in all rapidly rotating Be stars. In some early-type Be stars mass ejections are observed to occur at certain pulsation phases (e.g. Cen: Porter & Rivinius, 2003) suggesting that pulsations trigger mass ejections. It is tempting to speculate that nonradial pulsations may play a crucial role in mass ejection in all Be stars. Osaki (1986) argued that prograde nonradial pulsations can transport angular momentum toward the surface and spin up the equatorial region critically leading to a mass ejection. Owocki (2005) showed numerically that introducing velocity variations corresponding to a prograde () nonradial pulsation in a nearly critically rotating stellar atmosphere actually yields a circumstellar Keplerian disk.
Our findings in this paper and Walker et al. (2005b), that prograde sectoral g-modes are selectively excited in rapidly rotating Be stars, support the above scenario for mass ejection. Line-profile-variation (LPV) analyses for early type Be stars, however, tend to indicate the presence of retrograde modes (Rivinius et al., 2003) rather than prograde modes, contrary to our model findings.
Rivinius et al. (1998) obtained four periods around 0.503 days and two period around 0.28 days from LPVs in Cen, one of the best studied and most active Be stars. [These LPVs of Cen were modeled as retrograde () modes by Rivinius et al. (2001).] Frequency spacings among each group are about 0.034 cycles day-1 or less, which are comparable with the frequency difference 0.025 cycles day-1 between the two main frequencies of CMi (§2) and with typical frequency spacings cycles day-1 of HD 163868 (Walker et al., 2005b). These frequency spacings are comparable with those of g-modes, although they are close to the limit of the frequency resolution. Longer observations by MOST or COROT would make g-mode seismology of SPBe stars possible. Also, simultaneous photometric and spectroscopic observations of Cen and other Be stars showing conspicuous LPVs and mass-ejection events would be important to understand the connection between nonradial pulsations and mass ejections in Be stars.
Appendix A Mode stability under the traditional approximation
The pulsation analysis for low-frequency modes of a rapidly rotating star is greatly simplified by the use of the so-called traditional approximation, in which the horizontal component of the angular velocity of rotation ( with being the co-latitude) is neglected. Under the traditional approximation, eigenfrequencies can be obtained using the same equations as those for nonradial pulsations of non-rotating stars except replacing with the parameter (see e.g., Townsend, 2005; Lee, 2006). The value of deviates from as the ratio of the rotation to the pulsation frequency (in the co-rotating frame) increases depending on and (e.g., Lee & Saio, 1997).
The traditional approximation is justified dynamically for low-frequency pulsations, but it is not clear whether the approximation is reasonable for the nonadiabatic stability analysis. To see the effect, we have performed a stability analysis using the traditional approximation for - models rotating at a frequency of 0.03 mHz. The results are shown in Figure 6. Comparing this figure with Figure 5, we see that under the traditional approximation, larger numbers of prograde sectoral g-modes are excited, and that tesseral g-modes of and are also excited. These tesseral modes are all damped without the traditional approximation in these models. The cause of the difference is attributed to damping due to mode-couplings (Lee, 2001) which are absent under the traditional approximation. The damping effect is strongest for retrograde g-modes and tesseral () g-modes.
We note that in the models shown in Figure 6 no retrograde g-modes are excited even under the traditional approximation. This is understood as follows. Retrograde g-modes have large values of (Lee & Saio, 1997), which correspond to modes of large latitudinal degree in a non-rotating model. Figure 4 for nonrotating models indicates that the cooler boundary of instability region is hotter for larger . Therefore, we understand that the temperature range for instability of retrograde g-modes is hotter than that shown in Figure 6.
References
- Baade (1989) Baade, D. 1989, A&A, 222, 200
- Balona et al. (1992) Balona, L. A., Cuypers, J., & Marang, F. 1992, A&AS, 92, 533
- Barrera et al. (1991) Barrera, L. H., Mennickent, R. E., & Vogt, N. 1991, Ap&SS, 185,79
- Chauville et al. (2001) Chauville, J., Zorec, J., Ballereau, D., Morrell, N., Cidale, L., & Garcia, A. 2001, A&A, 378, 861
- Cranmer (2005) Cranmer, S. R. 2005, ApJ, 634, 585
- Dziembowski et al. (1993) Dziembowski, W.A., Moskalik, P., & Pamyatnykh, A.A. 1993, MNRAS, 265, 588
- Fabregat & Reglero (1990) Fabregat, J. & Reglero, V. 1990, MNRAS, 247, 407
- Flower (1977) Flower, P. J. 1977, A&A, 54, 31
- Gautschy & Saio (1993) Gautschy, A. & Saio, H. 1993, MNRAS, 262, 213
- Hanuschik et al. (1996) Hanuschik, R.W., Hummel, W., Sutorius, E., Dietle, O., & Thimm, G. 1996, A&AS, 116, 309
- Iglesias & Rogers (1996) Iglesias, C.A., & Rogers, F.J. 1996, ApJ, 464, 943
- Lee (2001) Lee, U. 2001, ApJ, 557, 311
- Lee (2006) Lee, U. 2006, MNRAS, 365, 677
- Lee & Baraffe (1995) Lee, U. & Baraffe, I. 1995, A&A, 301, 419
- Lee & Saio (1997) Lee, U. & Saio, H. 1997, ApJ, 491, 839
- Osaki (1986) Osaki, Y. 1986, PASP, 98, 30
- Owocki (2005) Owocki, S. 2005, in ASP Conf. Ser. 337, The Nature and Evolution of Disks around Hot Stars, ed. R. Ignace & K. G. Gayley (San Francisco: ASP), 101
- Pamyatnykh (1999) Pamyatnykh, A.A. 1999, Acta Astron., 49, 119
- Pavlovski et al. (1997) Pavlovski, K., Harmanec, P., Božić, H., Koubský, P., Hadrava, P., Kříž, S., Ružić, Ž, & Štefl, S. 1997, A&AS, 125, 75
- Perryman et al. (1997) Perryman, M. A. C. & ESA. 1997, The Hipparcos and Tycho Catalogues (ESA SP-1200; Noordwijk: ESA)
- Porter (1996) Porter, J.M. 1996, MNRAS, 280, L31
- Porter & Rivinius (2003) Porter, J.M., Rivinius, T. 2003, PASP, 115, 1153
- Rivinius et al. (2003) Rivinius, Th., Baade, D., & Štefl, S. 2003, A&A, 411, 229
- Rivinius et al. (1998) Rivinius, Th., Baade, D., Štefl, S., Stahl, O., Wolf, B., & Kaufer, A. 1998, A&A, 336, 177
- Rivinius et al. (2001) Rivinius, Th., Baade, D., Štefl, S., Townsend, R. H. D., Stahl, O., Wolf, B., & Kaufer, A. 2001, A&A, 369, 1058
- Rucinski et al. (2004) Rucinski, S.M., Walker, G. A. H., Matthews, J.M., Kuschnig, R., Shkolnik, E., Marchenko, S., Bohlender, D.A., Guenther, D. B., Moffat, A. F. J., Sasselov, D., Weiss, W. W. 2004, PASP, 116, 1093
- Saio et al. (2006) Saio,H., Kuschnig, R., Gautschy, A., Cameron, C., Walker, G. A. H., Matthews, J., Guenther, D. B., Moffat, A. F. J., Rucinski, S., Sasselov, D., Weiss, W. W. 2006, ApJ, in press
- Townsend (2005) Townsend, R. H. D. 2005, MNRAS, 360, 465
- Townsend, et al. (2004) Townsend, R. H. D., Owocki, S. P., & Howarth, I. D. 2004, MNRAS, 350, 189
- Tycner et al. (2005) Tycner, C., Lester, J.B., Hajian, A.R., Armstrong, J.T., Benson, J.A., Gilbretath, G.C., Hutter, D.J., Pauls, T.A., & White, N.M. 2005, AJ, 624, 359
- Unno et al (1989) Unno, W., Osaki, Y., Ando, H., Saio, H., & Shibahashi, H. 1989, Nonradial Oscillations of Stars, Tokyo: University of Tokyo Press, Ch.6
- Walker et al. (2003) Walker, G. A. H., Matthews, J., Kuschnig, R., Johnson, R., Rucinski, S., Pazder, J., Burley, G., Walker, A., Skaret, K., Zee, R., Grocott, S., Carroll, K., Sinclair, P., Sturgeon, D., & Harron, J. 2003, PASP, 115, 1023
- Walker et al. (2005a) Walker, G. A. H., Kuschnig, R., Matthews, J. M., Reegan, P., Kallinger, T., Kambe, E., Saio, H., Harmanec, P., Guenther, D. B., Moffat, A. F. J., Rucinski, S. M., Sasselov, D., Weiss, W. W., Bohlender, D. A., Božić, H., Hashimoto, O., Koubskiý, Mann, R., Ruždjak, D., Škoda, P., Šlechta, M., Sudar, D, Wolf, M., & Yang, S. 2005a, ApJ, 623, L145
- Walker et al. (2005b) Walker, G. A. H., Kuschnig, R., Matthews, J. M., Cameron, C., Saio, H., Lee, U., Kambe, E., Masuda, S., Guenther, D. B., Moffat, A. F. J., Rucinski, S. M., Sasselov, D., & Weiss, W. W. 2005b, ApJ, 635, L77
- Wall & Jenkins (2003) Wall, J.V., & Jenkins, C.R. 2003, Practical Statistics for Astronomers, Cambridge, Cambridge University Press
- Zorec et al. (2005) Zorec, J., Frémat, Y., & Cidale, L. 2005, A&A, 441, 235