The Signature of Primordial Grain Growth in the Polarized Light of the AU Mic Debris Disk
Abstract
We have used the coronagraphic mode of the Advanced Camera for Surveys aboard the Hubble Space Telescope to make the first polarization maps of the debris disk surrounding the nearby M star AU Microscopii (GJ 803). The linear polarization of the scattered light from the disk is unambiguously detected. We find that the degree of polarization for the disk rises monotonically from about 0.05 to 0.35 between projected radii of 20 and 50 AU. Polarized light is detectable out to about 80 AU, where the fractional polarization reaches a maximum observed value of . Polarization vectors are oriented perpendicular to the disk mid-plane, indicating that polarization originates from single scattering in an optically thin dust disk where the albedo is dominated by small () particles. We use simple, optically thin disk models to infer the spatial structure of the disk and the scattering properties of the constituent grains by simultaneously fitting the surface brightness profile and the degree of linear polarization. The best fit models require that the dust grains exhibit high maximum linear polarization and strong forward scattering. The inner disk (40–50 AU) is depleted of micron-sized dust by a factor of more than 300, which means that the disk is collision dominated, i.e., grains that are dragged inward by corpuscular and Poynting-Robertson drag undergo a destructive collision. While the inferred optical properties are covariant with the radial distribution of dust, the only acceptable models have and . These constraints cannot be met by spherical grains composed of conventional materials. A Mie scattering analysis implicates grains where the real part of the refractive index is about 1.03, which is a signature of highly porous (91–94%) media. More reliable methods for calculating the scattering properties of aggregates confirm that the observed values of and can be matched by high porosity, micron-sized clusters of small particles. In the inner Solar System, porous particles form naturally in cometary dust, where the sublimation of ices leaves a “bird’s nest” of refractory organic and silicate material. In AU Mic, the grain porosity may be primordial, because the dust “birth ring” lies beyond the ice sublimation point. The observed porosities span the range of values implied by recent laboratory studies of particle coagulation in the proto-solar nebula by ballistic cluster-cluster aggregation. To avoid compactification, the upper size limit for the parent bodies is in the decimeter range, in agreement with theoretical predictions based on collisional lifetime arguments. Consequently, AU Mic may exhibit the signature of the primordial agglomeration process whereby interstellar grains first assembled to form macroscopic objects.
Subject headings:
polarization—dust—stars: individual(GJ 803; AU Mic (catalog ))—planetary systems: formation— circumstellar matter1. Introduction
Approximately 15% of nearby main sequence stars manifest infrared excess due to the reprocessing of stellar radiation by dust grains in a circumstellar disk (Aumann et al., 1984; Backman & Paresce, 1993). These systems are known as “debris disks” because the lifetime of dust is orders of magnitude shorter than the stellar age, suggesting a continuous supply of fresh grains released from larger, undetected parent bodies. In the solar system, interplanetary dust particles are resupplied by the collisional erosion of asteroids and the sublimation of comets. Cometary dust grains retain the history of their interstellar origin, but are imprinted with structures that speak to their incorporation into larger bodies and subsequent return to interplanetary space (Greenberg & Hage, 1990). Therefore, cometary dust provides our closest link to the particle coagulation processes that occurred during the earliest phases of planet building in the Solar System. Although debris-disk dust must be highly processed and modified during incorporation into, and subsequent attrition of, large bodies, these particles are our primary source of information regarding the growth of assembly of planetesimals in exoplanetary systems. The laboratory study of low-velocity dust interactions thought to be characteristic of conditions in the early solar nebula suggests that particles grow under ballistic cluster-cluster aggregation into fractal assemblies (Wurm & Blum, 1998). These bodies suffer restructuring when the aggregate diameters exceed a few centimeters. Smaller bodies are not expected to be subjected to impact compaction (Blum & Wurm, 2000). As these clusters have unique optical properties, the study of debris disks provides experimental validation of our ideas regarding growth of solid bodies from interstellar grains to macroscopic objects (Kimura et al., 2006).
At visible wavelengths debris-disk dust can be detected in scattered light, analogous to the Zodiacal light in our Solar System. As in the Solar System, the polarization state of this scattered light is a key diagnostic of the grain properties. In an optically thin disk, where single scattering dominates, a high degree of linear polarization is expected, with a characteristic orientation that is symmetric (concentric or radial) about the illuminating source (e.g., Kruegel, 2003). The observed degree of polarization is an important indicator of the size, shape, composition, physical structure and alignment of individual grains and their distribution along the line of sight. Single particle scattering can be described by the matrix elements of the complex amplitude scattering function, , which depend on the scattering angle (van de Hulst, 1981). The angular dependence of is a key clue to the nature of the particles. For example, the degree of forward scattering increases with particle size from the Rayleigh limit (), where the scattering asymmetry parameter, , to as approaches unity. Observations of spatially resolved disks can directly determine the azimuthal asymmetry due to asymmetric scattering (e.g., Kalas et al., 2005). Because debris disks are optically faint relative to their illuminating star, there is a strong selection effect that favors the discovery and facilitates the study of high surface brightness, edge-on systems, e.g., Pic, HD 32297, HD 139664, or AU Mic.
In an edge-on system, the azimuthal variation of surface brightness around the star is unobservable, and thus grain scattering properties versus phase angle cannot be measured directly. Each line of sight through the disk includes a range of scattering angles. Therefore, both the asymmetry parameter and the radial variation of dust opacity determine the disk surface brightness as a function of angle on the sky. Unless there is prior information regarding or the dust distribution these properties cannot be uniquely disentangled from measurements of the radial surface brightness distribution. Inclusion of further constraints, such as the spectral energy distribution (e.g., Strubbe & Chiang, 2005), can break this degeneracy. Polarization data can also play this role. In general, the matrix elements of S have different angular dependences. Therefore, observation of the intensity, which depends on , and the polarization state of scattered light, which depends on , can be used to recover this otherwise lost information.
Here we present the first optical polarization study of the AU Mic debris disk. AU Mic is a nearby (9.9 pc) dM1e star with Galactic space velocities that suggest a common origin with Pic. (Barrado y Navascués et al., 1999). The discovery of scattered visible light from a near-edge-on debris disk around AU Mic (Kalas et al., 2004) supports the picture of Pic, AU Mic and nearly 20 other stars as a coeval group with age 12 Myr (Zuckerman et al., 2001). The Pic debris disk has been studied extensively, including the finding of polarization along the mid-plane varying between 0.12 and 0.21 in optical data (Gledhill et al., 1991; Wolstencroft et al., 1995). These measurements have been interpreted by several authors (e.g., Artymowicz, 1997; Voshchinnikov & Krügel, 1999; Krivova et al., 2000). In recent ground based observations, polarization in the band has been detected (Tamura et al., 2006).
Despite the large difference in stellar mass, Strubbe & Chiang (2005) and Augereau & Beust (2006) argue that the radiation pressure force that quickly expels small Pic grains has a counterpart around AU Mic in the form of stellar wind. To first order this explains the initial finding that the disk mid-plane surface brightness distribution is nearly identical for both debris disks (Kalas et al., 2004). However, the blue color gradient for AU Mic’s mid-plane (Metchev et al., 2005; Krist et al., 2005; Fitzgerald et al., 2006) contrasts against the red color of Pic’s mid-plane (Golimowski et al., 2006). This distinct color difference between the two disks points to a significant divergence in either the grain composition, grain size distribution, or minimum grain size. Polarization observations of AU Mic are therefore valuable in constraining these grain properties and identifying the fundamental differences between the two disks.
Our purpose is to present Advanced Camera for Surveys (ACS)/High Resolution Camera (HRC) polarimetry of the AU Mic system and to shed some initial light on the disk structure and grain optical properties that are emphasized by the detection and measurement of the disk in polarized light. The fidelity of any model increases with the observational challenges presented to it, thus it must fit the near-IR and optical emission (Kalas et al., 2004; Liu, 2004; Metchev et al., 2005; Fitzgerald et al., 2006) and the IR to sub-mm spectral energy distribution (Liu et al., 2004; Chen et al., 2005). We defer this synthesis to a later study.
Section 2 outlines the observations, point spread function (PSF) subtraction, calibration of the Stokes parameters, and correction for instrumental and interstellar polarization. Section 3 reports the appearance of the AU Mic disk in polarized light. Section 3.2 provides a qualitative description of the extracted one-dimensional surface brightness profile and degree of linear polarization, compares AU Mic with Pic, and draws some preliminary conclusions regarding the radial distribution of the dust. We describe quantitative analysis using optically-thin edge-on disk models in §4 and develop a method that simultaneously fits the observed surface brightness and fractional polarization to three dust models: a semi-empirical Henyey-Greenstein model, a Zodiacal dust model, and a Mie model. The successes and failures of these models are addressed in §5 and the evidence for porous grains is examined. Our conclusions are summarized in §6.
2. Observations, Data Reduction and Calibration
Coronagraphic observations of AU Mic (GJ 803, HD 197481) were made on 2004 August 01, using the diameter ( at ) occulting spot on the ACS/HRC aboard Hubble Space Telescope (HST). The occulting spot is located in the aberrated beam from HST, before corrective optics, and intercepts about 88% of the on-axis light (Ford et al., 2003). The F606W broadband filter, comparable to the Johnson-Cousins band, was chosen for all observations. AU Mic was observed during two orbits with the spacecraft roll angle offset by 10.1 degrees between orbits. Three exposures of 240 seconds were obtained through each of the three polarizer elements (POL0V, POL60V, POL120V). A third orbit was devoted to observing a PSF reference star using the same filter combinations. Together, PSF-subtracted, coronagraphic data render an improvement factor exceeding one hundred in contrast relative to direct imaging. The PSF star (GJ 784; M0V (Evans et al., 1957)) was chosen on the basis of similar brightness to AU Mic, close spectral type match, and proximity on the sky. Data reduction included the standard pipeline processing from the HST archive that produces bias-subtracted and flat-fielded image files. Images were additionally processed using the recommended spotflat and pixel area map. Differencing frames within an orbit and between orbits was used to register all images.
PSF subtraction at each POLV filter was achieved by subtracting the PSF reference star from AU Mic to produce a residual image that gives a mean radial profile equal to zero intensity in directions perpendicular to the mid-plane. PSF subtraction was implemented before construction of the Stokes parameter images because the POLV filters introduce filter-specific artifacts. The polarizer filters contribute a weak geometric distortion which rises to about 0.3 pixels near the edges of the HRC. This is caused by a weak positive lens in the polarizers, which is needed to maintain proper focus when multiple filters are in the beam. In addition, the visible polarizer has a weak ripple structure which is related to manufacture of its Polaroid material; this contributes an additional 0.3 pixel distortion with a complex structure (Biretta & Kozhurina-Platais, 2004; Kozhurina-Platais & Biretta, 2004). All these geometric effects are correctable, but astrometry obtained with the POLV filters will likely have reduced accuracy due to residual errors and imperfect corrections.

2.1. Calibration of the Stokes Parameters
Imaging polarimetry with ACS is described and characterized by Biretta et al. (2004) and Pavlovsky (2006). The ACS/HRC polarimeter is implemented as three analyzers installed in a filter wheel at nominal angles of 0, 60 and 120 degrees denoted POLV0, POLV60, and POLV120, respectively. Mueller matrix algebra can be used to show that the observed intensity, , through a perfect analyzer rotated by an angle is
| (1) |
where , and are the Stokes parameters (Chandrasekhar, 1960). This arrangement is insensitive to the circular polarization, , which we assume henceforth to be negligible. Assuming that the three POLV filters are ideal, and ignoring instrumental polarization, we can solve the set of resultant simultaneous equations to show
| (2) | |||||
| (3) | |||||
| (4) |
We measure instrumental angles counter-clockwise from the axis, which we take to be defined by the orientation of the POLV0 filter. We quote this elementary result because Biretta et al. (2004) and Pavlovsky (2006) each use different sign conventions for angles, resulting in different expressions for ; our choice is consistent with the latter. The Stokes parameters are then projected onto an astronomical coordinate system using the Mueller matrix to rotate from the spacecraft reference frame. The degree of linear polarization, which is occasionally referred to as the fractional polarization, is defined as . The position angle of the electric field is .
The polarizing efficiency of the POLV filters is high: at 600 nm, where is the transmission for the and linear polarization states, respectively, and the orientation of each POLV filter is within a degree of its nominal values (Biretta et al., 2004; Biretta & Kozhurina-Platais, 2004). Nonetheless, the ACS is not an ideal polarimeter. The HRC employs three non-normal reflections and a tilted detector that combine to yield an instrumental polarization in F606W of 0.063 at a position angle of degrees111Using our sign convention. (Biretta et al., 2004).
We remove the instrumental polarization from our data by using the correction factors, which are derived by Pavlovsky (2006) from observations of polarization standard stars. These corrections are applied to the observed count rate in each of the three polarizers before computing the Stokes parameters. The systematic error in the degree of linear polarization for a weakly polarized source is about 0.01; the resultant degree of linear polarization will have a fractional systematic error of about 10% for highly polarized ( 0.20) sources. For example, the systematic error for = 0.05 is 0.01, but the systematic error for = 0.50 is 0.05. The systematic error in is about 3 degrees. Because we combine two observations at different roll angles, our systematic errors are somewhat reduced relative to these values.
The -band polarization standards BD +64∘106 (; degrees) and GD 319 () (Schmidt et al., 1992) were observed with the HRC, F606W, and the POLV filter set, as part of the ACS polarization calibration program (HST Proposal IDs 9586 & 9661). We established the correctness of our implementation of the Stokes parameter calibration procedure by measuring the degree of polarization and PA of these stars, comparing with the ground-based results, and confirming agreement within the statistical errors. The polarization calibration targets are weakly polarized point sources, whereas the AU Mic disk is spatially extended. To gain experience and confidence with imaging polarimetry we also analyzed the ACS Wide Field Camera F606W/POLV observations of the highly polarized Crab Pulsar synchrotron nebula (Proposal ID 9787).
2.2. Interstellar Polarization
In additional to correction for instrumental polarization observations should also be corrected for interstellar polarization. AU Mic is nearby, at high Galactic latitude and has minimal color excess, suggesting that polarization due to interstellar dust grains is likely to be negligible. Although the polarization of AU Mic itself has not been detected in integrated light (Pettersen & Hsu, 1981), we can inspect the interstellar polarization of adjacent stars (Fig. 1). This figure shows the observed degree of linear polarization for stars within an angular radius of 25 degrees of AU Mic from Heiles (2000). The median measured polarization is in this direction on the sky and the highest observed value is , and this is for a star considerably more distant (260 pc) than AU Mic. We therefore neglect any interstellar polarization in the subsequent discussion. AU Mic is a flare star, and may exhibit flare-generated particle beam polarized light (Kundu et al., 1987; Saar et al., 1994).
3. Results
3.1. Linear Polarization of the AU Mic Disk
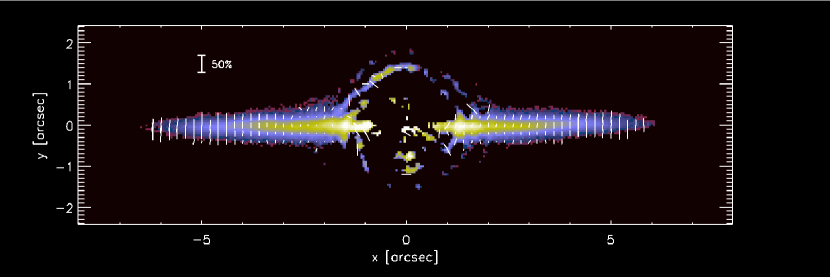
Stokes , and images were created from the PSF-subtracted POLV0, POLV60 and POLV120 images as outlined in §2.1. The corresponding degree of linear polarization and the orientation of the electric field are represented in Figure 2. Because the Stokes parameters are formed from a linear combination of the observed flux, their statistical properties are simple. In contrast, the degree of polarization is a positive definite quantity, and therefore biased. Consequently, the polarization information that we display in Figure 2 has been derived from well binned Stokes images prior to computation of and to ensure that this figure gives a reliable impression of the results.
Figure 2 shows that the degree of polarization increases monotonically with distance from the star from about 0.05 to 0.40 (see also Fig. 3). Everywhere, the electric field is consistent with an orientation perpendicular to the disk. These two results are qualitatively in accord with the expected signature of scattering by small spherical particles with (Kruegel, 2003). It is likely that the variation of polarization with distance from the star occurs because, along a given line of sight, a range of scattering angles contributes to the observed intensity. The degree of linear polarization typically peaks at scattering angles close to , and polarization is always zero in the forward and backward directions. Thus, the peak polarization signal is diluted by light arising from more acute and more oblique scattering events. We expect to see the peak polarization at the outer edge of the disk, where only right-angle scattering contributes. If the disk is devoid of dust within some inner boundary , then for impact parameters scattering events with angles between and are absent, and the degree of polarization is reduced even further (see Figure 5). For an optically thin disk, where single, small-particle scattering dominates, the electric field is oriented, as observed here, perpendicular to the plane containing the star, the dust grain and the observer. For intermediate size () spherical particles the plane of polarization can flip by at certain scattering angles so that the electric field is oriented parallel to the scattering plane (Kruegel, 2003), which is clearly not the case here. Moreover, particles composed of conventional astrophysical grain materials show large amplitude oscillatory behavior in with scattering angle, with angular period . Thus any line of sight that comprises emission from a range of scattering angles, , such that the particle size satisfies , will tend to exhibit weak linear polarization.

3.2. One-dimensional Profiles
We have measured one-dimensional surface brightness profiles along the disk in , and for comparison with simple disk models. This photometry was extracted optimally using column-by-column fitting to the vertical surface brightness profiles. This approach is advantageous because the mid-plane location and projected disk thickness vary significantly with impact parameter (Krist et al., 2005). Figure 4 shows the full-width at half maximum (FWHM) thickness of the disk (in units of the impact parameter, ), as a function of . Between projected radii of 25 and 50 AU the FWHM grows relatively slowly as , then beyond 50 AU the thickness increases more rapidly as . Because of this variation, it is unsatisfactory to simply measure the disk signal in an aperture of fixed height: a varying fraction of the emission is missing from a small aperture, while excess noise contaminates large apertures. Neither an exponential nor a Gaussian describe the vertical profile adequately. However a Cauchy distribution
| (5) |
with FWHM, , provides an excellent fit at all impact parameters, where is the coordinate perpendicular to the disk plane, and is the location of the mid-plane. The 1-d surface brightness profile is then simply the values derived from this fit. The data displayed in Figure 4 are derived from fitting the Stokes image. Because the surface brightness declines with radial distance, we have binned the vertical profile in increasingly wide blocks with distance from the star. The data are binned into three-pixel () wide columns for AU increasing to nine-pixel () wide columns for AU. This binning reduces the uncertainties at the outer edge of the disk at the expense of lower angular resolution. The signal-to-noise is greater in Stokes than in or . Therefore, we assume that the disk thickness and mid-plane location does not vary with the polarization state and use the results from fitting Stokes to constrain the and fits. The resultant Stokes 1-d surface brightness profile and degree of linear polarization is shown in Figure 3.

The polarization measurements of Pic’s debris disk provide a natural point of reference for comparison with our results. A qualitative consideration of the factors described in §3.1 suggests that these two disks have different polarization signatures because they have different radial dust distributions, and the two disks are measured on different scales. The -band polarization of Pic’s disk is observed to range from 0.12 to 0.17 (Gledhill et al., 1991; Wolstencroft et al., 1995); the degree of polarization shows a weak gradient, increasing outward between 200 and 600 AU. In contrast, polarization of the AU Mic disk rises quickly by a factor of about five between projected radii of 20 and 50 AU. A direct comparison of AU Mic with Pic is not possible because the spatial scales probed do not overlap—partly because Pic at 19.3 pc is almost twice as distant as AU Mic, and partly because the Pic measurements are derived from seeing limited observations. Nonetheless, the differences suggest that the rapid rise of the linear polarization of AU Mic’s disk between 20 and 50 AU occurs because these lines of sight intersect a central hole where scattering angles are absent. In Pic this steep rise in unobserved, because the dust depleted zone lies too close to the star to be readily observable from the ground. Recent near-IR adaptive optics data that probe Pic’s debris disk on scales of 60–120 AU are consistent with a 120 AU inner hole radius (Tamura et al., 2006). The visible extent of the Pic disk is at least 1800 AU (Larwood & Kalas, 2001). Evidently, is small () for Pic, and assuming that the optical properties of grains are homogeneous across this disk then the polarization should continue to increase gradually with increasing impact parameter out to the outer edge, located at .
This explanation, which invokes only geometric factors to explain the difference between AU Mic and Pic, is incomplete on two counts. First, the outer radius cannot be AU, because the AU Mic disk is traced out to 210 AU (Kalas et al., 2004). Second, the peak detected polarization beyond 50 AU exceeds 0.30, which exceeds the peak linear polarization of the dust invoked to explain the Pic measurements. Taken together these two observations imply that the peak linear polarization of an individual scatterer in the AU Mic disk must exceed 0.40. However, a quantitative comparison in §4 shows that our inferences about the relative scales of these two disks contain a grain of truth.
4. Disk Models
The linear polarization of Pic’s disk can be explained by assuming a radial, power-law opacity distribution and the optical properties of Solar System dust grains, examples of which include the Zodiacal-light grains, interplanetary dust particles (IDPs), and cometary dust (Artymowicz, 1997). It is therefore useful to enquire whether the polarization signature measured in §3.2 can be described by such a model, and whether the differences between AU Mic and Pic (§3.1) can be attributed solely to different radial opacity distributions.
Suppose that the surface density of dust follows a power law, and the grain properties are uniform throughout the disk, such that the vertical optical depth to scattering presented by the grains is . The differential scattering cross section per unit solid angle of each dust grain is , where is the geometric grain radius and is the scattering efficiency. We use to denote either the or polarization states (with respect to the scattering plane), and indicates the dependence of the cross-section on the scattering angle. The phase function, , is normalized so that . For anisotropic particles, the cross-sections are functions of and . We assume isotropy, and ignore the azimuthal dependence, i.e., the grains are spherical, or randomly oriented.
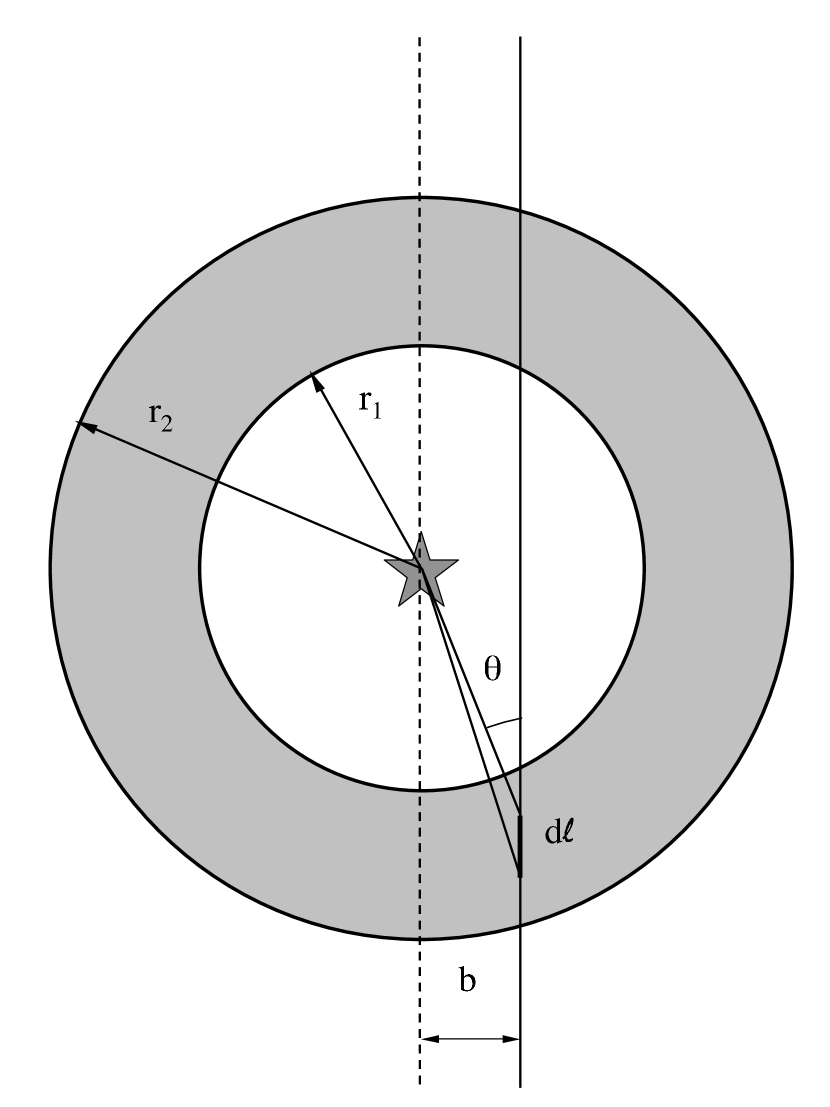
The observed one-dimensional surface brightness (cf. Eq. (5)) of an optically thin disk is expressed by an integral along the line of sight, ,
| (6) |
where is the monochromatic luminosity of the star at the observing frequency, is the radial coordinate, and and are the inner and outer radii of the disk (see Figure 5). This integral can be rewritten by change of variable to the scattering angle using and setting the limits of integration to and . Evaluation of the surface brightness for a disk with an inner hole, radius , is convenient using this form, because the integral can be written as the sum of two contributions from scattering angles between and and between and . The Stokes parameters are then calculated according to
| (7) |
According to this convention, the scattering plane (the disk) defines the axis. If the grains are asymmetric and their orientations are not random, or the disk is not exactly edge on then . However, there is no evidence from our current observations that this assumption is violated. As the disk is optically thin, multiple dust components can be represented by summing the contribution from different grain populations; such components may include grains of various sizes or composition.
4.1. A Henyey-Greenstein Model
We begin with a simple grain scattering model that illustrates both the feasibility of simultaneous fitting of the surface brightness and degree of polarization and the nature of the resultant constraints. Although any phase function can be written as a sum of Legendre polynomials, our goal is to construct a model with the minimum number of free parameters. Therefore, we adopt the empirical Henyey-Greenstein function as a convenient approximation to scattering by small particles (Henyey & Greenstein, 1941). We assume that the azimuthal dependence of polarization obeys a Rayleigh law, with peak linear polarization parameterized by . The corresponding elements of the intensity scattering matrix are given by
| (8) |
with , and
| (9) |
where for consistency with Eq. (7) the PA of the electric vector is measured from the scattering plane. For Rayleigh scattering , and . In the case of Mie scattering from dielectric spheres, Eqs. (8) and (9) are a satisfactory approximation for grains with . This recipe cannot describe a second peak at associated with enhanced backscatter or give polarization parallel to the scattering plane. Nonetheless, it has several desirable features: 1) there are only two adjustable grain parameters—the other model parameters are the normalization, the inner and outer disk radii, and the power law slope of the radial dust distribution; 2) the computational simplicity of evaluating Eqs. 8 and 9. This is a consideration as performing simultaneous, non-linear least-squares fits requires multiple () numerical evaluations of the integral in Eq. (6).
Figure 6 shows the least-squares fit to the Henyey-Greenstein model and Table 1 lists the fit parameters and goodness-of-fit, . The fit was found using Craig Markwardt’s constrained, non-linear least squares program, MPFIT222http://cow.physics.wisc.edu/$∼$craigm/idl/, which is implemented in the IDL programming language333http://www.ittvis.com. As we are fitting both the surface brightness and the polarization, the results of the fit depend on the relative weights attributed to each data set. For the current observations the errors in the surface brightness are smaller than for the fractional polarization. Therefore, we have assigned a minimum 10% fractional uncertainty to the surface brightness to reflect our prejudice that the polarization data carry significant information regarding the nature of the grains. This assumption is justified by noting that NE and SW wings of the disk are not identical—these local variations in the dust column, e.g., caused by density waves or the injection of fresh material, cannot be fit by our simple power law model, and therefore these deviations should not contribute to .
The fit achieves with degrees of freedom, which is gratifyingly good given that there are only six parameters. The model accurately reproduces the shape of the surface brightness profile, the steep rise in polarization between 20 and 40 AU, and is consistent, within the errors, with the leveling off at beyond this point. Key aspects of the fit include highly polarizing grains, , strong forward scattering, and an inner hole at AU. The quoted errors are only the formal errors and should be treated with some caution. For example, the best-fit value of is biased by the fact that our last data point lies at 80 AU. If the outer radius is held fixed at 200 AU, then increases to 1.76, which is unacceptable only at the 1- level and perhaps indicative that a single grain population cannot account for the scattered light from the entire disk. Back scattering, which is typical of particles with can be described by a simple extension of Eq. (8) to a two component Henyey-Greenstein function , where and . The introduction of two extra scattering parameters does not achieve an improved fit, and therefore we find no evidence for enhanced backscatter.
These disk models teach us that the radial dust distribution and the phase function are covariant if only Stokes is available. Evidently, a uniform disk with a high degree of forward scattering can mimic a disk with a steep decline in grain opacity that is combined with more isotropic scattering. The results of analyses that adopt a specific radial profile, e.g., by fixing , must be interpreted accordingly (e.g., Golimowski et al., 2006, on Pic.). For parameterized grain properties, e.g., Eqs. (8) and (9) this covariance remains. When a physical scattering model is adopted, which ties together and , and and are fitted simultaneously, then this degeneracy is broken.
4.2. A Zodiacal Dust Model
Now that we have shown that a simple model can reproduce the observations of the AU Mic disk we can ask whether grains with the optical scattering properties consistent with experimental studies of Solar System dust work too. We adopt Hong (1985)’s description of the scattering phase function inferred from the observed angular variation of the surface brightness and polarization of the Zodiacal light. Hong’s formulation is convenient because it represents the scattering characteristics of interplanetary particles as a three component linear combination of three Henyey-Greenstein functions.
This example reproduces the calculation that Artymowicz (1997) used to describe the polarization signature of Pic. There are now only four free parameters: the normalization of the vertical optical depth, the radii of the inner and outer holes and the power law index of the radial density distribution. Figure 6 shows that this model fits the surface brightness profile well, but fails to provide an adequate description of the measured polarization. Chi-squared for the combined data set is 6.29, which can be rejected with high confidence (99%). The Zodiacal dust model cannot explain the steep rise in polarization over the inner disk (20–50 AU) and it cannot account for the high polarization in the outer disk. The radial extent of the disk is similar to that of the Henyey-Greenstein model with an inner hole at AU. The disk terminates at = 90 AU. Since the scattering asymmetry parameter is fixed at the radial opacity distribution is steeper than in the Henyey-Greenstein model. A satisfactory fit to the polarization data cannot be found, even if we set the weights for the surface brightness to zero.
The lessons from these results are twofold. First, surface brightness data alone are insufficient to constrain grain optical properties and their radial distribution. Second, particles with the optical properties of Zodiacal grains cannot explain the polarization signature of AU Mic. Thus, the conclusions of the qualitative discussion in §3.2 are not fully borne out: simply changing the radial dust distribution does not explain the difference between Pic and AU Mic.

Choosing an alternate type of Solar System dust, e.g., cometary grains, does not significantly improve the discrepancy between the model and the polarization data because cometary dust does not have sufficiently high peak linear polarization. The dusty comets, of which Comet 1996 B2 (Hyakutake) is typical, show little dispersion in their polarizing properties. For example, the maximum degree of linear polarization of Comet 1996 B2 (Hyakutake) was observed to be 0.24 and 0.26 at 484 and 684 nm, respectively, at a phase angle near 94 degrees (Kiselev & Velichko, 1998).
4.3. Dielectric Spheres: Mie Theory
Several debris disk studies have used Mie theory to evaluate the complex elements of the amplitude scattering matrix (e.g., Voshchinnikov & Krügel, 1999; Krivova et al., 2000). Solar System dust particles are not spheres, and computing the cross sections using Mie theory may be misleading (cf. Gustafson, 1994). However, Zodiacal and cometary dust have too low a value of peak linear polarization to be consistent with the AU Mic data. As polarization efficiency increases with decreasing particle size, with Rayleigh scatterers representing the limiting case, it is worth investigating whether small dielectric spheres composed of common astrophysical material can be invoked. Perhaps erosion in AU Mic’s disk is so severe that the grains have been ground down to their constituent interstellar precursors? Since internal grain structure can be neglected as the Mie approximation should be sufficiently accurate to explore this possibility.
Mie models with small grains can explain the observed polarization. Adopting astronomical “silicate” () as the grain material yields a joint fit that is better than the Zodiacal dust model, but the best value of , is clearly unacceptable at a high level of confidence ( 99%). Other parameters are listed in Table 1. Most of the contributions to are from residuals relative to the surface brightness profile, which are attributable to grain scattering that is too isotropic. Only a narrow range of spherical particle sizes come close to approximating the data because the joint fit simultaneously constrains the phase function and the maximum polarization—quantities that vary rapidly with particle size. The best fit size parameter is for astronomical “silicate”, or m. Adopting dirty water-ice grains () reduces significantly, but not to an acceptable level. Organic refractory material (; Li & Greenberg, 1997) fares worse than either rock or ice.
| Model | ||||||
|---|---|---|---|---|---|---|
| Porous water icea | 3.02 | 53.1 | 177.8 | 0.94 | 0.81 | 1.6 |
| (0.5)b | (2.1) | (69.7) | ||||
| HGc | 0.90 | 38.0 | 92.5 | 0.53 | 0.68 | 1.7 |
| (0.25) | (0.5) | (4.7) | (0.02) | (0.01) | ||
| HGd | 2.47 | 41.6 | 200 | 0.62 | 0.71 | 1.8 |
| (0.13) | (0.4) | (0.03) | (0.01) | |||
| Water icee | 2.14 | 41.6 | 100.4 | 0.47 | 0.68 | 3.1 |
| (0.26) | (0.8) | (3.3) | ||||
| ISMf | 1.79 | 35.8 | 87.1 | 0.42 | 0.45 | 4.0 |
| (0.27) | (0.4) | (4.4) | ||||
| Silicateg | 1.37 | 34.1 | 85.9 | 0.38 | 0.59 | 4.4 |
| (0.26) | (0.5) | (3.3) | (0.04) | (0.01) | ||
| SS Zodih | 1.68 | 36.6 | 94.3 | 0.25 | 0.40 | 6.3 |
| (0.49) | (0.8) | (13.8) |
(a) Maxwell-Garnett/Mie model for porous water ice with .
The best fit porosity is .
The best fit grain size corresponds to ( nm diameter)
The peak linear polarization asymmetry parameter are
derived parameters.
(b) Formal 1- uncertainties are indicated in
parentheses. Derived parameters that are not
model parameters have a blank in the second row.
The use of “” implies
that the corresponding parameter is fixed.
(c) Single component Henyey-Greenstein model.
(d) Single component Henyey-Greenstein model with fixed.
(e) Single particle Mie model with best fit size parameter,
for solid “dirty ice” grains ().
(f) Interstellar dust model (White 1979).
(g) Single particle Mie model with best fit size parameter,
for solid “silicate” grains ().
(h) Solar System Zodiacal three-component Henyey-Greenstein dust model (Hong 1985).
The conclusion that varies significantly with choice of , the real part of the refractive index, suggests that it should be adopted as a fit parameter. Such models have six free parameters—the same as the Henyey-Greenstein model of §4.1. A satisfactory fit, with , is achieved for and (solid line in Fig. 6). Based on the value of , this low-index Mie fit is slightly better than the Henyey-Greenstein model, and this model is consistent with the disk extending beyond 200 AU. While our choice of the complex part of the refractive index is somewhat arbitrary, making the grains more or less absorbing does not qualitatively change our conclusions.
Using our best fit model we also investigate whether or not the inner disk () is dust free. By adding a parameter that describes an inner hole with constant vertical depth, we find that (99% confidence). The inner disk is devoid of micron-sized grains, which according to the Strubbe & Chiang (2005) model means that collisions dominate, i.e., this is a “Type B” disk where grains that are dragged inward by corpuscular and Poynting-Robertson drag undergo a destructive collision.
5. Discussion
Figure 6 and the corresponding fit parameters in Table 1 demonstrate that a variety of radial grain distributions can account for the observed surface brightness, although a large inner hole with radius of 40–50 AU is common to all models. Taken together, the surface brightness and degree of linear polarization narrow down the range of acceptable grain optical properties. Inspection of Figure 7 shows that a combination of strong forward scattering and a high polarizing efficiency, with a Rayleigh-like angular variation is sufficient to describe these data. Our analysis implies with high confidence that the constituent dust grains exhibit high maximum linear polarization () and strong forward scattering ().
Plots of the phase function and polarization fraction versus phase angle shown in Figure 7 help highlight the common features of the statistically acceptable Henyey-Greenstein and low-index Mie models, and how their scattering properties differ from conventional rocky or ice-grain models. Large rocky or icy grains typically have strong forward scattering, but polarization which oscillates with phase angle. Therefore, tends to average to zero along a line of sight that integrates over a range of scattering angles (refer to §3.1). As the conventional Mie fit shows, small grains are good polarizers, but scatter too isotropically to be consistent with the data. The low index Mie model suggests a physical scenario that combines strong forward scattering and high polarization.
Application of the Clausius-Mossotti relation (Jackson, 1962) implies that such a low value of must be associated with a very porous medium—the only terrestrial analog that comes to mind is silica aerogel. Aerogels are transparent, highly porous materials of low density, ranging from 0.05 to 0.15 g cm-3, with a corresponding refractive index of 1.01 to 1.04, respectively. Aerogel has porosity on a micron scale and is composed of individual silica grains with diameters of 10 nm, which are linked in a highly porous dendritic backbone. Although aerogel is produced in a process that is unlikely to occur in an astrophysical setting—hydrolysis of methyl silicate in the presence of a solvent (ethanol) that is subsequently evaporated at high temperature and pressure—the comparison is not entirely frivolous. The appearance of aerogel is often characterized as “solid blue smoke”, because to a good approximation the scattering is Rayleigh scattering (Kamiuto et al., 1993). Thus, aerogel is an example of a bulk material that interacts with electromagnetic radiation in a way that is determined by its microscopic structure.
Allowing the real part of the refractive index to vary as described in §4.3 while holding the imaginary part fixed violates the Kramers-Kronig relation. An approach that has a better physical basis is to use an effective medium theory to compute the optical behavior of a porous particle described as vacuum matrix () with embedded inclusions (Kruegel, 2003). Using the Maxwell-Garnett rule we can choose a refractive index for the bulk material and use the grain porosity as a model parameter. The best-fit porous grain model (see Fig. 6 and the first line of Table 1) is practically identical to the variable index fit, yielding essentially the same structural parameters. The grain porosity is 91–94%, depending on whether we assume that the matrix from which our grains are made is ice or rock.


As our aerogel analogy reminds us, porous materials are likely highly anisotropic, and we may not be free to assume that we can neglect the effects of nearest neighbors within the matrix. We therefore examine the results of numerical calculations (e.g., discrete-dipole approximation and transition-matrix) of light scattering by aggregates to understand whether or not our interpretation of the Mie results in terms of porous grains is credible.
A lucid exposition of the transition-matrix method applied to composite interstellar grains is given by Iatì et al. (2004). Using this method Petrova et al. (2000) show results for two instances of silicate () grain clusters consisting of 31 particles or “monomers” each with . A relatively compact aggregate with approximately 70% porosity has and . The more porous particle (81%) has and . In neither case does the degree of polarization oscillate with phase angle. These clusters have optical properties which make them promising analogs of the material inferred to dominate the AU Mic disk.
Kimura et al. (2006) present additional results for larger, more porous aggregates. Figure 8 shows the phase function and polarization for a large () porous (90%) silicate cluster () composed of 128 small () monomers. This particle has and , and has optical properties which make it an excellent candidate material for the AU Mic disk. Also shown is the corresponding Mie calculation with dielectric properties derived using the Clausius-Mossotti relation. It is evident that the Mie calculation is only a rough approximation—the polarization curve is reasonably well reproduced, and is overestimated by about 15%. Although the qualitative conclusion that implicates porous grains is secure it seems unlikely that the accuracy of effective medium theories is sufficient, for example, to distinguish between different coagulation schemes that are characterized by different porosity. It will be necessary to abandon Mie theory in favor of numerical modeling of aggregate scattering in the next stage of debris disk modeling.
If highly porous aggregate grains explain the polarization signature of AU Mic’s debris disk, and if the dust beyond AU originates from a “birth ring” of parent bodies 10 cm in size, as envisioned by Strubbe & Chiang (2005), then this porosity may be a signature of the agglomeration process whereby interstellar grains first grew into macroscopic sized objects. In the inner Solar System porous particles occur naturally in cometary dust, where the sublimation of ices leaves a “bird’s nest” of refractory organic and silicate material (Greenberg & Hage, 1990). Porous grains in the Pic disk may originate from cometary activity (Li & Greenberg, 1997). However, the birth ring in AU Mic lies safely outside the 1 AU ice sublimation point. Based on collisional lifetime arguments, the size of the parent-bodies that supply the observed dust in AU Mic is in the decimeter range (Strubbe & Chiang, 2005). Though the existence of larger bodies that will suffer compaction and restructuring (Blum & Wurm, 2000) is not excluded, they are not the dominant reservoir for dust observed at optical and near-infrared wavelengths. Evidently, shock compression during attrition of the parent bodies in the birth ring is not significant. We envision these bodies as so weakly bound that even the most glancing collisions lead to their disruption. Recent laboratory studies of particle coagulation in the proto-solar nebula by ballistic cluster-cluster aggregation (Wurm & Blum, 1998) leads to the formation of highly (90%) porous aggregates. Our evidence suggests that such a process may have mediated the initial growth of planetesimals.
Observations of scattered light at a single wavelength are primarily sensitive to grains with , and do not place strong constraints on the particle size distribution. However, preliminary calculations show that the measured polarization is consistent with a Dohnanyi spectrum (Fitzgerald et al. (2006) and L. E. Strubbe 2006, private communication). Polarization measurements in the UV through the near-infrared could be used to measure grain porosity as a function of grain size.

6. Summary
We have observed the AU Mic debris disk at F606W (broad ) with the POLV polarizing filter set in ACS high resolution camera aboard HST. The coronagraph and PSF subtraction were used to suppress scattered light. The disk light is polarized, with the degree of linear polarization rising steeply from 0.05 to 0.35 between 20 and 50 AU and reaching a maximum of about 0.40 within 80 AU. The inner and outer working limits are set by systematic errors in PSF subtraction and declining SNR, respectively. The linear polarization is oriented with the electric field perpendicular to the disk, which is characteristic of scattering by optically thin, small grains.
We have factored systematic errors in the ACS polarization measurements into our uncertainties. For the bright, strongly polarized emission between 35 and 55 AU these errors and not measurement errors dominate. However, the ACS/HRC polarization calibration campaign is on-going, and analysis of the resultant data, including a full Mueller matrix description for the HRC+F606W+POLV combination (cf. the Hines et al. (2000) analysis of NICMOS) and application to this data set will improve the reliability and fidelity of these results.
AU Mic and Pic have different polarization signatures. Pic shows a shallower gradient and lower peak in polarization fraction. We attribute this different to two factors: 1) the two disks are probed on different spatial scales relative to their inner and outer boundaries; 2) the grains in the AU Mic disk have a higher peak linear polarization than those of Pic. We place limits on the radial distribution of grains and their optical scattering properties by performing simultaneous fits to the observed surface brightness and the degree of polarization. These fits show that the inner boundary of the AU Mic disk is located between 40–50 AU, and the dust component which is responsible for the strong linear polarization extends to 100–150 AU. The uncertainty occurs primarily because the inferred spatial structure of the disk and the grain optical properties—the scattering asymmetry factor and the peak linear polarization —are covariant if and are independent. We can state with good confidence that and . The inner disk is virtually free of micron-sized grain, and Type B conditions prevail (cf. Strubbe & Chiang, 2005).
This combination of optical properties occurs naturally in porous media. Once we adopt a physical description for the electromagnetic properties of the scatterers, and are not independent and the covariance with the radial dust distribution is greatly reduced. Our best fit physical model, which invokes Mie theory and low index grains, implies that the inner regions of the AU Mic disk ( 50 AU) are depleted of small grains. This finding lends support to the Strubbe & Chiang (2005) birth ring.
The best fit, porous grain model using Mie theory and the Maxwell-Garnett rule implies a grain porosity of 91–94%, depending on whether the grain matrix is ice or rock. Porous grains are a natural consequence of particle growth. However, the accuracy of the effective medium theory, which we used to convert the dielectric constant into a porosity, is probably insufficient to favor one growth mechanism over another, e.g., cluster-cluster vs. cluster-particle agglomeration. Better approximations for calculating the optical properties of clusters, e.g., the discrete-dipole approximation or the transition matrix method must be employed.
References
- Artymowicz (1997) Artymowicz, P. 1997, Annual Review of Earth and Planetary Sciences, 25, 175
- Augereau & Beust (2006) Augereau, J. C. & Beust, H. 2006, ArXiv Astrophysics e-prints
- Aumann et al. (1984) Aumann, H. H., Beichman, C. A., Gillett, F. C., de Jong, T., Houck, J. R., Low, F. J., Neugebauer, G., Walker, R. G., & Wesselius, P. R. 1984, ApJ, 278, L23
- Backman & Paresce (1993) Backman, D. E. & Paresce, F. 1993, in Protostars and Planets III, ed. E. H. Levy & J. I. Lunine, 1253–1304
- Barrado y Navascués et al. (1999) Barrado y Navascués, D., Stauffer, J. R., Song, I., & Caillault, J.-P. 1999, ApJ, 520, L123
- Biretta & Kozhurina-Platais (2004) Biretta, J. & Kozhurina-Platais, V. 2004, ACS Polarization Calibration—II. The POLV Filter Angles: ACS 2004-10 (Baltimore: Space Telescope Science Institute)
- Biretta et al. (2004) Biretta, J., Kozhurina-Platais, V., Boffi, F., Sparks, W., & Walsh, J. 2004, ACS Polarization Calibration—I. Introduction and Status Report: ACS 2004-09 (Baltimore: Space Telescope Science Institute)
- Blum & Wurm (2000) Blum, J. & Wurm, G. 2000, Icarus, 143, 138
- Chandrasekhar (1960) Chandrasekhar, S. 1960, Radiative transfer (New York: Dover, 1960)
- Chen et al. (2005) Chen, C. H., Patten, B. M., Werner, M. W., Dowell, C. D., Stapelfeldt, K. R., Song, I., Stauffer, J. R., Blaylock, M., Gordon, K. D., & Krause, V. 2005, ApJ, 634, 1372
- Evans et al. (1957) Evans, D. S., Menzies, A., & Stoy, R. H. 1957, MNRAS, 117, 534
- Fitzgerald et al. (2006) Fitzgerald, M. P., Kalas, P. G., Duchêne, G., Pinte, C., & Graham, J. R. 2006, to be submitted to ApJ, 000, 000
- Ford et al. (2003) Ford, H. C., Clampin, M., Hartig, G. F., et al. 2003, in Future EUV/UV and Visible Space Astrophysics Missions and Instrumentation. Edited by J. Chris Blades, Oswald H. W. Siegmund. Proceedings of the SPIE, Volume 4854, pp. 81-94 (2003)., ed. J. C. Blades & O. H. W. Siegmund, 81–94
- Gledhill et al. (1991) Gledhill, T. M., Scarrott, S. M., & Wolstencroft, R. D. 1991, MNRAS, 252, 50P
- Golimowski et al. (2006) Golimowski, D. A., Ardila, D. R., Krist, J. E., Clampin, M., Ford, H. C., Illingworth, G. D., Bartko, F., Benítez, N., Blakeslee, J. P., Bouwens, R. J., Bradley, L. D., Broadhurst, T. J., Brown, R. A., Burrows, C. J., Cheng, E. S., Cross, N. J. G., Demarco, R., Feldman, P. D., Franx, M., Goto, T., Gronwall, C., Hartig, G. F., Holden, B. P., Homeier, N. L., Infante, L., Jee, M. J., Kimble, R. A., Lesser, M. P., Martel, A. R., Mei, S., Menanteau, F., Meurer, G. R., Miley, G. K., Motta, V., Postman, M., Rosati, P., Sirianni, M., Sparks, W. B., Tran, H. D., Tsvetanov, Z. I., White, R. L., Zheng, W., & Zirm, A. W. 2006, AJ, 131, 3109
- Greenberg & Hage (1990) Greenberg, J. M. & Hage, J. I. 1990, ApJ, 361, 260
- Gustafson (1994) Gustafson, B. A. S. 1994, Annual Review of Earth and Planetary Sciences, 22, 553
- Heiles (2000) Heiles, C. 2000, AJ, 119, 923
- Henyey & Greenstein (1941) Henyey, L. G. & Greenstein, J. L. 1941, ApJ, 93, 70
- Hines et al. (2000) Hines, D. C., Schmidt, G. D., & Schneider, G. 2000, PASP, 112, 983
- Hong (1985) Hong, S. S. 1985, A&A, 146, 67
- Iatì et al. (2004) Iatì, M. A., Giusto, A., Saija, R., Borghese, F., Denti, P., Cecchi-Pestellini, C., & Aiello, S. 2004, ApJ, 615, 286
- Jackson (1962) Jackson, J. D. 1962, Classical Electrodynamics (Classical Electrodynamics, New York: Wiley, 1962)
- Kalas et al. (2005) Kalas, P., Graham, J. R., & Clampin, M. 2005, Nature, 435, 1067
- Kalas et al. (2004) Kalas, P., Liu, M. C., & Matthews, B. C. 2004, Science, 303, 1990
- Kamiuto et al. (1993) Kamiuto, K., Saitoh, S., & Tokita, Y. 1993, J. Quant. Spectrosc. Radiar. Transfer, 50, 293
- Kimura et al. (2006) Kimura, H., Kolokolova, L., & Mann, I. 2006, A&A, 449, 1243
- Kiselev & Velichko (1998) Kiselev, N. N. & Velichko, F. P. 1998, Icarus, 133, 286
- Kozhurina-Platais & Biretta (2004) Kozhurina-Platais, V. & Biretta, J. 2004, ACS Polarization Calibration—III. Astrometry of Polarized Filters: ACS 2004-11 (Baltimore: Space Telescope Science Institute)
- Krist et al. (2005) Krist, J. E., Ardila, D. R., Golimowski, D. A., Clampin, M., Ford, H. C., Illingworth, G. D., Hartig, G. F., Bartko, F., Benítez, N., Blakeslee, J. P., Bouwens, R. J., Bradley, L. D., Broadhurst, T. J., Brown, R. A., Burrows, C. J., Cheng, E. S., Cross, N. J. G., Demarco, R., Feldman, P. D., Franx, M., Goto, T., Gronwall, C., Holden, B., Homeier, N., Infante, L., Kimble, R. A., Lesser, M. P., Martel, A. R., Mei, S., Menanteau, F., Meurer, G. R., Miley, G. K., Motta, V., Postman, M., Rosati, P., Sirianni, M., Sparks, W. B., Tran, H. D., Tsvetanov, Z. I., White, R. L., & Zheng, W. 2005, AJ, 129, 1008
- Krivova et al. (2000) Krivova, N. A., Krivov, A. V., & Mann, I. 2000, ApJ, 539, 424
- Kruegel (2003) Kruegel, E. 2003, The physics of interstellar dust (The physics of interstellar dust, by Endrik Kruegel. IoP Series in astronomy and astrophysics, ISBN 0750308613. Bristol, UK: The Institute of Physics, 2003.)
- Kundu et al. (1987) Kundu, M. R., Jackson, P. D., White, S. M., & Melozzi, M. 1987, ApJ, 312, 822
- Larwood & Kalas (2001) Larwood, J. D. & Kalas, P. G. 2001, MNRAS, 323, 402
- Li & Greenberg (1997) Li, A. & Greenberg, J. M. 1997, A&A, 323, 566
- Liu (2004) Liu, M. C. 2004, Science, 305, 1442
- Liu et al. (2004) Liu, M. C., Matthews, B. C., Williams, J. P., & Kalas, P. G. 2004, ApJ, 608, 526
- Metchev et al. (2005) Metchev, S. A., Eisner, J. A., Hillenbrand, L. A., & Wolf, S. 2005, ApJ, 622, 451
- Pavlovsky (2006) Pavlovsky, C. 2006, ACS Data Handbook, Version 5.0 (Baltimore: Space Telescope Science Institute)
- Petrova et al. (2000) Petrova, E. V., Jockers, K., & Kiselev, N. N. 2000, Icarus, 148, 526
- Pettersen & Hsu (1981) Pettersen, B. R. & Hsu, J.-C. 1981, ApJ, 247, 1013
- Saar et al. (1994) Saar, S. H., Martens, P. C. H., Huovelin, J., & Linnaluoto, S. 1994, A&A, 286, 194
- Schmidt et al. (1992) Schmidt, G. D., Elston, R., & Lupie, O. L. 1992, AJ, 104, 1563
- Strubbe & Chiang (2005) Strubbe, L. E. & Chiang, E. I. 2005, ArXiv Astrophysics e-prints
- Tamura et al. (2006) Tamura, M., Fukagawa, M., Kimura, H., Yamamoto, T., Suto, H., & Abe, L. 2006, ApJ, 641, 1172
- van de Hulst (1981) van de Hulst, H. C. 1981, Light scattering by small particles (New York: Dover, 1981)
- Voshchinnikov & Krügel (1999) Voshchinnikov, N. V. & Krügel, E. 1999, A&A, 352, 508
- Wolstencroft et al. (1995) Wolstencroft, R. D., Scarrott, S. M., & Gledhill, T. M. 1995, Ap&SS, 224, 395
- Wurm & Blum (1998) Wurm, G. & Blum, J. 1998, Icarus, 132, 125
- Zuckerman et al. (2001) Zuckerman, B., Song, I., Bessell, M. S., & Webb, R. A. 2001, ApJ, 562, L87