Gemini Near Infrared Integral Field Spectroscopy of the Narrow-Line Region of ESO 428-G14: kinematics, excitation and the role of the radio jet
Abstract
We present two-dimensional (2D) gas kinematics and excitation of the inner 300 pc of the Seyfert galaxy ESO 428-G14 at a sampling of 14 pc2, from near-infrared spectroscopic observations at R6000 obtained with the Integral Field Unit of the Gemini Near-Infrared Spectrograph. From measurements of fluxes and profiles of the emission lines [Fe ii]m, Pa, Hm and Br, we construct 2D maps of line intensities and ratios, radial velocities and velocity dispersions. Emission lines “tomography” is provided by velocity slices obtained across the line profiles, a unique capability of IFUs, which allows the mapping of not only of peak velocities but including also the wings. We compare these maps with a previously published high spatial resolution radio map and find a tight relation between the radio structure and the emission-line flux distributions and kinematics, revealing that the radio-jet plays a fundamental role not only in shaping the NLR but also in the imprint of its kinematics. Blueshifts of up to 400 km s-1 and velocity dispersions of up to 150 km s-1 are observed in association with the radio jet at position angle PA = 129∘, which is also the PA of the photometric major axis of the galaxy. We conclude that the radio jet is launched at a small angle relative to the galactic plane, with the NW side slightly oriented toward us. This angle is small enough for the radio jet to shock and compress the gas in the plane of the galaxy, and for the nuclear continuum to ionize and heat it. The distinct kinematics and flux distributions observed for the different emission lines suggest different origins for their emission. The [Fe ii] shows the largest blueshifts and velocity dispersions and its flux distribution is concentrated along the jet, while the H2 shows the lowest velocity dispersions and has additional flux contribution from regions beyond the jet. Both X-rays emitted by the active galactic nucleus and shocks produced by the radio jet can excite the H2 and [Fe ii] emission lines. We use the 2D velocity dispersion maps to estimate upper limits to the contribution of the radio jet to the excitation of [Fe ii] and H2 which may reach 90% for [Fe ii] and 80% for H2 in the jet region. The [Fe ii]/Pa emission-line ratios and the association of the [Fe ii] flux distribution and kinematics with the radio structure supports a stronger contribution of the radio jet to the [Fe ii] excitation than to that of H2. In the regions beyond the jet the observations favor X-ray excitation.
keywords:
galaxies: Seyfert - infrared: galaxies - radio continuum: galaxies.1 Introduction
The Narrow-Line Region (NLR) of Seyfert galaxies is one of the best probes of the mechanisms in operation in the surrounding of accreting supermassive black holes in galaxies. The excitation and dynamics of the inner NLR gas can reveal how radiation and mass outflows from the nucleus interact with circumnuclear gas. Until recently, the measurement of these properties had to rely on either narrow-band images (e.g. Wilson et. al., 1993; Capetti et al., 1996; Schmitt & Kinney, 1996) or long-slit spectroscopy. Long-slit spectroscopic studies provide information on the origin and excitation of the emission lines (e.g. Veilleux, Goodrich & Hill, 1997; Rodríguez-Ardila, Riffel & Pastoriza, 2005) as well as on the gas kinematics (e.g. Winge et. al., 1997, 1999; Crenshaw & Kraemer, 2000; Hutchings et al., 1998; Kaiser et al., 2000; Nelson et al., 2000), but are restricted to the locations covered by the long-slit.
Mulchaey, Wilson & Tsvetanov (1996) and Ferruit, Wilson & Mulchaey (2000) have shown that obscuration can affect the optical morphology of the emitting gas region, a problem that can be alleviated by using infrared lines to map the NLR. Relevant emission-lines in the near-IR include [Fe ii]1.257m and 1.644m, HI lines such as Pa and Br and molecular hydrogen lines such as H1.957m and H2.121m, which can be used to map the gas kinematics and excitation (Storchi-Bergmann et al., 1999; Winge et al., 2000).
Studies based on the above lines (Forbes & Ward, 1993; Blietz et al., 1994) have revealed a correlation between the [Fe ii] and the radio emission, indicating that shock excitation by the radio jets is a likely mechanism for production of the [Fe ii] emission in these objects, although other works have favoured photoionization by the nuclear source (Simpson et al., 1996; Das et al, 2005, 2006). H2 emission is also strong in AGNs (e.g. Veilleux, Goodrich & Hill, 1997; Rodríguez-Ardila et al., 2004; Rodríguez-Ardila, Riffel & Pastoriza, 2005) and can be used to probe the distribution of warm molecular gas. To further progress in this area and investigate the origin of the near-IR emission lines it is necessary to spatially resolve the kinematics and excitation of the emitting gas.
The multiplexing capability necessary to map, simultaneously, the gaseous distribution, excitation and kinematics at such small scales with sufficient spectral resolution is now provided by the integral field units (IFU) in operation in large telescopes. In this work we use the IFU of the Gemini Near-Infrared Spectrograph which provides two dimensional (hereafter 2D) mapping in the near-IR (thus minimizing the effect of reddening) to study the circumnuclear emitting gas of the Seyfert galaxy ESO 428-G14. We present 2D flux, radial velocity and velocity dispersion maps in four strong emission lines: [Fe ii]m, Pam, Hm and Brm. The R6000 spectral resolution has allowed us also to obtain velocity slices across the emission-line profiles in order to better probe the velocity fields.
We present in addition broad-band J and K images and a narrow-band image in the line [Fe ii]m obtained with the CTIO Blanco Telescope. We explore the relation between reconstructed images in the near-IR emission lines, their kinematic maps, the narrow-band [Fe ii] image and previously published optical [O iii] narrow-band and radio images, in order to investigate the excitation mechanism of the near-IR lines, in particular [Fe ii] and H2.
ESO 428-G14 is an S0 galaxy which was classified as Seyfert 2 by Bergvall, Johansson & Olofsson (1986). High resolution VLA maps show predominantly a two-sided and asymmetric radio jet oriented approximately along the galaxy line of nodes at position angle PA, in which the NW side is less extended and terminates in a bright hot spot at 075 from the nucleus, while to the SE the radio emission is fainter, the jet bends to N and its extent is at least three times longer (Ulvestad & Wilson, 1989; Falcke et al., 1996; Falcke, Wilson & Simpson, 1998). [O iii] and H+[N ii] images obtained with the Hubble Space Telescope show extended emission well aligned with the radio jet with stronger emission to the NW as observed in the radio. The ratio [O iii]/(H+[N ii] ) shows a bipolar structure with larger values to the SE (Falcke et al., 1996; Falcke, Wilson & Simpson, 1998). We adopt a distance for this galaxy of 19 Mpc (Falcke et al., 1996) for which 1′′ corresponds to 92 pc at the galaxy.
This paper is organized as follows: in Section 2 we describe the observations and data reduction. In Section 3 we present the near-IR spectra and images, a comparison with previous optical narrow-band and radio images and the kinematics of the gas. In Section 4, we discuss the results and their implications for the origin of the [Fe ii] and H2 emission and in Section 5 we present the conclusions of this work.
2 Observations and Reductions
2.1 Integral Field Spectroscopy
The spectroscopic data were obtained with the Gemini Near Infra-Red Spectrograph (GNIRS) (Elias et al., 1998) Integral Field Unit (IFU) in December 2004 under the instrument science verification program GS-2004B-SV-26, and comprise two sets of observations centred at =2.21m and 1.27m. We have used the 111 l/mm grating with the Short Blue Camera (015/pixel) which gives a resolving power of R=5900. The GNIRS IFU has a rectangular field of view, of approximately 32 48, divided into 21 slices. At the detector, the slices are divided along their length into 015 square IFU elements. For our observations, the major axis of the IFU was oriented along the PA , which is the orientation of the radio jet. The observing procedure followed the standard Object–Sky–Sky–Object dither sequence, with off-source sky positions since the target is extended, and individual exposure times of 600s. One of the IFU slicing mirrors was damaged during assembly and presents a lower (20% of the nominal value) transmission region, about 18 in length, offset 05 from the center, therefore small spatial offsets in both directions were added between exposures to “fill in” the signal in this region. Telluric standard stars were observed immediately after the target. The basic observing information is shown in Table 1. Conditions during the observations were good for the night of Dec. 27 (clear skies, image quality (IQ) 060), and patchy clouds (but stable guide counts) with similar IQ for the Dec. 28 dataset.
The data reduction was accomplished using tasks contained in GNIRS package which is part of the GEMINI IRAF package as well as generic IRAF tasks. Through the reduction tasks we have performed trimming, flat-fielding, sky subtraction, wavelength and s-distortion calibrations. We have also removed the telluric bands and flux calibrated the frames using the star HR4023 (A2V spectral type) as a “relative” flux standard. The cosmic ray cleaning was done before the sky subtraction using the algorithm described by van Dokkum (2001). In Fig. 1 we present the nuclear spectra and the spectra at 08 NW from the nucleus, which is the position of the peak of the radio continuum emission within an aperture of 045 diameter.
| Instrument/ | Date | Total Exp. | ||
|---|---|---|---|---|
| Telescope | (UT) | Filter | time (s) | |
| GNIRS/Gemini | 2004/12/27 | K-G0503 | 2400 | |
| GNIRS/Gemini | 2004/12/28 | J-G0505 | 1200 | |
| OSIRIS/Blanco | 2000/02/15 | K | 80 | |
| J | 80 | |||
| 1.06 | 270 | |||
| [Fe ii] 1.257 | 1800 |
2.2 Imaging
Broad-band J and K images and narrow band images centered on the emission line [Fe ii] and adjacent continuum were obtained in February 2000 at the Cerro Tololo Interamerican Observatory (CTIO) using the 4-m Blanco telescope. The observations were performed with the infrared imager/spectrometer OSIRIS using a 1024 1024 HgCdTe array at an angular scale of 016 pix-1. Details of the observations are presented in Table 1. The angular resolution was 08-09 (FWHM of standard star images).
The observing procedure consisted of taking a sequence of 4–9 dithered images on source with sky images taken before or after the object sequence. Individual sky and object images were first divided by the flat-field. We then median combined the sky images and subtracted them from the corresponding object images. The individual images in the same filter were then aligned using as many common point sources (stars and the nucleus) as possible and finally averaged. We have used the task imcoadd from the GEMINI package to perform this alignment/averaging procedure.
Photometric calibration was performed for both broad and narrow band filters using standard stars. Correction for extinction was performed using the mean extinction coefficients for February (Frogel, 1998).
The narrow band [Fe ii] image was calibrated by multiplying each filter transmission curve by the black body spectrum corresponding to the associated standard star spectral type and then using this integrated flux as the flux of the standard star in the filter. After calibration, the emission line image was created by subtracting the aligned continuum image (Filter 1.06m) from the continuum plus emission line image.

3 Results
In this section we discuss the morphology of the narrow-band [Fe ii] image and the color map constructed from the broad band images, comparing our data with narrow-band optical [O iii] and radio images available from previous studies. We also present the 2D maps obtained from the IFU spectroscopy: emission-line distributions and ratios, velocity field and velocity dispersion maps.
3.1 Images
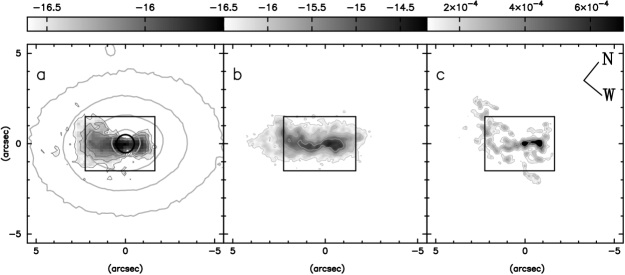
Narrow-band [Fe II] image: In panel a of Fig. 2 we present our [Fe ii] image which shows emission extended by 3″ to the SE and 15 to NW along PA. For comparison, we show also in Fig. 2 an HST narrow band [O iii] image (panel b) as well as a radio 2-cm image (panel c), both from Falcke et al. (1996). The [Fe ii] image shows a double “V”-shaped morphology, possibly indicative of a bi-cone. There is also morphological correlation between [Fe ii] and both the [O iii] and radio 2-cm emission. Falcke et al. (1996) present, in addition, an H map which shows a similar morphology. The integrated [Fe ii] flux within a 5″ radius is erg s-1 cm-2.
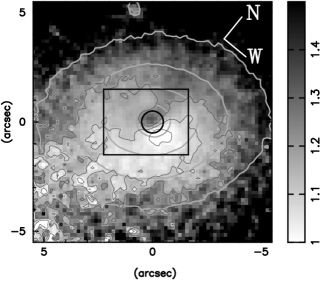
Colour map (J-K): The colour map of the inner 10″ 10″ region of the galaxy is shown in Fig. 3. The main feature is a colour gradient from to the SW to to the NE. is the color of a late-type stellar population characteristic of galaxy bulges. Assuming that the redder color is due to obscuration by dust, we estimate an average reddening mag for the NE side. This result also suggests that the NE is the near side of the galaxy, where dust in the galaxy disk obscures the light from the bulge. In addition, there is a red feature extending from the nucleus to the N, possibly due to a dust lane. We estimate mag for this feature. The orientation of the photometric major axis obtained from the J-band image is 129 2.
3.2 2D intensity maps
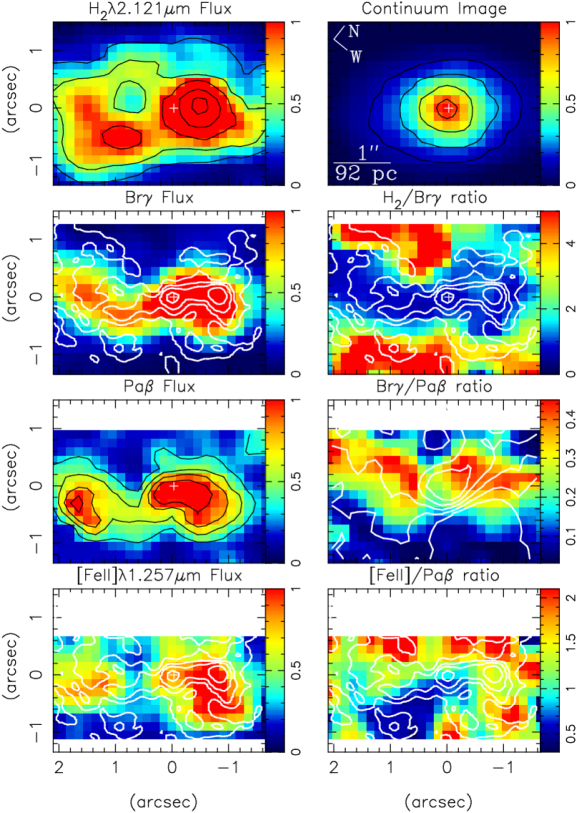
The final IFU data cube contains 520 spectra, each covering 015 015, corresponding to 14 pc2 at the galaxy. The total IFU field of 3930 thus corresponds to a region of dimensions 360 pc275 pc at the galaxy. We fitted Gaussian profiles to the [Fe ii], H, Pa and Br emission lines in order to obtain the integrated fluxes, radial velocities (from the peak wavelengths of the lines) and velocity dispersions (from the widths of the lines). A m continuum image was obtained from the interpolation of the continuum under the H emission line.
In Fig. 4 we present the 2D maps of the near-IR continuum flux and emission line intensities in arbitrary units, with mean uncertainties of 5, 12, 15 and 17% for H, Br, Pa and [Fe ii], respectively. In the same figure we also present the H2/Br, Br/Pa and [Fe ii]/Pa line ratios. The nucleus in these maps is defined as the peak of the continuum light distribution and is identified by the white cross in each panel of Fig. 4. In order to investigate the relation between the radio and near-IR emission, we have overlaid contours of the radio 2 cm continuum emission from Falcke, Wilson & Simpson (1998) on the Br and [Fe ii] intensity maps as well as on the line ratio maps. In order to align the radio image with our images, we have adopted as the nucleus in the radio map the peak just to the left of the hot spot, as in Fig. 2, which we then registered to the peak of our continuum image. This was also done by Falcke et al. (1996) for registering their optical and radio images. They claim that the uncertainty between the relative position of the nucleus in the optical and radio bands is 02. In our case, the uncertainty may be smaller, due to the smaller effect of reddening in the near-IR relative to the optical, but 02 corresponds to only one pixel of our data, thus we may consider such small difference as a coincidence when comparing our images with the radio images.
The H2 intensity could be measured over most of the IFU field, while there was not enough signal to measure the Br and Pa in a few lines close to the top and bottom edges ( 15 from the nucleus). The [Fe ii] emission-line could only be measured over the inner 19 along the minor axis of the IFU field, and thus the corresponding map covers a smaller region than those in the other emission lines. All emission lines are most extended along PA, which is the orientation of the radio jet (and galaxy line of nodes), and present a bipolar structure extended to both sides of the nucleus, in good agreement with our narrow-band [Fe ii] image, and with both the [O iii] and radio continuum images presented in Fig. 2. The overlaid contours of the radio continuum image on the Br and [Fe ii] emission-line maps show a detailed correspondence between the radio and emission-line structures: the strongest line-emission is observed to the NW, and approximately coincides with the strongest emission in radio; the emission-line distribution to the SE bends to the NE, as also observed in the radio map. The peak of line emission is nevertheless a bit displaced from the radio emission peak: the line emission peaks at 06 NW while the radio emission peaks at 08 NW from the nucleus.
A comparison between the emission-line maps of the H i with that of [Fe ii] shows that the latter has the strongest emission displaced to the NW relative to the H i emission, tracing the structure of the radio hot spot which bends to the W.
In the case of the H2 emission map, although the above bipolar structure is also observed, there is additional emission at the lowest intensity levels extended beyond the bipolar structure.
3.3 Line ratio maps
In order to investigate the main excitation mechanisms of H2 and [Fe ii], we have constructed the line-ratio maps [Fe ii]/Pa and H2/Br shown in Fig. 4. The uncertainties on these ratios range from 0.2 at the nucleus to 0.7 at the top and bottom borders of the IFU field for the first ratio and from 0.1 to 0.9 for the second. The uncertainties are thus quite large at the top and bottom regions of the line ratio maps. We have overlaid the radio contours also on the line ratio maps. Along the radio structure, the ratio H2/Br is approximately constant, with a value 0.8 0.1. Outside the radio emission region, the H2/Br ratio increases, reaching values of 5.3 0.9 at 12 from the nucleus in the direction perpedicular to the radio axis. The ratio [Fe ii]/Pa is 0.9 0.3 at the nucleus, and increase up to 1.5 at the borders of the radio structure, except to the South of the nucleus, where it reaches the lowest value of 0.5 0.2. From the emission-line maps, it can be observed that this region presents faint levels of both [Fe ii] and radio emission.
We have constructed also the line ratio map Br/Pa, which can be used as a reddening indicator. As we do not have a relative calibration between the and bands, this map can only be used to investigate the relative reddening distribution. The lowest ratios are observed to the SW, while the highest ratios are observed to the NE, the transition occurring approximately at the major axis of the galaxy. This behaviour is the same as the one observed in the map of Fig. 3, suggesting that the line emission is subject to the same extinction as the continuum, with the NE more reddened than the SW side, consistent with the NE being the near side of the galaxy. In order to evidence this, we have overlaid the contours of Fig. 3 on the Br/Pa ratio map, showing that the reddest values correspond to the highest Br/Pa ratios.
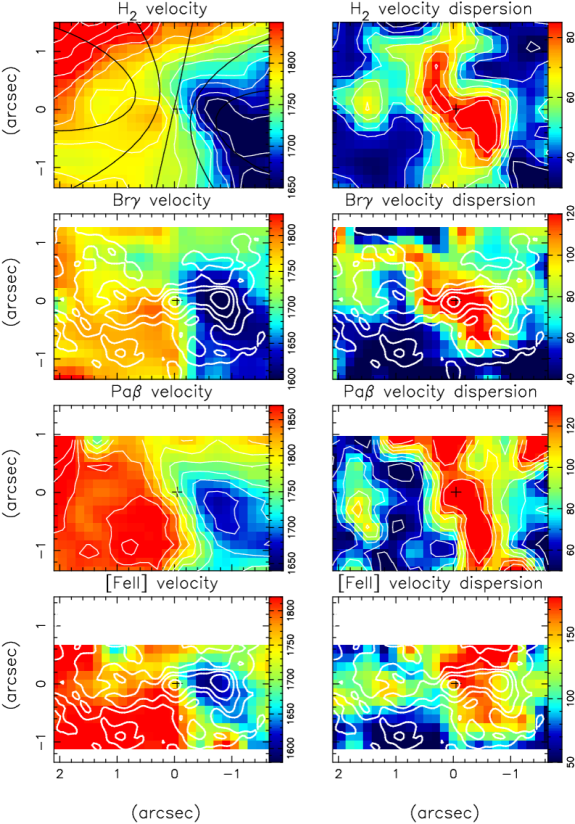
3.4 Gaseous kinematics
Gaseous radial velocity fields were obtained measuring the peak wavelength of the emission lines using Gaussian curves to fit the emission lines. The results are shown in the left column of Fig. 5, where the red colors represent redshifts and blue colors represent blueshifts. The mean uncertainty in the velocities for all lines is less than 10 km s-1. An underlying “rotation pattern” is present in the four maps although it is quite clear that in all cases there are other important kinematic components, evidenced by large deviations from simple rotation. We have overlaid the radio contours on the Br and [Fe ii] radial velocity maps, which evidence the strong influence of the radio jet on the gas kinematics. In particular, the location of the radio hot spot corresponds to the regions of highest blueshift observed in the gas towards the NW, while there is also some correspondence between the radio emission and the redshifts to the SE, mainly observed in the H i and [Fe ii] velocity maps.
The velocity field most closely resembling circular rotation (the classical “spider diagram”) is the one derived from the H2 line. We have tentatively modeled the H2 velocity field as disk rotation in a central Plummer bulge potential (Plummer, 1911):
| (1) |
where is the mass, the scale length, is the radius in the plane of the galaxy and is the Newton’s gravitational constant. Defining the coordinates of the kinematical center of the system as (), the observed radial velocity at the position (), where is the projected radial distance from the nucleus in the plane of the sky and is the corresponding position angle, is given by
| (2) |
where is the systemic velocity, is the inclination of the disk ( for face on disk) and is the position angle of the line of nodes (Storchi-Bergmann, Wilson & Baldwin, 1996). The equation above contains seven free parameters, including the kinematical center, that can be determined by fitting the model to the observations. This was done using a non linear least-squares algorithm, in which initial guesses are given for the free parameters. The isovelocity curves representing the best model fit to the data are shown as black lines in the upper left panel of Fig. 5, while the white contours trace the isovelocity curves of the observed velocity field. It can be seen that circular rotation is not a good representation of the velocity field, particularly along the radio axis, evidentiating the presence of other kinematic components in the gas besides rotation. The kinematic center obtained from the fit coincides with the location of the peak of the continuum light distribution within the uncertainties.
The parameters derived from this fit are: the systemic velocity – 1752 2.8 km s-1 is 54 km s-1 larger than the one listed in NASA/IPAC Extragalactic Database (NED), while the inclination of the disk – 54.8∘ 3.9∘ is 10∘ higher than the photometric one we obtain from the J-band image (, where and are the semi-major and semi-minor axes of the ellipse fitted to the outermost isophote of Fig. 3). We obtain the value 1.020.13 109 M⊙ for the bulge mass and 108.5 12.9 pc for the bulge scale length. The orientation of the line of nodes – 119.5∘ 1.4∘ is 10∘ smaller than that of the photometric major axis
We have also measured the full width at half maximum (FWHM) of the observed emission lines, from which we obtained the velocity dispersion as . The corresponding maps for each line are shown in the right panels of Fig. 5. The mean uncertainties in values are 2, 4.5, 14 and 17 km s-1 for H2, Br, Pa and [Fe ii], respectively. We have again overlaid the radio contours on the Br and [Fe ii] maps. It can be observed that the regions with the largest are displaced relative to the regions with strongest radio emission: for example, the largest values are observed between the radio nucleus and the hot spot in the Br map. Similarly, in the [Fe ii] map the highest values avoid also the locations of the radio emission knots.
A comparison between the maps of the different lines show that the H2 velocity dispersion values are lower than those of [Fe ii] and H i lines, indicating that the gas emitting the two latter lines is more perturbed than the molecular gas.
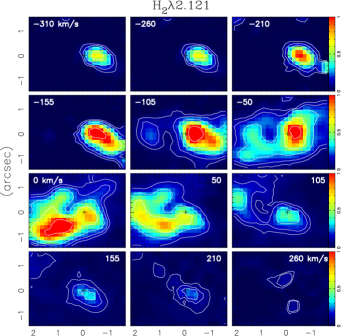
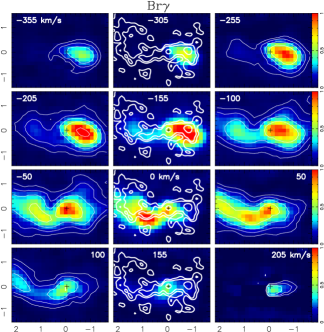
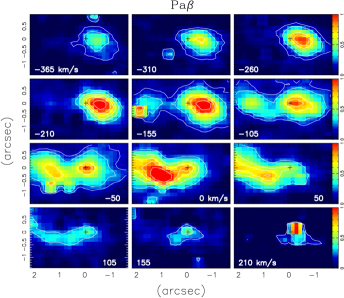
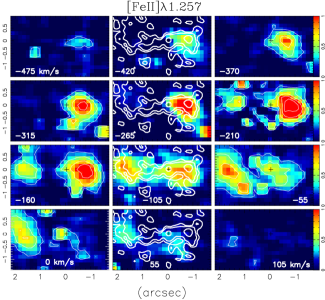
3.5 Emission-line “Tomography”
The relatively high spectral resolution of the data has allowed us to slice our data cube into a sequence of velocity bins along each emission line profile, providing a better sampling of the gas kinematics, not restricted to the peak wavelength of the emission-line, but including also the wings. The slices were obtained after the subtraction of the continuum determined as averages of the fluxes from both sides of each emission-line. Each slice corresponds to a velocity bin of 50 km s-1, selected to include two pixels of the data cube and to correspond approximately to the nominal spectral resolution of the data. The obtained slices are shown in Fig. 6, where each panel presents flux contour levels in arbitrary units for each velocity slice and each emission line, and where the nucleus, defined as the peak of continuum emission, is marked with a cross. The zero velocity is adopted as the one corresponding to the peak wavelength of H2 within an aperture of 33 pixels centered at the nucleus. We have overlaid the contours of the radio image on the central panels the Br and [Fe ii] emission line slices in Fig. 6.
The velocity distributions are somewhat different for the different emission lines. For H i, as the slices trace gas from negative (blueshift) to positive (redshift) residual velocities, the peak in the flux distribution moves from NW to SE, approximately following the path traced by the radio emission. The blueshifts observed in H i, reach 300 km s-1, approximately at the location of the radio hot spot, between 06 and 08 NW of the nucleus. Some blueshifts are also observed to the SE following the radio structure which bends upwards (see Fig. 6). Redshifts are mostly observed at the nucleus, where they reach 200 km s-1 and to the SE where they reach smaller values of 100 km s-1 at 1–2′′SE. The redshifted emission to the SE also traces the radio structure. Thus, to the SE, we observe both blueshifts and redshifts following the radio structure.
For H2, the behaviour is similar to that observed for H i, only that there is additional emission beyond the radio structure. The highest blueshifts, of up to 400 km s-1 are observed in the [Fe ii] emitting gas, which shows a more bipolar structure in the velocity slices than the other emission lines. Throughout this structure, we observe mostly blueshifts, even at the nucleus and to SE.
In summary, we could say that the [Fe ii] velocity field shows predominantly a bipolar structure, which is also observed in the H2 and H i for the highest velocity gas. For velocities between -100 and 100 km s-1, the structure in H i is best described as linear, with both blueshifts and redshifts observed to either side of the nucleus. In the case of H2, in this low velocity range, the emission at low intensity levels is spread over most of the IFU field.
4 Discussion
4.1 Gas kinematics
Although all the velocity fields show evidence of a rotation pattern, the blueshifted side shows a more abrupt gradient going from the systemic velocity at the center to 100 km s-1 at only 06 (55 pc) from it towards the NW, while to the SE equivalent redshift is barely reached at the border of the IFU field (210 pc from the nucleus). In the top panel of Fig. 7 we present one-dimensional cuts of the radial velocity field along the radio jet for the H2, Br and [Fe ii] emission lines, in which we can clearly see this behaviour.
By comparing the line intensity maps (Fig. 4) with the velocity fields (Fig. 5), we verify that the peak blueshifts approximately coincide with the peak intensities, suggesting that the flux enhancement is produced by the compression provided by the NW radio jet (Falcke, Wilson & Simpson 1998), which should be at least partially oriented toward us in order to account for the observed blueshift. A more detailed analysis of the correspondence between the line fluxes and velocities (but along one axis) can be done using one-dimensional cuts shown in Fig. 7, by comparing the top and middle panels. In this comparison it can be observed that the [Fe ii] line flux presents a peak at the location of the strongest blueshift, between 06 and 08 NW of the nucleus, another smaller peak at the nucleus and another one at 12 SE of the nucleus, at a location coincident with a “residual blueshift” – a decrease in the velocity observed in the redshifted side in the top panel of Fig. 7. The fluxes of the H2 and Br emission lines also show peaks at 04 NW, thus somewhat closer to the nucleus than the locations of strongest blueshifts and between 1 and 2′′ SE of the nucleus, approximately at the locations of the residual blueshift described above, also observed in the H2 and Br emission lines. Similar displacements between the radio and optical emission have been observed by Falcke, Wilson & Simpson (1998) in their comparison between HST [O iii]5007 and [N iis]+H emission-line images and the radio images of ESO 428-G14: they found that the emission-line fluxes are enhanced, in the form of knots and filaments in structures shaped as cocoons surrounding the radio jets. This close association between emission line distributions and radio structures is nevertheless not always observed leading some authors to conclude that there is no connection between the kinematics of the NLR and radio jets (Kaiser et al., 2000; Das et al, 2005, 2006).

In the case of ESO 428-G14 the good correspondence between the radio and emission line structures, also observed in the velocity slices of Fig. 6 indicates that the radio jet has an influence on all the emitting gas, although the somewhat distinct kinematics observed in the different emission lines suggest varying contribution of the radio jet to the line emission. The [Fe ii] line kinematics is dominated by two outflowing structures towards the end of the radio jets; the H i kinematics has contribution from all emitting regions along the radio jet; and the H2 line presents the less bipolarity, more closely resembling a rotation pattern. We interpret these differences as due to a larger disk rotation component contribution to kinematics of the H2 line, an increasing contribution of the radio jet perturbations to the kinematics of the H i line emission, and a even larger contribution from the radio jet to the kinematics of the [Fe ii] line.
The influence of the radio jet on the emitting gas can also be observed in the velocity dispersion () maps (Fig. 5) and in the one-dimensional cuts along the radio axis shown in the lower panel of Fig.7. Increase in the values are observed from 04 SE to 06 NW along the radio axis and between 08 and 18 to SE of the nucleus. At least to the NW, the largest values are thus observed between the nucleus and the radio hot spot, and do not coincide with the emission line flux and velocity peaks, but is shifted towards the nucleus. To the SE, the highest values seem to approximately coincide with the peaks in the line intensity and velocity (the residual blueshifts relative to the redshifts of the gas to SE). We interpret this result as due to the interaction of the radio jet with ambient gas which produces a broadening of the emission lines due the momentum transfered to the gas by the jet. The different behaviour of the values to the NW and to the SE can be understood as due to a shock between the radio jet and a dense ISM to the NW which blocks the radio jet and stirs the gas not only at the shock front but also behind the shock, which is observed as a larger velocity dispersion. The presence of a shock front is evidenced by the the abrupt termination of the radio jet at the hot spot and the enhanced line emission at this location. The interaction of the radio jet with the ISM is milder to the SE, where the radio jet stirs the gas but is not blocked penetrating farther into the ISM.
It can also be noted that the overall velocity dispersion values are lowest for H2 (30 to 85 km s-1), and highest for the [Fe ii] (50 to 180 km s-1), indicating that the [Fe ii] traces the most disturbed gas, while H2 traces the less disturbed gas. This result is also consistent with those obtained from the velocity fields discussed above, supporting a different origin for the gas emitting the different lines. Distinct kinematics for H i, H2 and [Fe ii] has been observed also in previous near-IR studies of other AGNs (e.g. Wilman et. al. 2000, Storchi-Bergmann et al. 1999), where the broadest [Fe ii] emission has been attributed to gas cloud interactions with the radio jet.
4.2 H2 emission origin
The H2 lines can be excited in two different ways: fluorescent excitation through absorption of soft-UV photons (912–1108 Å) in the Lyman and Werner bands (Black & van Dishoeck, 1987) and collisional excitation, namely inelastic collisions between molecules in a warm ( K) gas. The heating necessary to allow collisional excitation may be provided by: shocks (Hollenbach & McKee, 1989), X-rays (Maloney, Hollenbach & Tielens, 1996) or dense photodissociation regions by UV photons. The method commonly used to differentiate collisional excitation from fluorescence is based on the flux ratios of H2 lines in the K band. Based on measurements of such ratios for a large sample of galaxies, Rodríguez-Ardila, Riffel & Pastoriza (2005) concluded that fluorescence is not important for AGNs supporting previous studies by Veilleux, Goodrich & Hill (1997), Moorwood & Oliva (1990) and Fischer et al. (1987).
Quillen et al. (1999), using HST, imaged a sample of 10 Seyfert galaxies in H2 and detected extended emission in six of them. For three galaxies they found H2 emission in the extended narrow line region, coincident with [O iii] and H [N ii] line emission. For these galaxies they discarded UV excitation as the dominant excitation process on the basis of the H to H2 ratio, and argued that slow shocks are the most likely process to explain these line ratios. They compiled spectroscopic observations of molecular hydrogen from Koornneef & Israel (1996), Ruiz (1997) and Veilleux, Goodrich & Hill (1997) and looked for correlations with radio 6-cm and hard X-ray flux. They found no correlation with X-rays, suggesting this is not the dominant H2 excitation mechanism, and found a weak correlation with radio 6-cm, suggesting that no single mechanism is likely to be responsible for the molecular hydrogen excitation in Seyfert galaxies.
In a paper aimed at explaining the strong H2 emission of NGC 6240, Draine & Woods (1990) argued that shock speeds higher than the H2 values of ESO 428-G14 (5080 kms-1) dissociates the H2 molecule. We thus conclude that faster shocks, although present, as indicated by the larger [Fe ii] values, destroy the H2 molecule, and this is why we do not see broader H2 emission. Draine & Woods (1990) propose that most of the H2 line emission originates in molecular gas with is heated by transient X-ray irradiation. Hard X-rays from the AGN have been also proposed by Wilman et. al. (2000) and Bellamy & Tadhunter (2004) as the dominant excitation mechanism of H2 emission in Cygnus A.
Our H2 flux distribution and kinematics suggest some association with the radio morphology, in particular at the radio hot spot, but there is also additional emission spread throughout the IFU field. The emission line ratio H/Br is 0.8 along the radio jet increasing outwards, in the direction perpendicular to the radio jet, to 5. In Starbursts, where the main heating agent is UV radiation, H/Br, while for AGNs this ratio is larger (0.6 H/Br 2) because of the additional H2 excited by shocks or by X-rays from the AGN (Rodríguez-Ardila, Riffel & Pastoriza, 2005; Storchi-Bergmann et al., 1999). The value 0.8 observed for ESO 428-G14 along the radio jet is thus typical of AGNs.
The higher H/Br line ratio values observed outside the jet could be due to some X-rays from the AGN still reaching these regions while the UV-photons needed to excite the H i are in much less number producing only very faint Br emission.
From the discussion above we conclude that the collisional excitation necessary to produce the H2 emission may be provided by the interaction of the radio jet with the circumnuclear interstellar medium (hereafter ISM) or by heating produced by the X-rays emitted by the AGN. The enhanced H2 values in the hot spot region reveal that the jet is depositing kinetic energy on the gas. This energy can be estimated as follows. The instrumental broadening is 21 km s-1. Subtracting this in quadrature, we obtain a minimum for H2 of 34 km s-1 (away from the radio jet), and a maximum value at the hot spot region of 77 km s-1 . (Uncertainties in these values are 10 km s-1.) Velocities of the order of the latter provide enough kinetic energy to excite the H2 molecule. Assuming that the H2 emitting regions with smallest (blue region in the top right panel of Fig. 5) are solely excited by X-rays and that the X-ray contribution is the same as in the jet region, we can estimate the increase in kinetic energy provided by the radio jet as . Under the above assumptions, one could conclude that 83% (5/6) of the H2 excitation is due to shocks at the hot spot regions (red regions in the top panel of Fig. 5). In the yellow regions SE of the nucleus, and the regions surrounding the radio jet region, the kinetic energy ratio is 2.7, thus the jet excitation still dominates (73%) there. But these are only upper limits because the X-ray flux in the jet region may be larger. In a “photoionization scenario” by a “clumpy” torus atmosphere (eg. Evans et al., 1993; Konigl & Kartje, 1994), the ionization state of the gas would be larger along the collimation axis of the torus and would drop with increasing distance from this axis. This could explain why the H2 emission is distributed over a wider area, in gas which is irradiated by an attenuated continuum.
4.3 [Fe ii] emission origin
A number of papers have presented reviews and detailed studies of the physical conditions of the [Fe ii] emitting gas in starburst and AGN galaxies, such as Mouri et al. (1990), Mouri, Kawara & Taniguchi (1993) and Rodríguez-Ardila, Riffel & Pastoriza (2005). In these studies it is argued that the [Fe ii]/Br ratio is controlled by the ratio between the volumes of partially to fully ionized gas regions, as [Fe ii] emission is excited in partially ionized gas. Such zones in AGN are created by power law photoionization (including X-rays emitted by the AGN) or shock heating. These two processes are discriminated by the electron temperature of the [Fe ii] region: for photoionization and for shocks. A contribution from shocks produced by radio jets is supported by results such as those of Forbes & Ward (1993) which have found a correlation between the [Fe ii] and 6-cm radio emission in radio galaxies. Nevertheless Simpson et al. (1996) have argued that the dominant excitation mechanism of [Fe ii] is photoionization with shock excitation accounting for only 20 % of the [Fe ii] emission in AGN.
The nature of the excitation mechanism can be investigated using emission line ratios. Rodríguez-Ardila, Riffel & Pastoriza (2005) show that [Fe ii]/Pa is smaller than 0.6 for Starburst galaxies and higher than 2 for supernova remnants, for which shocks are the main excitation mechanism. The Seyfert galaxies have values in between 0.6 and 2 suggesting that this ratio can be used as a measure of the relative contribution of photoionization and shocks. For ESO 428-G14 10.27[Fe ii]/Pa20.73 in the region co-spatial with the radio jet, indicating a range of relative contribution of photoionization and shock excitation for the [Fe ii] line, with regions where this ratio is 2 been dominated by shocks. In the region corresponding to the radio hot spot this ratio ranges from 1.5 to 2 supporting a large contribution from shocks.
In order to estimate an upper limit on the contribution of the radio jet in the excitation of the [Fe ii], we use the same reasoning as in the case of H2 emission above, assuming that the lowest observed for this line (dark blue regions in the bottom right panel of Fig. 5) is produced by X-ray excitation. We obtain a ratio between maximum and minimum kinetic energies of , thus 90% of [Feii] emitted in the hot spot region (red region in bottom right panel of Fig. 5) is excited by the radio jet under the above assumptions. In other regions of the jet (yellow-green regions) where , the percentage of gas emission due to radio jet excitation falls to 80%. But these are also upper limits because as pointed above for H2, the X-ray emission may be stronger along the radio jet, providing a larger contribution for the [Feii] emission excitation than in the regions with the lowest values. On the other hand, the stronger association of the [Feii] flux and kinematics with the radio structure supports a larger contribution of the radio jet to the [Feii] excitation relative to that of H2.
5 Summary and Conclusions
We have analyzed near-IR J and K band 2D spectra of the inner 300 pc of the Seyfert galaxy ESO 428-G14 obtained with the Gemini GNIRS IFU. The fine angular sampling of this instrument and the high spectral resolution of the observations provided a spatial sampling of 14 pc2 at the galaxy and a velocity resolution of 20 km s-1. These characteristics and 2D coverage has allowed us to obtain gas flux distributions and ratios as well as to map the gas kinematics in the four strong emission lines [Fe ii]m, Pa, Hm and Br. Such 2D mapping at the spatial and spectral resolution of our observations and in the near-IR is unique in the literature so far.
We have used the spectroscopic data in conjunction with a [Fe ii]m narrow-band image and color map obtained with OSIRIS at the CTIO Blanco Telescope. The [Fe ii] narrow-band image shows a bi-polar structure which correlates well with the structure observed in a previous published radio map, as well as with that observed in a narrow-band [O iii] HST image. This bi-polar structure is oriented approximately along the photometric major axis of the galaxy at PA129∘. Under the assumption that redder color is due to dust screening, we conclude from the color map that NE is the near side of the galaxy.
The IFU observations show that not only the [Fe ii] flux distribution, but also Pa and Br correlate with the radio emission, all showing elongated morphologies along the radio axis. The H2 emission has an additional component more spread over the disk of the host galaxy.
The gas kinematics shows a pattern which, at first sight, seems to be due to rotation in a disk, but which is clearly disturbed by non-circular motions. The analysis of the gas kinematics is complicated by the fact that the galaxy major axis is approximately aligned with the radio axis. The radio emission morphology suggests that a radio jet is the cause of outflows observed in velocity “slices” obtained along the gas emission line profiles: blueshifts of 300–400 km s-1 are observed in emission associated with a radio hot spot at 08 NW of the nucleus, while mostly redshifts and some blueshifts observed to the opposite side of the nucleus are associated to fainter radio emission observed up to 2′′ SE. From this velocity pattern, as well as from the emission-line ratios we conclude that the radio jet leaves the nucleus at a small angle relative to the plane of the galaxy, with the NW side slightly directed toward us and the counter-jet directed away from us, being partially hidden by the disk of the galaxy. Some redshift observed to the NW and some blueshift observed to the SE shows that the line emission is observed to both sides of the plane of the galaxy, confirming that the angle between the radio jet and the plane of the galaxy is small and emission associated with the jets occurs on both sides of the galaxy plane. The reddening distribution obtained from the Br/Pa emission-line ratio coincides with that obtained from the continuum, confirming that the line emission comes from circumnuclear gas located essentially in the galactic plane.
The velocity dispersion maps show the highest values between the nucleus and the regions of strongest radio emission (the radio hot spots). We interpret this result as due to kinetic energy deposited by ratio jet in the circumnuclear ISM, producing a compression in the gas and emission enhancement just beyond this compressed region.
While the [Fe ii] emission is dominated by the highest velocities at the two hot spots in opposite sides of the nucleus, the H i emission has an important contribution also from lower velocities, observed all along the radio emission structure. The H2 emission has significant emission contribution at low velocities spread throughout the observed region, apparently coming from the disk of the host galaxy.
From the observed kinematics, we conclude that the radio jet has a fundamental role in shaping the emission line region as it interacts with the galaxy ISM surrounding the galaxy nucleus. We have used the 2D velocity dispersion maps to estimate the kinetic energy deposited in the circumnuclear ISM by the radio jet relative to regions away from the jet. Assuming that the H2 and [Fe ii] excitation in the latter regions is dominated by X-rays, and that the X-rays excitation is the same in the jet region, we obtain contributions by shocks of up to 80 - 90% for the [Fe ii] and up to 70 - 80% for H2 in the jet region. These are however, upper limits due to the fact that the X-rays contribution along the jet axis may be larger than away from it. The stronger association of the [Fe ii] emission and kinematics with the radio structure supports a larger contribution of the radio jet to the excitation of [Fe ii] than to that of H2.
Acknowledgments
We thank an anonymous referee for useful comments and suggestions which helped to improve the paper. We acknowledge valuable discussions with A. S. Wilson and H. R. Schmitt and thank H. Falcke for sending the radio image. Based on observations obtained at the Gemini Observatory, which is operated by the Association of Universities for Research in Astronomy, Inc., under a cooperative agreement with the NSF on behalf of the Gemini partnership: the National Science Foundation (United States), the Particle Physics and Astronomy Research Council (United Kingdom), the National Research Council (Canada), CONICYT (Chile), the Australian Research Council (Australia), CNPq (Brazil) and CONICET (Argentina). This research has made use of the NASA/sIPAC Extragalactic Database (NED) which is operated by the Jet Propulsion Laboratory, California Institute of Technology, under contract with the National Aeronautics and Space Administration.
References
- Alonso-Herrero et al. (1998) Alonso-Herrero, A., Simpson, C., Ward, M. J. & Wilson, A. S. 1998, ApJ, 495, 196
- Bellamy & Tadhunter (2004) Bellamy, M. J., & Tadhunter, C. N. 2004, MNRAS, 353, 105.
- Bergvall, Johansson & Olofsson (1986) Bergvall, N., Johansson, L., & Olofsson, K. 1986, A&A, 166, 92.
- Black & van Dishoeck (1987) Black, J. H., & van Dishoeck, E. F. 1987, ApJ, 322, 412.
- Blietz et al. (1994) Blietz, M., Cameron, M., Drapatz, S., Genzel, R., Krabbe, A., & van der Werf, P. 1994, ApJ, 421, 92.
- Capetti et al. (1996) Capetti, A., Axon, D. J., Macchetto, F., Sparks, W. B., & Boksemnberg, A. 1996, ApJ, 469, 554.
- Crenshaw & Kraemer (2000) Crenshaw, D. M, & Kraemer, S. B. 2000, ApJ, 532, L101.
- Das et al (2005) Das, V., Crenshaw, D. M., Hutchings, J. B., Deo, R. P., Kraemer, S. B., Gull, T. R., Kaiser, M. E., Nelson, C. H., & Weistrop, D. 2005, AJ, 130, 945.
- Das et al (2006) Das, V., Crenshaw, D. M., Kraemer, S. B., & Deo, R. P. 2006, astro-ph/0603803
- Draine & Woods (1990) Draine, B. T., & Woods, D. T. 1990, ApJ, 363, 464.
- Elias et al. (1998) Elias, J. H., Vukobratovick, D., Andrew, J. R., Cho, M. K., Cuberly, R. W., Don, K., Gerzoff, A., Harmer, C. F., Harris, D., Heynssens, J. B., Hicks, J., Kovacs, A., Li, C., Liang, M. Moon Il K., Pearson, E. T., Plum, G., Roddier, N. A., Tvedt, J., Wolff, R. J., & Wong, W., 1998, SPIE, 3354, 555.
- Evans et al. (1993) Evans, I. N., Tsvetanov, Z., Kriss, G. A., Ford, H. C., Caganoff, S., & Koratkar, A. P. 1993, ApJ, 417, 82.
- Falcke et al. (1996) Falcke, H., Wilson, A. S., Simpson, C., & Bower, G. A. 1996, ApJ, 470, L31.
- Falcke, Wilson & Simpson (1998) Falcke, H., Wilson, A. S., & Simpson, C. 1998, ApJ, 502, 199.
- Ferruit, Wilson & Mulchaey (2000) Ferruit, P., Wilson, A. S., & Mulchaey, J. 2000, ApJS, 128, 139.
- Fischer et al. (1987) Fischer, J., Smith, H. A., Geballe, t. R., Simon, M., & Storey, j. W. V. 1987, ApJ, 320, 667.
- Forbes & Ward (1993) Forbes, D. A. & Ward, M. J. 1993, ApJ, 416, 150.
- Frogel (1998) Frogel, J. A. 1998, PASP, 110, 200 .
- Hollenbach & McKee (1989) Hollenbach, D., & McKee, C. F., 1989, ApJ, 342, 306.
- Hutchings et al. (1998) Hutchings, J. B., Crenshaw, D. M., Kaiser, M. E., Kraemer, S. B., Weistrop, D., Baum, S., Bowers, C. W., Feinberg, L. D., Green, R. F., Gull, T. R., Hartig, G. F., Hill, G., & Lindler, D. J. 1998, ApJ, 492, L115.
- Kaiser et al. (2000) Kaiser, M. E., Bradley, L. D., II, Hutchings, J. B., Crenshaw, D. M., Gull, T. R., Kraemer, S. B., Nelson, C. H., Ruiz, J., & Weistrop, D. 2000, ApJ, 528, 260.
- Konigl & Kartje (1994) Konigl, Arieh, & Kartje, John F. 1994, ApJ, 434, 446.
- Koornneef & Israel (1996) Koornneef, J. & Israel, F. P. 1996, New Astronomy, 1, 271.
- Maloney, Hollenbach & Tielens (1996) Maloney, P. R., Hollenbach, D. J., & Tielens, A. G. G. M., 1996, ApJ, 466, 561.
- Moorwood & Oliva (1990) Moorwood, A. F. M. & Oliva, E. 1990, A&A, 239, 78.
- Mouri et al. (1990) Mouri, H., Nishida, M., Taniguchi, Y., & Kawara, K. 1990, ApJ, 360, 55.
- Mouri, Kawara & Taniguchi (1993) Mouri, H., Kawara, K., & Taniguchi, Y. 1993, ApJ, 406, 52.
- Mulchaey, Wilson & Tsvetanov (1996) Mulchaey, J. S., Wilson, A. S., & Tsvetanov, Z. 1996, ApJ, 467, 197.
- Nelson et al. (2000) Nelson, C. H., Weistrop, D., Hutchings, J. B., Crenshaw, D. M., Gull, T. R., Kaiser, M. E., Kraemer, S. B., & Lindler, D. 2000, ApJ, 531, 257.
- Plummer (1911) Plummer, H. C. 1911, MNRAS, 71, 460.
- Quillen et al. (1999) Quillen, A. C., Alonso-Herrero, A., Rieke, M. J., Rieke, G. H., Ruiz, M., & Kulkarni, V. 1999, ApJ, 527, 696.
- Rodríguez-Ardila et al. (2004) Rodríguez-Ardila, A., Pastoriza, M. G., Viegas, S. M., Sigut, T. A. A., & Pradhan, A. K. 2004, A&A, 519, 425.
- Rodríguez-Ardila, Riffel & Pastoriza (2005) Rodríguez-Ardila, A., Riffel, R., & Pastoriza, M. G. 2005, MNRAS, 364, 1041.
- Ruiz (1997) Ruiz, M. 1997, Ph.D. Thesis.
- Schmitt & Kinney (1996) Schmitt, H. R. & Kinney, A. L. 1996, ApJ, 463, 498.
- Simpson et al. (1996) Simpson, C., Forbes, D. A., Baker, A. C., & Ward, M. J. 1996, MNRAS, 283, 777.
- Storchi-Bergmann, Wilson & Baldwin (1996) Storchi-Bergmann, T., Wilson, A. S., & Baldwin, J. A., 1996, ApJ, 460, 252.
- Storchi-Bergmann et al. (1999) Storchi-Bergmann, T., Winge, C., Ward, M. J., Wilson, A. S., 1999, MNRAS, 304, 35.
- Ulvestad & Wilson (1989) Ulvestad, J. S., & Wilson, A. S. 1989, ApJ, 343, 659.
- van Dokkum (2001) van Dokkum, P. G. 2001, PASP, 113, 1420.
- Veilleux, Goodrich & Hill (1997) Veilleux, S., Goodrich, R. W., & Hill, G. J. 1997, ApJ, 477, 631.
- Wilman et. al. (2000) Wilman, R. J., Edge, A. C., Johnstone, R. M., Crawford, C. S. & Fabian, A. C. 2000, MNRAS, 318, 1232.
- Wilson et. al. (1993) Wilson, A. S., Braatz, J. A., Heckman, T. M., krolic, J. H., & Miley, G. K. 1993, ApJ, 419, L61.
- Winge et. al. (1997) Winge, C., Axon, D. J., Macchetto, F. D., & Capetti, A. 1997, ApJ, 487, L121.
- Winge et. al. (1999) Winge, C., Axon, D. J., Macchetto, F. D., Capetti, A., & Marconi, A. 1999, ApJ, 519, 134.
- Winge et al. (2000) Winge, C., Storchi-Bergmann, T., Ward, M. J., & Wilson, A. S. 2000, MNRAS, 316, 1.