∎
22email: tiengo@iasf-milano.inaf.it 33institutetext: P. Esposito 44institutetext: Università di Pavia, Dipartimento di Fisica Nucleare e Teorica and INFN-Pavia, via Bassi 6, I-27100 Pavia, Italy 55institutetext: P. Esposito 66institutetext: S. Mereghetti 77institutetext: L. Sidoli 88institutetext: INAF-IASF Milano, via Bassini 15, I-20133 Milan, Italy 99institutetext: D. Götz 1010institutetext: CEA Saclay, DSM/DAPNIA/Service d’Astrophysique, F-91191, Gif-sur-Yvette, France 1111institutetext: M. Feroci 1212institutetext: INAF-IASF Roma, via Fosso del Cavaliere 100, I-00133 Roma, Italy 1313institutetext: R. Turolla 1414institutetext: Università di Padova, Dipartimento di Fisica, via Marzolo 8, I-35131 Padova, Italy 1515institutetext: S. Zane 1616institutetext: Mullard Space Science Laboratory, University College London, Holmbury St. Mary, Dorking Surrey, RH5 6NT, United Kingdom 1717institutetext: G.L. Israel 1818institutetext: L. Stella 1919institutetext: INAF - Osservatorio Astronomico di Roma, via Frascati 33, I-00040 Monteporzio Catone, Italy 2020institutetext: P. Woods 2121institutetext: Dynetics, Inc., 1000 Explorer Boulevard, Huntsville, AL 35806
Long term spectral variability in the Soft Gamma-ray Repeater SGR 1900+14
Abstract
We present a systematic analysis of all the BeppoSAX data of SGR1900+14. The observations spanning five years show that the source was brighter than usual on two occasions: 20 days after the August 1998 giant flare and during the 105 s long X–ray afterglow following the April 2001 intermediate flare. In the latter case, we explore the possibility of describing the observed short term spectral evolution only with a change of the temperature of the blackbody component. In the only BeppoSAX observation performed before the giant flare, the spectrum of the SGR1900+14 persistent emission was significantly harder and detected also above 10 keV with the PDS instrument. In the last BeppoSAX observation (April 2002) the flux was at least a factor 1.2 below the historical level, suggesting that the source was entering a quiescent period.
Keywords:
stars: individual (SGR 1900+14) stars: neutron X–rays: starspacs:
97.60.Jd 98.70.Qy1 Introduction
The soft gamma-ray repeater (SGR) SGR 1900+14 was discovered in 1979 through a series of short and soft gamma-ray bursts (Mazets et al., 1979). Many years later, its persistent pulsating X–ray counterpart was discovered in the 2–10 keV energy band (Hurley et al., 1999b). More recently, it was also detected in the hard X–ray range (20–100 keV) with the INTEGRAL satellite, becoming the second SGR with a measurable hard X–ray tail in the spectrum of its persistent emission (Götz et al., 2006).
The bursting activity of SGR 1900+14 is rather discontinuous (see Figure 1, bottom panel) and culminated on 1998 August 27 with the emission of a Giant Flare, when more than 1044 ergs of –rays were emitted in less than one second (Hurley et al., 1999a; Mazets et al., 1999; Feroci et al., 2001). This was one of the three Giant Flares detected up to now from three different SGRs and was interpreted as a new evidence in favor of the magnetar model. In this model (Thompson & Duncan, 1995, 1996), the SGRs and the Anomalous X–ray Pulsars (AXPs, another class of X–ray sources with similar properties, Mereghetti et al. 2002) are believed to be neutron stars powered by the decay of their extremely intense magnetic field ( G).
Here we present the analysis of the persistent emission of SGR 1900+14 both in the soft and hard X–ray range and its evolution across the Giant Flare and in relation to its bursting activity.
2 Soft X–ray emission
2.1 Observations and data analysis
We have analyzed the X–ray observations of SGR 1900+14 performed with the BeppoSAX satellite (see Table 2.1).
| Obs | Date | Instrument | Exp. time |
|---|---|---|---|
| A | 1997-05-12 | SAX/MECS | 46 ks |
| SAX/PDS | 20 ks | ||
| B | 1998-09-15 | SAX/MECS | 33 ks |
| SAX/PDS | 16 ks | ||
| C | 2000-03-30 | SAX/MECS | 40 ks |
| SAX/PDS | 18 ks | ||
| D | 2000-04-25 | SAX/MECS | 40 ks |
| SAX/PDS | 19 ks | ||
| E | 2001-04-18 | SAX/MECS | 46 ks |
| SAX/PDS | 17 ks | ||
| F | 2001-04-29 | SAX/MECS | 58 ks |
| SAX/PDS | 26 ks | ||
| G | 2002-03-09 | SAX/PDS | 48 ks |
| H | 2002-04-27 | SAX/MECS | 83 ks |
The spectra were extracted from the MECS (Boella et al., 1997) and LECS (Parmar et al., 1997) instruments using circles with radii 4′ and 8′, respectively. The background spectra were extracted in all cases from nearby regions. Time filters were applied to both the source and background spectra to exclude the SGR bursts detected during observation A, B and F. The standard response matrices were used for the MECS and LECS spectra.
2.2 Spectral results

We have first tried to fit the spectra with an absorbed power-law model, but three observations give unacceptable values of the and structured residuals. For these observations, a good fit is obtained with the addition of a blackbody component. Since such a two-components model is typical of the magnetar candidates (Woods & Thompson, 2004), we have used this model to fit all the available spectra, obtaining the results reported in Figure 1. As can be seen in the upper panel, the flux varies by a factor 5, with the highest values observed during observations B and E. These two observations were taken shortly after extreme bursting events. The former was performed 20 days after the Giant Flare, that was followed by a 2 months period of enhanced X–ray flux (Woods et al., 1999). The latter started only 7.5 hours after the 2001 April 18 Intermediate Flare which had a fluence 20 times lower than that of the Giant Flare (Feroci et al., 2003). The afterglow following this bright burst is clearly visible during the BeppoSAX observation as a decrease in the X–ray flux, accompanied by a significant softening of the spectrum (Feroci et al., 2003). In addition to the afterglow analysis already reported by Feroci et al. (2003), we have performed a time resolved spectroscopy of the afterglow by dividing observation E into 5 time intervals. Although the 5 spectra can be fitted by a variety of models, the spectral evolution of the afterglow is well represented by an additional blackbody component with fixed emitting area (1.5 km, for a source distance of 15 kpc) and progressively decreasing temperature (1.3–0.9 keV), that can be interpreted as due to a portion of the neutron star surface heated during the flare.
Excluding the two observations taken after the exceptional explosive events (B and E), the flux of SGR 1900+14 had a rather constant value of erg cm-2 s-1 from 1997 to 2001. On the other hand a significantly lower flux level was seen in the following observations. The flux decrease actually started when the source was still moderately active (the flux in observation H is at least 1.2 times lower than in all the previous quiescent observations) and has been interrupted by a slight rise in coincidence with the March 2006 burst reactivation, as shown by recent XMM-Newton observations (Mereghetti et al. 2006, in preparation).
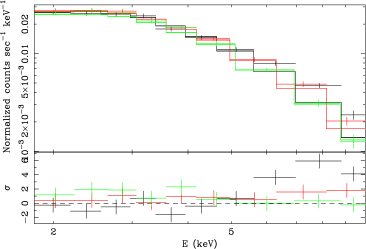
Although the flux of the only pre-Giant Flare observation is compatible with that of the quiescent post-flare observations taken before 2002, its spectrum is significantly harder, as indicated by the comparison of the photon indexes plotted in the second panel of Figure 1. The spectral change between observation A and the following quiescent observations is well illustrated by the clear trend of the residuals from the simultaneous fit of the spectra of observations A, C and D (Figure 2).
The blackbody parameters are compatible in all the available observations, except for that taken during the afterglow of the Intermediate Flare (observation E). This indicates that a constant blackbody component with 0.4 keV and emitting area with R6-7 km might be a permanent feature of the X-ray spectrum of SGR 1900+14.
3 Hard X–ray emission
3.1 Detection with the PDS instrument
To study the high energy emission from SGR 1900+14 we used the BeppoSAX PDS instrument, which operated in the 15-300 keV range. The PDS instrument was more sensitive than INTEGRAL in this energy band, but it had no imaging capabilities and therefore the possible contamination from nearby sources must be taken into account. The field of view (FoV) of the PDS instrument was 1.3∘ (FWHM) and the background subtraction was performed through a rocking system that pointed to two 3.5∘ offset positions every 96 s. In the case of SGR 1900+14, the background pointings were free of contaminating sources, as confirmed by the identical count rates observed in the two offset positions during each observation. The field of SGR 1900+14 is instead rather crowded, with three transient sources, the X–ray pulsars 4U 1907+97 (Giacconi et al., 1971; Liu et al., 2000) and XTE J1906+09 (Marsden et al., 1998), and the black hole candidate XTE J1908+94 (in’t Zand et al., 2002), located at angular distances of 47′, 33′ and 24′ from the SGR, respectively. The pulsations of the two pulsars are clearly visible in the PDS data below 50 keV when they are active, while XTE J1908+94, if in outburst, is clearly visible in the simultaneous MECS and LECS images and, being very bright, also in the lightcurve collected by the All Sky Monitor (ASM) on board the RossiXTE satellite. We have found that at least one of these contaminating sources was on in all the BeppoSAX observations except for the first one (see Table 3.1). Thus, only the 1997 observation (obs. A), during which a significant signal was detected in the background subtracted PDS data, can be used to study SGR 1900+14 without the problem of known contaminating sources.
| Obs | 4U 1907+97 | XTE J1906+09 | XTE J1908+94 |
|---|---|---|---|
| A | OFF | OFF | OFF |
| B | ON | ON | OFF |
| C | OFF | ON | OFF |
| D | ON | ON | OFF |
| E | OFF | ON | OFF |
| F | ON | ON | OFF |
| G | OFF | ON | ON |
We searched for the SGR pulsation period (5.15719 s, as measured in the simultaneous MECS data) in the PDS data, but the result was not conclusive, giving only a 3 upper limit of 50% to the pulsed fraction of a sinusoidal periodicity, to be compared to the 20% pulsed fraction observed below 10 keV.
3.2 Spectral analysis
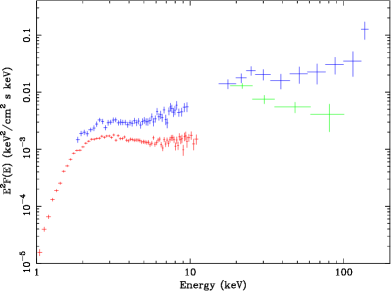
The background subtracted PDS spectrum of observation A can be well fit by a power-law with photon index , significantly flatter than that measured by INTEGRAL (, see Figure 3) in 2003 / 2004. The corresponding 20–100 keV flux is 610-11 erg cm-2 s-1, a factor 4 higher than during the INTEGRAL observations, which confirms that before the Giant Flare the hard X–ray tail of SGR 1900+14 was brighter.
The INTEGRAL spectrum was collected during 2.5 Ms of different observations performed between March 2003 and June 2004, and thus it represents the hard X–ray emission of SGR 1900+14 averaged over that long time period. Therefore, its relation to the soft X–ray spectrum can be studied only comparing the spectra taken by other instruments in a similar time period, as shown for example in Figure 3. The PDS instrument, instead, being a high sensitivity hard X–ray detector coupled to the MECS and LECS soft X–ray cameras, gives us the chance to study the broad band spectrum of SGR 1900+14 during a single observation. Fitting the 1–150 keV BeppoSAX spectrum of observation A, we obtain a good result (=1.17 for 136 degrees of freedom) simply extrapolating to higher energies the best-fit model found in the soft X–ray range. In fact, a fit with an absorbed power-law plus blackbody model gives the following parameters: photon index , blackbody temperature , radius km, and absorption cm-2.
4 Conclusions
We have studied the variability of SGR 1900+14, both in the hard and in the soft X–ray range, finding the following results:
-
•
Except for the observations immediately following exceptional flares, the flux level in soft X–rays was stable while the source was moderately active and progressively decreased when it entered a 3 years long quiescent period.
-
•
The Intermediate Flare of 2001 April 18 was followed by an X–ray afterglow that can be successfully interpreted as due to the heating of a significant fraction of the neutron star surface, that then cools down in 1 day. This is consistent with the interpretation of similar events in other magnetar candidates (Woods et al., 2004).
-
•
The soft X–ray spectrum during the only available pre-flare observation was harder than in the following quiescent observations. This is similar to what observed in SGR 1806–20, the only other SGR that could be monitored before and after a Giant Flare (Mereghetti et al., 2005; Rea et al., 2005; Tiengo et al., 2005).
-
•
Comparing the hard X-ray spectrum of SGR 1900+14 recently observed with INTEGRAL to that observed with the PDS instrument in 1997, we find evidence for variations in flux and spectral slope.
-
•
The reduction of the X–ray tail in coincidence with the Giant Flare is supported by the count rates detected in the PDS instrument above 50 keV during the different BeppoSAX observations, that indicate how they significantly decreased already in the first post-flare observation. Since the hard X–ray tail in the spectrum of SGR 1900+14 might contain most of its total emitted energy, its variability in relation to the bursting activity is a key point to try to understand the SGR emission processes.
References
- Boella et al. (1997) Boella G., Chiappetti L., Conti G. et al. A&AS, 122, 327 (1997)
- Feroci et al. (2001) Feroci M., Hurley K., Duncan R.C. et al. ApJ, 549, 1021 (2001)
- Feroci et al. (2003) Feroci M., Mereghetti S., Woods P. et al. ApJ, 596, 470 (2003)
- Giacconi et al. (1971) Giacconi R., Kellogg E., Gorenstein P. et al. ApJ, 165, L27 (1971)
- Götz et al. (2006) Götz D., Mereghetti S., Tiengo A. et al. A&A, 449, L31 (2006)
- Hurley et al. (1999a) Hurley K., Cline T., Mazets E. et al. Nature, 397, 41 (1999a)
- Hurley et al. (1999b) Hurley K., Kouveliotou C., Woods P. et al. ApJ, 510, L107 (1999b)
- in’t Zand et al. (2002) in’t Zand J.J.M., Miller J.M., Oosterbroek T. et al. A&A, 394, 553 (2002)
- Liu et al. (2000) Liu Q.Z., van Paradijs J. & van den Heuvel E.P.J. A&AS, 147, 25 (2000)
- Marsden et al. (1998) Marsden D., Gruber D.E., Heindl W.A. et al. ApJ, 502, L129 (1998)
- Mazets et al. (1999) Mazets E.P., Cline T.L., Aptekar R.L. et al. Astronomy Letters, 25, 628 (1999)
- Mazets et al. (1979) Mazets E.P., Golenetskii S.V. & Guryan Y.A. Soviet Astronomy Letters, 5, 343 (1979)
- Mereghetti et al. (2002) Mereghetti S., Chiarlone L., Israel G.L. et al. in “Neutron Stars, Pulsars, and Supernova Remnants”, ed. W. Becker, H. Lesch & J. Trümper, [ArXiv: astro-ph/0205122] (2002)
- Mereghetti et al. (2005) Mereghetti S., Tiengo A., Esposito P. et al. ApJ, 628, 938 (2005)
- Parmar et al. (1997) Parmar A.N., Martin D.D.E., Bavdaz M. et al. A&AS, 122, 309 (1997)
- Rea et al. (2005) Rea N., Israel G., Covino S. et al. The Astronomer’s Telegram, 645 (2005)
- Thompson & Duncan (1995) Thompson C. & Duncan R.C. MNRAS, 275, 255 (1995)
- Thompson & Duncan (1996) Thompson C. & Duncan R.C. ApJ, 473, 322 (1996)
- Tiengo et al. (2005) Tiengo A., Esposito P., Mereghetti S. et al. A&A, 440, L63 (2005)
- Woods et al. (1999) Woods P.M., Kouveliotou C., van Paradijs J. et al. ApJ, 518, L103 (1999)
- Woods et al. (2004) Woods P.M., Kaspi V.M., Thompson C. et al. ApJ, 605, 378 (2004)
- Woods & Thompson (2004) Woods P.M. & Thompson C. in “Compact Stellar X-ray Sources”, ed. W.H.G. Lewin and M. van der Klis, [ArXiv: astro-ph/0406133] (2004)