Revisiting the
Baryon
Fractions of Galaxy Clusters:
A Comparison with WMAP 3-year
Results
Abstract
The universal baryonic mass fraction () can be sensitively constrained using X-ray observations of galaxy clusters. In this paper, we compare the baryonic mass fraction inferred from measurements of the cosmic microwave background with the gas mass fractions () of a large sample of clusters taken from the recent literature. In systems cooler than 4 keV, declines as the system temperature decreases. However, in higher temperature systems, converges to , where the uncertainty reflects the systematic variations between clusters at . This is significantly lower than the maximum-likelihood value of the baryon fraction from the recently released WMAP 3-year results. We investigate possible reasons for this discrepancy, including the effects of radiative cooling and non-gravitational heating, and conclude that the most likely solution is that is higher than the best-fit WMAP value (we find ), but consistent at the level. Degeneracies within the WMAP data require that must also be greater than the maximum likelihood value for consistency between the data sets.
keywords:
cosmology: theory — galaxies: clusters: general — X-rays: galaxies: clusters1 Introduction
For over a decade now cluster gas mass fractions as inferred from X-ray observations have been used as a probe of the universal ratio of baryon to total matter densities, (e.g., White et al. 1993; David et al. 1995; Evrard 1997; Mohr et al. 1999; Roussel et al. 2000; Allen et al. 2002; Lin et al. 2003; Ettori 2003; Allen et al. 2004). Supplementing these gas mass fractions with constraints on from, e.g., cosmic microwave background (CMB) measurements or a combination of Big Bang Nucleosynthesis (BBN) predictions and D/H measurements from high redshift quasars, therefore allows one to measure the total matter density . The reliability of this test rests on the assumption that clusters have been able retain the original baryon inventory assigned to them in the early universe. So-called “non-radiative” cosmological simulations, which include a hydrodynamic treatment of the baryons but neglect sources or sinks such as radiative cooling, star formation, and feedback, indeed indicate that clusters retain nearly all their baryons until the present day (e.g., Frenk et al. 1999; Kay et al. 2004; Crain et al. 2006). The same is generally true for simulations with cooling and feedback. Although the fraction of baryons in the hot phase depends strongly on the model, most recent simulations predict a mild increase in the hot gas fraction with cluster mass, and little evolution with redshift (e.g., Tornatore et al. 2003; Kravtsov et al. 2005; Ettori et al. 2006).
Although the cluster baryon fraction test has been examined previously in many studies, there are several good reasons for revisiting it. First, new high-quality data obtained from the Chandra and XMM-Newton telescopes now allow us to probe both the surface brightness and temperature profiles of clusters out to large radii. As a result, both the statistical and systematic observational uncertainties on the gas mass fraction are substantially improved. Second, much improved (e.g., K-band) measurements of the stellar content of clusters are now available. Third, cosmological simulations can now robustly predict the baryon fractions within , which is roughly the same radius the latest X-ray measurements reliably extend out to. Fourth, analyses of mock observations of realistic cosmological simulations allow us to, e.g., quantify the observational bias introduced by assuming strict hydrostatic equilibrium (HSE) in the derivation of X-ray gas mass fractions. Finally, analysis of the recently released WMAP 3-year cosmic microwave background (CMB) data has yielded very tight constraints on the universal baryon fraction (Spergel et al. 2007). As a result, there is now an excellent opportunity to check for consistency (or lack of) between these two very different tests. We note that Ettori (2003) previously found evidence for a slight discrepancy between the universal baryon fraction inferred from the first year WMAP data and cluster baryon fractions inferred from BeppoSAX X-ray data. It is interesting to see whether or not this discrepancy remains when one makes use of the better observational data and improved theoretical predictions that are now available.
In this paper we analyse the best literature X-ray data in a homogeneous way, and compare the results with the universal baryon fraction inferred from the recently released WMAP 3-year data (Spergel et al. 2007).
Unless otherwise stated, we assume a CDM cosmology with .
2 Cluster gas fractions
We select high quality data from a few recent studies in the literature where the mass profiles have been reliably estimated out to . Vikhlinin et al. (2006), hereafter V06, have measured the gas and total mass profiles for a sample 13 relaxed “cool core” observed with Chandra. From this sample, we select all but two clusters111We exclude A2390, which V06 have demonstrated to be highly asymmetric owing to the presence of a set of large X-ray cavities nearly 400 kpc in diameter, and the low-temperature system USGC S152, for which V06 do not provide enough information to reconstruct its mass profile.. In addition to the above, we also select a sample of 10 relaxed “cool core” clusters observed with XMM-Newton for which Pointecouteau et al. (2005), Arnaud et al. (2005) and Pratt et al. (2006a) (hereafter collectively referred to as PAP) have computed gas and total mass profiles. Therefore, in total we have compiled a sample of 21 sets of mass profiles from 19 different clusters (i.e., the samples have two clusters in common).
Both V06 and PAP computed the gas and total mass profiles of their clusters in a similar manner, by fitting parametric forms of the gas density and (3D) temperature profiles of the ICM (see eqns. 3 and 6 of V06 and Appendix A of Pratt et al. 2006a) to the observed, projected surface brightness and temperature profiles. The purpose of these parametric models is to produce a smooth description of the data and hence reduce the noise in the spatial derivatives; the exact form of the models is irrelevant as long as they fit the data well. Note that the assumption of smooth gas in HSE can lead to a small overestimate of the baryon fraction (Mathiesen et al. 1999; Mohr et al. 1999; Rasia et al. 2006), which strengthens our conclusions.
We use the parametric models and associated best-fit parameters listed in V06 and PAP to reconstruct the observed mass profiles. In both studies the total mass distributions were fitted with the Navarro, Frenk & White (1997, NFW) profile derived from cosmological dark matter simulations. Both V06 and PAP demonstrate that the NFW profile fits their data exceptionally well, with an inferred mass-concentration parameter relation that is in good agreement with the results of cosmological simulations.
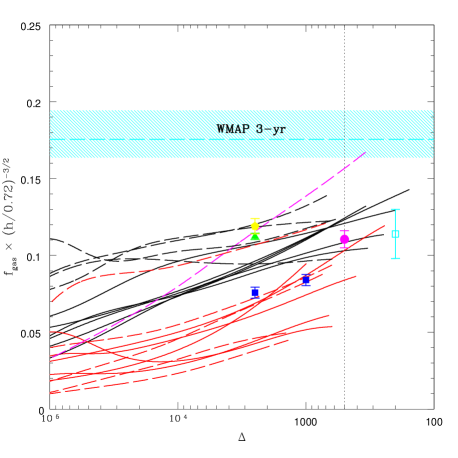
Presented in Figure 1 is a comparison of the observed integrated gas mass fractions as a function of overdensity, , where . In general, the clusters all show a mildly rising gas fraction with decreasing overdensity. However, there is considerable scatter in the gas fraction at fixed overdensity that is worth exploring. First, it is evident that the gas mass fractions measured by PAP are systematically larger than those measured by V06. Given that the gas density profiles from the two samples are quite similar (see McCarthy et al. 2007), the implication is that the temperature profiles measured by PAP and V06 differ systematically from each other. Indeed, V06 generally find temperature profiles that decline relatively rapidly with radius, dropping by roughly a factor of 2 from the peak (at ) to (see also Vikhlinin et al. 2005), while PAP find a much more gradual decline, with some clusters showing approximate isothermality. Through the equation of HSE, a flatter temperature gradient translates into a reduced normalisation of the total mass profile and hence an increased gas mass fraction. While it would be useful to sort out the exact nature of the temperature discrepancy222It now appears that the discrepancy between temperature profiles derived with Chandra and those with XMM-Newton may be nearly resolved. Using a larger sample of clusters observed with XMM-Newton and an improved model for background subtraction, Pratt et al. (2006b) now find steeper temperature declines at large radii which are quite similar to those of V06 (G. W. Pratt, private communication). See also Vikhlinin et al. (2005)., we point out that the typical level of difference between the two is relatively small (compared to the offset of both from the WMAP result, see §3). The one exception to this appears to be A1413, which was observed by both V06 and PAP. Within , V06 find a total mass that is roughly 50% larger than that found by PAP. Increasing the total mass of A1413 by this factor would bring it more in line with the other systems studied by PAP. However, we note that good agreement between PAP and V06 is found for A1991, the only other system in common between the two samples.
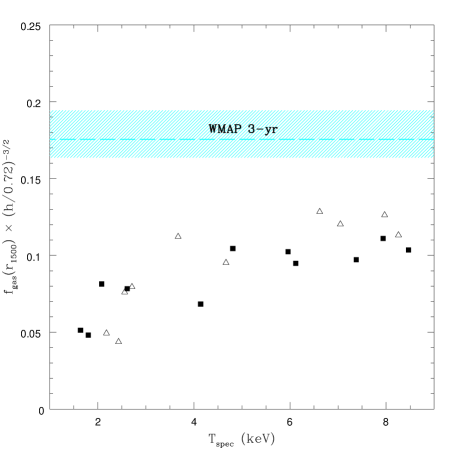
Fig. 1 also shows that the gas fraction depends on system temperature, which presumably reflects total system mass. In particular, systems with mean temperatures below 4.5 keV (red lines) have systematically lower values for within virtually all overdensities compared with hotter systems (black lines). This trend has been noticed previously (e.g., Mohr et al. 1999; Roussel et al. 2000; Neumann & Arnaud 2001) and would seem to indicate that non-gravitational heat sources are relatively more important in mediating the properties of the ICM in low mass than in high mass clusters. In Figure 2, we plot the gas mass fraction within an overdensity of 1500 (typically corresponding to a physical radius of kpc) versus mean system temperature. We have chosen this radius so that all the clusters in the sample (including the coolest systems) have reliable data. Note that if non-gravitational heating is unimportant at it will be even less significant at . A trend with temperature is clearly visible at low temperatures. However, above keV both the Chandra and XMM-Newton data show no evidence for a further increase, and the gas fraction appears to have converged, suggesting that non-gravitational physics is largely unimportant for the most massive systems (at least out at large radii). This is fully consistent with previous results based on ROSAT and ASCA data (Roussel et al. 2000; Lin et al. 2003), as well as newer XMM-Newton data (Sadat et al. 2005). It is also consistent with the findings of McCarthy et al. (2007), that above keV the gas density and entropy profiles of “cool core” systems follow the scaling expected for self-similar gravitational heating at large radius.
We have elected to focus on the data of V06 and PAP since their measurements extend out to . As noted earlier, cosmological simulations can now reliably predict the baryon fraction within this radius. However, measuring the properties of the ICM at such large radii is not easy. The rapidly declining surface brightnesses of the clusters at large radii means that an extremely careful treatment of the background is crucial. For this reason, a number of groups have limited their analyses to smaller radii (higher surface brightnesses) in an attempt to mitigate any potential systematic effects associated with the background modelling. While we are encouraged by the similarity of the results of V06 and PAP at large radii (note also that Chandra and XMM-Newton have different background characteristics), it is useful to check these results against other (mainly small-radii) data from the recent literature.
With the above in mind, we include some other recent X-ray gas mass fraction determinations (within various fixed overdensities) of hot clusters from the literature (data points) in Figure 1. In particular: the (yellow) pentagon represents a weighted average of for the 38 clusters (spanning ) observed by LaRoque et al. (2006) with Chandra [note that LaRoque et al. actually use both Chandra X-ray data and BIMA/OVRO Sunyaev-Zeldovich effect data to constrain ]; the (green) triangle represents a weighted average of for the 26 clusters (spanning ) observed by Allen et al. (2004) with Chandra; the (blue) squares represent weighted averages of and for the 22 clusters (spanning ) observed by Ettori et al. (2002) with BeppoSAX, and; the (magenta) circle represents a weighted average of for the 8 clusters (at ) observed by Sadat et al. (2005) with XMM-Newton.
Although there is some scatter in the averaged values from these different studies, Fig. 1 demonstrates that they are, by and large, consistent with the profiles of V06 and PAP. The one exception is the data of Ettori et al. (2002), which are systematically lower than the others. Since this is the data Ettori (2003) used to show there was only a very small discrepancy between cluster baryon fractions and the first-year WMAP results, we discuss the studies of Ettori et al. (2002) and Ettori (2003) in a bit more detail in §3.
X-ray observations are not the only way one can constrain the gas mass fractions of clusters. Increasingly, the Sunyaev-Zeldovich (SZ) effect is also being used for this purpose. For example, LaRoque et al. (2006) found very similar results for when fitting to both Chandra X-ray data and BIMA/OVRO SZ effect data simultaneously (yellow pentagon in Fig. 1) or when fitting to the SZ effect data alone. More recently, Afshordi et al. (2007) have stacked the SZ effect signals of 193 clusters in the WMAP 3-year data to constrain the thermal energy of the ICM. With the aid of hydrodynamic simulations, they converted this thermal energy into an estimate of the gas fraction of clusters within . Their result, represented by the open (cyan) square in Fig. 1, is in excellent accordance with the X-ray-derived results. This is very encouraging since the systematics involved in the derivation of this result are obviously very different from those associated with X-ray measurements.
3 Implications
In cosmological simulations the baryon fraction within has converged to % of the universal value in the case of non-radiative simulations (e.g., Frenk et al. 1999; Kay et al. 2004; Crain et al. 2006) and slightly higher than this when radiative cooling and star formation is included (e.g., Kravtsov et al. 2005; Ettori et al. 2006). It is only possible to drive a substantial fraction of the baryons beyond if the energy input from non-gravitational heating (such as AGN powered jets and bubbles; e.g., Churazov et al. 2002) is comparable to the binding energy of the cluster gas (we quantify the energy requirement in §3.2). In the absence of such high levels non-gravitational heating, the baryon fractions derived at should be nearly representative of the universal value.
Independent measurements of the universal baryon fraction can be derived from the power spectrum of CMB anisotropies. In Figs. 1 and 2 we show the value of constrained by the WMAP 3-year data (Spergel et al. 2007). From Fig. 1 it is immediately apparent that, with the exception of PAP’s estimate of for A1413, the observational gas mass estimates do not achieve consistency with the WMAP measurements of the baryon fraction within any (observable) overdensity. This is true despite the fact that the XMM-Newton data of PAP extend out to nearly (note that, typically, Mpc) and slightly beyond for the Chandra data of V06. At the lowest observable overdensity (largest radii), the data indicate a gas mass fraction that is roughly 40% lower than inferred from WMAP 3-year data. Fig. 2 demonstrates that the observed gas mass fractions at have converged for systems above keV, and still lie well below the WMAP 3-year constraints. We now examine the possible origins of this sizeable discrepancy. For ease of discussion, we break up the possible solutions into three broad categories.
3.1 Stars and cool baryons
X-ray data by itself constrains only the fraction of a cluster’s mass in the form of hot ( K) gas. A proper comparison to the universal WMAP baryon fraction therefore requires that we take into account the fraction of cluster’s baryons locked up in cool gas (that doesn’t emit X-rays), stars and baryonic dark matter. If clusters manage to significantly cool of their baryons this would potentially resolve the discrepancy described above. Indeed, cosmological simulations that take into account the effects of radiative cooling and star formation demonstrate that clusters can potentially cool out such large quantities of their baryons (e.g., Davé et al. 2002; Kravtsov et al. 2005). But such simulations are at odds with near-infrared (K-band) observations of clusters, which typically indicate that the total (resolved) stellar mass is at most 5-14% of the ICM gas mass in hot ( keV) clusters and only slightly higher than this in cooler systems333We note that some previous studies (e.g., Ettori 2003; Voevodkin & Vikhlinin 2004) estimated slightly higher stellar fractions (typically 15-20%) based on V- and B-band cluster observations. However, due to uncertain age and metallicity effects, conversion to stellar mass from the V- and B-bands is less reliable than converting from the K-band. (e.g., Balogh et al. 2001; Lin et al. 2003). Recent deep optical observations limit the contribution of diffuse intracluster light to between of the total stellar luminosity (e.g., Gonzalez et al. 2005; Zibetti et al. 2005). Low mass stars and brown dwarfs (or “rocks”) are also likely to be a significant, undetected component of the mass budget, but there is no strong evidence that they are more abundant than expected from standard initial mass functions used to extrapolate the observed stellar mass functions (Fuchs, Jahreiss & Flynn 1998; Gizis et al. 2000; Lucas et al. 2005; Levine et al. 2006). Radio, infrared, and ultraviolet surveys for atomic, molecular, and ionised gas (respectively) limit the contribution of cool ( K) diffuse baryons to less than a percent or so of the hot X-ray-emitting ICM (e.g., O’Dea et al. 1998; Donahue et al. 2000; Edge 2001; Edge & Frayer 2003; Bregman et al. 2006). Finally, Ettori (2003) have suggested that a significant fraction of cluster baryons could lie at temperatures between K and they cite possible evidence for this in the form the observed “soft X-ray excess”. However, it now appears that this excess was the result of inadequate modelling of the Galactic foreground (Bregman & Lloyd-Davies 2006). Furthermore, it is unclear physically how such large quantities of gas in this temperature range could resist cooling down to K or being mixed or heated to the ambient ICM temperature.
Furthermore, one can place limits on any hidden cold baryonic component by considering its gravitational effects on the properties of the ICM. In particular, if the hidden material is centrally concentrated, as one would expect if its origin is linked to cooling, this will deepen the potential well which, in turn, will heat the ICM through simple gravitational compression. The observed temperature profiles can therefore be used to place constraints on the amount of hidden cold material in clusters. We have tested this as follows. In particular, we assume the dark matter follows a NFW distribution with a typical concentration parameter . We further assume the gas density profile follows a distribution typical of observed “cool core” clusters (see V06; McCarthy et al. 2007). Finally, we try different hidden cold mass distributions. The predicted ICM temperature distributions are computed by placing the gas in HSE. In the case where there is no hidden component, we find the resulting temperature profiles quantitatively match the observed ones. This is not unexpected, given the results of McCarthy et al. (2007) (see §3.1 of that study). However, the predicted temperature profiles are quite sensitive to the addition of a centrally-concentrated cold component. In particular, if we require that the predicted temperature profiles are within the observational uncertainties (typically, binned temperature profiles have a 10% measurement uncertainty), we can rule out a cold component weighing within the central 50 kpc or within the central 100 kpc. (Note that our results at a fixed radius are not sensitive to the distribution of the cold component, only to the total enclosed mass within that radius.) This is small compared to the required to resolve the cluster vs. CMB discrepancy for a massive cluster. The only way to reconcile the cluster vs. CMB discrepancy and maintain consistency with the observed temperature profiles is if the hidden component is very spatially-extended. However, such a configuration seems physically contrived.
It therefore appears that the stellar/cool baryon contribution to the total cluster baryon budget too small to account for the cluster vs. CMB discrepancy. In particular, the resolved stellar/cold baryon component is a approximately factor of 3 smaller than required. Moreover, we have demonstrated that any hidden component cannot be very massive, otherwise this would violate the observed temperature profiles of relaxed clusters.
3.2 Non-gravitational heating
As discussed above, the small fraction of cooled baryons observed, relative to the predictions of cooling-only simulations, implies that some form of non-gravitational heating (“feedback”) is at work in the ICM. Without significant feedback to prevent this overcooling, theoretical models are unable to account for the observed cut-off of the galaxy luminosity function at the bright end or the fact that BCGs are, by and large, “red and dead” (e.g., Benson et al. 2003; Bower et al. 2006), nor would it be possible to explain the lack of X-ray emission from intracluster gas with temperatures below about 1 keV (e.g., Peterson et al. 2003). Non-gravitational heating also appears to be necessary to account for the X-ray scaling properties of clusters (e.g., Kaiser 1991; Evrard & Henry 1991; Babul et al. 2002; Voit et al. 2002; McCarthy et al. 2004). Injecting thermal energy into the ICM will cause it to expand (while leaving the dark matter in-tact) and therefore will reduce the gas mass fraction within a given radius. Can this heating explain the discrepancy between cluster and CMB measurements?
To test this, we have computed the bulk energy required to transform clusters with the universal baryon fraction (all in hot gas) into the observed systems. For our baseline model clusters, we assume the gas traces the total matter at all radii and, therefore, within any radius the integrated gas mass fraction is always the best-fit WMAP 3-year value . The total mass profiles (which are dominated by dark matter) are assumed to be the same as those measured by V06 and PAP, thus we construct a baseline model cluster for each of the observed systems. The temperature profiles are determined by placing the gas in HSE. Calculating the total energy of the gas in these systems (i.e., the summation of the total internal and potential energies) is then straightforward. For the observed systems, we extrapolate the gas and total density profiles beyond the maximum radius to which they can be observed, until the integrated gas mass fraction is the universal ratio. (Note that we also extrapolate the baseline models to this radius to ensure that both the baseline and observed systems have the same integrated gas and total masses.). We assume the total density profiles continue to follow the NFW form fit by V06 and PAP. We try various different powerlaw extrapolations for the gas density profiles with plausible indices ranging from to . We find that the minimum energy required to convert the baseline models into the observed systems occurs when the gas density is constant with radius outside the maximum observable radius. This configuration is perhaps unlikely, but it does provide a useful lower limit to the amount of heating required. Like the baseline models, we place the gas in the observed systems in HSE. Reassuringly, we verify that the resulting temperature profiles are in good agreement with the observed profiles. The total (minimum) energy required to heat the ICM is just the difference of the total energy of the observed and baseline model systems.
For hot ( keV) clusters, we find that a substantial amount of energy is required, ranging between ergs with a mean of ergs (assuming is constant outside the maximum observable radius - i.e., the minimum required energy). It is interesting to compare this minimum energy estimate with the energy that can potentially be deposited by AGN, the most powerful source of non-gravitational heating we know of in clusters of galaxies. (We note that the energy available from AGN far exceeds that available from stellar feedback.) We estimate the amount of AGN energy available to be tapped as follows. First, we convert Lin et al. (2003)’s observed relationship between stellar mass fraction and total mass within (see equation 10 of that study444We have slightly adjusted this relation by scaling up the total masses of Lin et al. by 1.26 to account for the normalisation difference between the ASCA total mass-temperature relation assumed by Lin et al. and the more accurate Chandra relation measured by V06.) into a stellar—total mass relation [i.e., ] assuming a gas mass fraction of 0.12 within (see Fig. 1). This relation can be converted into a relationship between the total mass in black holes within by (optimistically) assuming that the entire stellar mass is contained in bulges and adopting the black hole—bulge mass () relation of Häring & Rix (2004). This leads to the following relation:
| (1) | |||

Finally, this is converted into an estimate of amount of AGN energy available via .
In Figure 3, we present a comparison of the minimum specific energy required to resolve the cluster vs. CMB discrepancy with the energy available to be tapped in black holes. (To facilitate comparison with the observations, we calculate the specific energy by dividing the total required energy by the typical observed mass of gas within r500. In particular, we assume ; see Fig. 1.). In order to explain the most massive systems, we calculate that a minimum energy of keV per particle is required. If one adopts an efficiency of , which is approximately the efficiency predicted by standard radiatively efficient accretion disk models (e.g., Shakura & Sunyaev 1973), there is potentially just enough energy available in black holes distributed throughout to account for the observed gas mass fractions. (We use the term ‘potentially’ since we remind the reader that we have calculated the minimum energy required and furthermore have made optimistic assumptions about the mass of black holes available to heat the ICM.) This result agrees quite well with the more detailed calculations of Bode et al. (2007) (that include, e.g., the effects of asphericity and substructure), when one normalises their estimated required total energy to the same total mass of gas assumed above.
However, modelling of AGN-blown X-ray cavities suggests the typical cluster black hole efficiency is actually much lower than . The most energetic AGN outbursts known, in Hercules A (Nulsen et al. 2005) and MS0735.6+7421 (McNamara et al. 2005), have mean powers of ergs s-1. The typical age of such outbursts is 100 Myr, corresponding to a total energy of few times ergs or a specific energy of a few tenths of a keV per particle (see the thick dashed line in Fig. 3). This falls nearly two orders of magnitude short of the required minimum to reduce a massive cluster’s baryon fraction from the universal WMAP value to the observed fraction. Therefore, even if a typical cluster experiences 10 such powerful outbursts over its lifetime (say, once per Gyr over 10 Gyr) the energy injected into the ICM still falls short of the minimum required energy by up to an order of magnitude.
We therefore conclude that AGN heating is a highly implausible, but perhaps not impossible, solution to the cluster vs. CMB discrepancy. In addition to the exceptionally large energy requirements, we point out that the heating must be distributed in just such a way as to explain the convergence trend in Fig. 2 and the fact that the ICM properties at large radii in massive clusters follow the gravitational self-similar scalings (McCarthy et al. 2007).
3.3 Different cosmological parameters: and
The observed gas fractions are proportional to , while the WMAP constraint is independent of . Thus, adopting a lower value of would bring these two results into agreement. Indeed, this is why similar analyses by Roussel et al. (2000) and Sadat et al. (2005), who adopt , find higher gas fractions than we have shown here. However, the large body of independent evidence in favour of (e.g. York et al. 2005; Jones et al. 2005; Riess et al. 2005; Ngeow & Kanbur 2006) makes this solution seem unlikely.
We can use the observed baryon content of clusters to reverse-engineer the universal total matter density, , via:
| (2) |
where is the baryon depletion factor within and is the observational bias introduced by assuming strict HSE (i.e., ignores pressure support due to turbulent motions), both of which can be estimated using gasdynamic cosmological simulations.
Adopting the WMAP baryon density of (which is in good agreement with the latest QSO constraints; see O’Meara et al. 2006), (Kravtsov et al. 2005; Ettori et al. 2006; Crain et al. 2006), (Nagai et al. 2007), (see §3.1), and (see Fig. 1 - note that this spans both the Chandra and XMM-Newton results at ), we find:
This is larger than the best-fit WMAP 3-year value of , but is in good agreement with several previous X-ray analyses (e.g., Allen et al. 2002; Lin et al. 2003; Hicks et al. 2006).
However, our findings differ somewhat from those of Ettori (2003). He found evidence for only a marginal discrepancy between his cluster baryon fraction estimates (inferred from BeppoSAX X-ray data) and the first-year WMAP results (Spergel et al. 2003). This is somewhat surprising since Ettori (2003) used the data of Ettori et al. (2002), who actually find lower gas mass fractions than we have assumed above. A likely explanation for this discrepancy is that: (1) he assumed a slightly higher stellar mass fraction; (2) he invoked a large fraction of the cluster baryons being hidden at “warm” temperatures of K; and (3) he extrapolated his results well beyond the maximum observable radius () to the virial radius assuming a King total mass profile for several of his systems. The first two are inconsistent with recent, more reliable data (see §3.1). Finally, extrapolation of the data out to the virial radius is highly uncertain. Since simulations and observations now reliably extend out to , such large extrapolations are no longer required.
In addition to the agreement with several previous X-ray studies, our results on also agree with Sloan Digital Sky Survey (SDSS) measurements of the Lyman alpha forest power spectrum (Viel & Haehnelt 2005), the baryon acoustic peak of luminous red galaxies (Eisenstein et al. 2005), and the power spectrum of galaxies (Tegmark et al. 2004). We also note that combining WMAP 3-year joint constraints on and (which are degenerate, see below) with weak lensing cosmic shear measurements (Hoekstra et al. 2006) results in an increased best-fit value for that is in good agreement with our results (see Fig. 7 or Spergel et al. 2007). Finally, Li et al. (2006) have also recently reported that the “low” value of reported by Spergel et al. (2007) is in discord with the number of observed strong lensing giant arcs, however a fiducial flat model with and is able to match the lensing data.
On the other hand, several other cosmological tests tend to support the “low” value of advocated by Spergel et al. (2007). These include measurements of the motions within the local supercluster (Mohayaee & Tully 2005), the power spectrum of galaxies in the 2dFGRS (Cole et al. 2005), and the mass function of galaxy clusters in the HIFLUGCS X-ray flux-limited sample (Reiprich 2006).
Clearly, the relatively large scatter in the reported best fit values of warrants further detailed investigation. While our own estimate of is marginally inconsistent with the WMAP 3-year constraints (and some of the other tests that support the WMAP result), we have argued that this discrepancy is a small price to pay for obtaining agreement with the observed cluster gas mass fractions. Finally, we point out that the discussion carries implications beyond the precise value of . Since and are strongly degenerate in the CMB data, our results suggest that is larger than the best-fit value of derived from WMAP data alone. It is interesting to note that a model with and is within sigma of both the cluster gas mass fraction data and the WMAP joint constraints on these parameters.
4 Conclusions
Recent, good quality observations of massive clusters with Chandra and XMM-Newton put strong observational constraints on the gas mass fraction in massive clusters at large radius. In many cases the new data allow the fraction to be constrained out to (the radius at which the cluster density contrast is 500). Simulations of clusters suggest that the cluster gas fraction at this radius should closely reflect the average baryon mass fraction in the universe as a whole.
We find , where the uncertainty reflects the systematic variations between clusters. This is lower than the best fit to the WMAP 3-year result of .
We consider whether the discrepancy could be due to a large fraction of the cluster gas cooling to form stars and cold gas clouds, or whether it could be due to strong non-gravitational heating transporting % of the cluster gas outside . Observational limits on the stellar and cold gas content of clusters appear to rule out the first possibility. In order to investigate the second, we compute the energy budget required to rearrange the cluster gas. The energy required significantly exceeds the plausible energy input from black holes, unless their mass accretion history is always associated with efficient jet production.
The most likely explanation is that lies in the range . Such a relatively high lies slightly above the 68 per cent confidence limits from WMAP, but is consistent with the current data at the level. Since the measurements of and are highly correlated in the WMAP analysis, this means that is also likely to be higher than the formal best-fit value of . This has important implications for the abundance of collapsed objects prior to re-ionisation (Reed et al. 2007).
Acknowledgments
The authors would like to thank Carlos Frenk and David Hogg for helpful discussions and the anonymous referee for suggestions that improved the paper. IGM acknowledges support from a NSERC Postdoctoral Fellowship and a PPARC rolling grant for extragalactic astronomy and cosmology at the University of Durham. RGB acknowledges the support of a PPARC senior fellowship. MLB acknowledges support from a NSERC Discovery Grant.
References
- Afshordi et al. (2007) Afshordi, N., Lin, Y.-T., Nagai, D., & Sanderson, A. J. R. 2007, MNRAS, submitted (astro-ph/0612700)
- Allen et al. (2002) Allen, S. W., Schmidt, R. W., & Fabian, A. C. 2002, MNRAS, 334, L11
- Allen et al. (2004) Allen, S. W., Schmidt, R. W., Ebeling, H., Fabian, A. C., & van Speybroeck, L. 2004, MNRAS, 353, 457
- Arnaud et al. (2005) Arnaud, M., Pointecouteau, E., & Pratt, G. W. 2005, A&A, 441, 893
- Babul et al. (2002) Babul, A., Balogh, M. L., Lewis, G. F., & Poole, G. B. 2002, MNRAS, 330, 329
- Balogh et al. (2001) Balogh, M. L., Pearce, F. R., Bower, R. G., & Kay, S. T. 2001, MNRAS, 326, 1228
- Benson et al. (2003) Benson, A. J., Bower, R. G., Frenk, C. S., Lacey, C. G., Baugh, C. M., & Cole, S. 2003, ApJ, 599, 38
- Bode et al. (2007) Bode, P., Ostriker, J. P., Weller, J., & Shaw, L. 2007, ApJ, submitted (astro-ph/0612663)
- Bower et al. (2006) Bower, R. G., Benson, A. J., Malbon, R., Helly, J. C., Frenk, C. S., Baugh, C. M., Cole, S., & Lacey, C. G. 2006, MNRAS, 370, 645
- Bregman et al. (2006) Bregman, J. N., Fabian, A. C., Miller, E. D., & Irwin, J. A. 2006, ApJ, 642, 746
- Crain et al. (2007) Crain, R. A., Eke, V. R., Frenk, C. S., Jenkins, A., McCarthy, I. G., Navarro, J. F., & Pearce, F. R. 2007, MNRAS, in press (astro-ph/0610602)
- Churazov et al. (2002) Churazov, E., Sunyaev, R., Forman, W., Bohringer, H. 2002, MNRAS, 332, 729
- Cole et al. (2005) Cole, S., et al. 2005, MNRAS, 362, 505
- Davé et al. (2002) Davé, R., Katz, N., & Weinberg, D. H. 2002, ApJ, 579, 23
- David et al. (1995) David, L. P., Jones, C., & Forman, W. 1995, ApJ, 445, 578
- Donahue et al. (2000) Donahue, M., Mack, J., Voit, G. M., Sparks, W., Elston, R., & Maloney, P. R. 2000, ApJ, 545, 670
- Edge (2001) Edge, A. C. 2001, MNRAS, 328, 762
- Edge & Frayer (2003) Edge, A. C., & Frayer, D. T. 2003, ApJL, 594, L13
- Eisenstein et al. (2005) Eisenstein, D. J., et al. 2005, ApJ, 633, 560
- Ettori (2003) Ettori, S. 2003, MNRAS, 344, L13
- Ettori et al. (2002) Ettori, S., De Grandi, S., & Molendi, S. 2002, A&A, 391, 841
- Ettori et al. (2006) Ettori, S., Dolag, K., Borgani, S., & Murante, G. 2006, MNRAS, 365, 1021
- Evrard (1997) Evrard, A. E. 1997, MNRAS, 292, 289
- Evrard & Henry (1991) Evrard, A. E., & Henry, J. P. 1991, ApJ, 383, 95
- Evrard et al. (1996) Evrard, A. E., Metzler, C. A., & Navarro, J. F. 1996, ApJ, 469, 494
- Frenk et al. (1999) Frenk, C. S., et al. 1999, ApJ, 525, 554
- Fuchs et al. (1998) Fuchs, B., Jahreiss, H., & Flynn, C. 1998, A&A, 339, 405
- Gizis et al. (2000) Gizis, J. E., Monet, D. G., Reid, I. N., Kirkpatrick, J. D., Liebert, J., & Williams, R. J. 2000, AJ, 120, 1085
- Gonzalez et al. (2005) Gonzalez, A. H., Zabludoff, A. I., & Zaritsky, D. 2005, ApJ, 618, 195
- Häring & Rix (2004) Häring, N., & Rix, H.-W. 2004, ApJL, 604, L89
- Hicks et al. (2006) Hicks, A. K., Ellingson, E., Hoekstra, H., & Yee, H. K. C. 2006, ApJ, 652, 232
- Hoekstra et al. (2006) Hoekstra, H., et al. 2006, ApJ, 647, 116
- Jones et al. (2005) Jones, M. E., et al. 2005, MNRAS, 357, 518
- Kaiser (1991) Kaiser, N. 1991, ApJ, 383, 104
- Kay et al. (2004) Kay, S. T., Thomas, P. A., Jenkins, A., & Pearce, F. R. 2004, MNRAS, 355, 1091
- Kravtsov et al. (2005) Kravtsov, A. V., Nagai, D., & Vikhlinin, A. A. 2005, ApJ, 625, 588
- Levine et al. (2006) Levine, J. L., Steinhauer, A., Elston, R. J., & Lada, E. A. 2006, ApJ, 646, 1215
- Li et al. (2006) Li, G. L., Mao, S., Jing, Y. P., Mo, H. J., Gao, L., & Lin, W. P. 2006, MNRAS, 372, L73
- Lin et al. (2003) Lin, Y.-T., Mohr, J. J., & Stanford, S. A. 2003, ApJ, 591, 749
- Lucas et al. (2005) Lucas, P. W., Roche, P. F., & Tamura, M. 2005, MNRAS, 361, 211
- Mathiesen et al. (1999) Mathiesen, B., Evrard, A. E., & Mohr, J. J. 1999, ApJL, 520, L21
- McCarthy et al. (2004) McCarthy, I. G., Balogh, M. L., Babul, A., Poole, G. B., & Horner, D. J. 2004, ApJ, 613, 811
- McCarthy et al. (2007) McCarthy, I. G., Babul, A., Bower, R. G., & Balogh, M. L., 2007, MNRAS, submitted
- McNamara et al. (2005) McNamara, B. R., Nulsen, P. E. J., Wise, M. W., Rafferty, D. A., Carilli, C., Sarazin, C. L., & Blanton, E. L. 2005, Nature, 433, 45
- Mohayaee & Tully (2005) Mohayaee, R., & Tully, R. B. 2005, ApJL, 635, L113
- Mohr et al. (1999) Mohr, J. J., Mathiesen, B., & Evrard, A. E. 1999, ApJ, 517, 627
- Nagai et al. (2007) Nagai, D., Vikhlinin, A., & Kravtsov, A. V. 2007, ApJ, 655, 98
- Navarro et al. (1997) Navarro, J. F., Frenk, C. S., & White, S. D. M. 1997, ApJ, 490, 493
- Neumann & Arnaud (2001) Neumann, D. M., & Arnaud, M. 2001, A&A, 373, L33
- Ngeow & Kanbur (2006) Ngeow, C., & Kanbur, S. M. 2006, ApJL, 642, L29
- Nulsen et al. (2005) Nulsen, P. E. J., Hambrick, D. C., McNamara, B. R., Rafferty, D., Birzan, L., Wise, M. W., & David, L. P. 2005, ApJL, 625, L9
- O’Dea et al. (1998) O’Dea, C. P., Payne, H. E., & Kocevski, D. 1998, AJ, 116, 623
- O’Meara et al. (2006) O’Meara, J. M., Burles, S., Prochaska, J. X., Prochter, G. E., Bernstein, R. A., & Burgess, K. M. 2006, ApJL, 649, L61
- Peterson et al. (2003) Peterson, J. R., Kahn, S. M., Paerels, F. B. S., Kaastra, J. S., Tamura, T., Bleeker, J. A. M., Ferrigno, C., & Jernigan, J. G. 2003, ApJ, 590, 207
- Pointecouteau et al. (2005) Pointecouteau, E., Arnaud, M., & Pratt, G. W. 2005, A&A, 435, 1
- Pratt et al. (2006a) Pratt, G. W., Arnaud, M., & Pointecouteau, E. 2006, A&A, 446, 429
- Pratt et al. (2006b) Pratt, G. W., et al. 2006, A&A, submitted
- Rasia et al. (2006) Rasia, E., et al. 2006, MNRAS, 369, 2013
- Reed et al. (2007) Reed, D. S., Bower, R., Frenk, C. S., Jenkins, A., & Theuns, T. 2007, MNRAS, 374, 2
- Reiprich (2006) Reiprich, T. H. 2006, A&A, 453, L39
- Riess et al. (2005) Riess, A. G., et al. 2005, ApJ, 627, 579
- Roussel et al. (2000) Roussel, H., Sadat, R., & Blanchard, A. 2000, A&A, 361, 429
- Sadat et al. (2005) Sadat, R., et al. 2005, A&A, 437, 31
- Shakura & Sunyaev (1973) Shakura, N. I., & Sunyaev, R. A. 1973, A&A, 24, 337
- Spergel et al. (2007) Spergel, D. N., et al. 2007, ArXiv Astrophysics e-prints, arXiv:astro-ph/0603449
- Spergel et al. (2003) Spergel, D. N., et al. 2003, ApJS, 148, 175
- Tegmark et al. (2004) Tegmark, M., et al. 2004, ApJ, 606, 702
- Tornatore et al. (2003) Tornatore, L., Borgani, S., Springel, V., Matteucci, F., Menci, N., & Murante, G. 2003, MNRAS, 342, 1025
- Viel & Haehnelt (2006) Viel, M., & Haehnelt, M. G. 2006, MNRAS, 365, 231
- Vikhlinin et al. (2006) Vikhlinin, A., Kravtsov, A., Forman, W., Jones, C., Markevitch, M., Murray, S. S., & Van Speybroeck, L. 2006, ApJ, 640, 691 (V06)
- Vikhlinin et al. (2005) Vikhlinin, A., Markevitch, M., Murray, S. S., Jones, C., Forman, W., & Van Speybroeck, L. 2005, ApJ, 628, 655
- Voevodkin & Vikhlinin (2004) Voevodkin, A., & Vikhlinin, A. 2004, ApJ, 601, 610
- Voit et al. (2002) Voit, G. M., Bryan, G. L., Balogh, M. L., & Bower, R. G. 2002, ApJ, 576, 601
- White et al. (1993) White, S. D. M., Navarro, J. F., Evrard, A. E., & Frenk, C. S. 1993, Nature, 366, 429
- York et al. (2005) York, T., Jackson, N., Browne, I. W. A., Wucknitz, O., & Skelton, J. E. 2005, MNRAS, 357, 124
- Zibetti et al. (2005) Zibetti, S., White, S. D. M., Schneider, D. P., & Brinkmann, J. 2005, MNRAS, 358, 949