An X-ray Census of Young Stars in the Massive Southern Star-Forming Complex NGC 6357
Abstract
We present the first high spatial resolution X-ray study of the massive star forming region NGC 6357, obtained in a 38 ks Chandra/ACIS observation. Inside the brightest constituent of this large HII region complex is the massive open cluster Pismis 24. It contains two of the brightest and bluest stars known, yet remains poorly studied; only a handful of optically bright stellar members have been identified. We investigate the cluster extent and Initial Mass Function and detect 800 X-ray sources with a limiting sensitivity of ergs s-1; this provides the first reliable probe of the rich intermediate-mass and low-mass population of this massive cluster, increasing the number of known members from optical study by a factor of . The high luminosity end ([2-8 keV] ergs s-1) of the observed X-ray luminosity function in NGC 6357 is clearly consistent with a power law relation as seen in the Orion Nebula Cluster and Cepheus B, yielding the first estimate of NGC 6357’s total cluster population, a few times the known Orion population. We investigate the structure of the cluster, finding small-scale substructures superposed on a spherical cluster with 6 pc extent, and discuss its relationship to the nebular morphology. The long-standing correlation for O stars is confirmed. Twenty-four candidate O stars and one possible new obscured massive YSO or Wolf-Rayet star are presented. Many cluster members are estimated to be intermediate-mass stars from available infrared photometry (assuming an age of Myr), but only a few exhibit -band excess. We report the first detection of X-ray emission from an Evaporating Gaseous Globule at the tip of a molecular pillar; this source is likely a B0-B2 protostar.
1 Introduction
NGC 6357 (catalog ) (= W 22 = RCW 131 = S 11) is a large H ii region complex in the southern sky excited by the OB association Pismis 24, at a distance of kpc (Neckel, 1978; Felli et al., 1990; Massi et al., 1997; Bohigas et al., 2004). This young stellar cluster and its surrounding gaseous environment are relatively poorly studied; only a handful of stellar members have been identified and characterized, and the molecular cloud has not been well-mapped. In optical and near-infrared images, the exciting cluster is not prominent against the Galactic field population except for a few bright members (Figure 1). Yet, two of these stars are remarkably luminous and massive with spectral types O3 If (M M⊙) and O3 III (M M⊙; Massey et al., 2001; Walborn et al., 2002). Such massive stars are usually found in only the richest Galactic clusters and the giant starburst regions such as Carina, 30 Doradus, and NGC 3603. This raises the question is Pismis 24 much richer than it appears, or is it a poor cluster with a top-heavy Initial Mass Function (IMF)? This would be highly unusual, as top-heavy IMFs are seen only in extreme starburst environments such as the super-star clusters of M 82 (Elmegreen, 2005).
We investigate this question by measuring, for the first time, the low-mass pre-main sequence (pre-MS) population of the Pismis 24 cluster and its environs. This is achieved with a sensitive X-ray observation with the Chandra X-ray Observatory. Chandra observations can penetrate heavy absorption up to (Grosso et al., 2005) and resolve point sources with sub-arcsecond resolution. In most cases, the X-ray detected stars appear on existing near-infrared (NIR) images; the advantage is that the strong X-ray emission of pre-MS stars (elevated above MS stars Preibisch & Feigelson, 2005) traces magnetic activity rather than photospheric or circumstellar disk emission, therefore effectively discriminating cluster members from older Galactic field stars. We estimate that the cluster has stars, times richer than the known Orion Nebula Cluster. The presence of two O3 stars is compatible with a cluster of this population. The known massive stars and the large number of low mass X-ray stars suggest that Pismis 24 is a very rich cluster with a standard IMF.
Our study also gives considerable new information about the cluster and its X-ray properties. We provide a census of 750 cluster members with sub-arcsecond positions, 613 of which have NIR counterparts. Although not complete, the survey includes pre-MS stars with masses extending down to ; most do not have circumstellar disks revealed by -band excess. We study the spatial distribution of the cluster members and identify a possible subcluster. We examine the ringlike morphology of the NGC 6357 nebula and investigate the possible feedback from the massive stars to their environs. We measure X-ray properties of a dozen known O stars, and list over 20 new candidate O stars. A faint X-ray source is found associated with a protostar in an Evaporating Gaseous Globule (EGG) for the first time. A few pre-MS stars are seen with very powerful X-ray flares with peak ergs s-1.
Section 2 reviews past study of the Pismis 24 cluster and NGC 6357 region. The Chandra observation and its analysis are described in §3, and a NIR observation using the Simultaneous 3 color InfraRed Imager for Unbiased Surveys (SIRIUS) camera on the Infrared Survey Facility (IRSF) telescope is summarized in §3.5. The association between X-ray sources and optical and near-infrared (ONIR) stars, as well as the infrared colors of X-ray counterparts are presented in §4. The cluster population inferred from the X-ray emitting stars, their X-ray luminosity function (XLF), the spatial distribution of the cluster members, and the morphology of the nebula are discussed in §5. X-ray properties of O stars and intermediate- to low-mass pre-MS stars are presented in §6. The possibility of diffuse X-ray emission is examined in §7. A brief summary of our findings is given in §8. This study is part of a series of X-ray investigations of high-mass star formation regions that includes the Rosette Nebula (Townsley et al. 2003; Wang et al., in preparation), M 17 (Townsley et al. 2003; Broos et al., in preparation), the Orion Nebula (Feigelson et al. 2003; Getman et al. 2005 and associated articles), 30 Doradus (Townsley et al. 2006a, 2006b), and Cepheus B/OB3b (Getman et al. 2006).
2 Observational Overview of NGC 6357 and Pismis 24
NGC 6357, a large H ii region complex showing an annular morphology in the radio and optical (Haynes et al., 1978; Lortet et al., 1984), is located in the Sagittarius spiral arm and spans in the southern sky. NGC 6334, another prominent star-forming complex likely associated with NGC 6357, lies away (Neckel, 1978; Ezoe et al., 2006). The massive open cluster Pismis 24 (= C 1722-343 = OCl 1016) lies in NGC 6357’s central cavity (Pismis, 1959; Alter et al., 1970). The kinematic distance to NGC 6357, kpc, is given by Wilson et al. (1970). Neckel (1978) derives kpc with improved accuracy based on and H data. Spectroscopic parallax of 10 high-mass members in Pismis 24 gives a larger distance of kpc (Massey et al., 2001), which we adopt in this paper. We should note that recent work (Kharchenko et al., 2005; Prisinzano et al., 2005; Arias et al., 2006) has found smaller distances to other high mass star forming regions (e.g., M8) than previous studies; we will discuss the uncertainties in distance-related stellar properties wherever applicable.
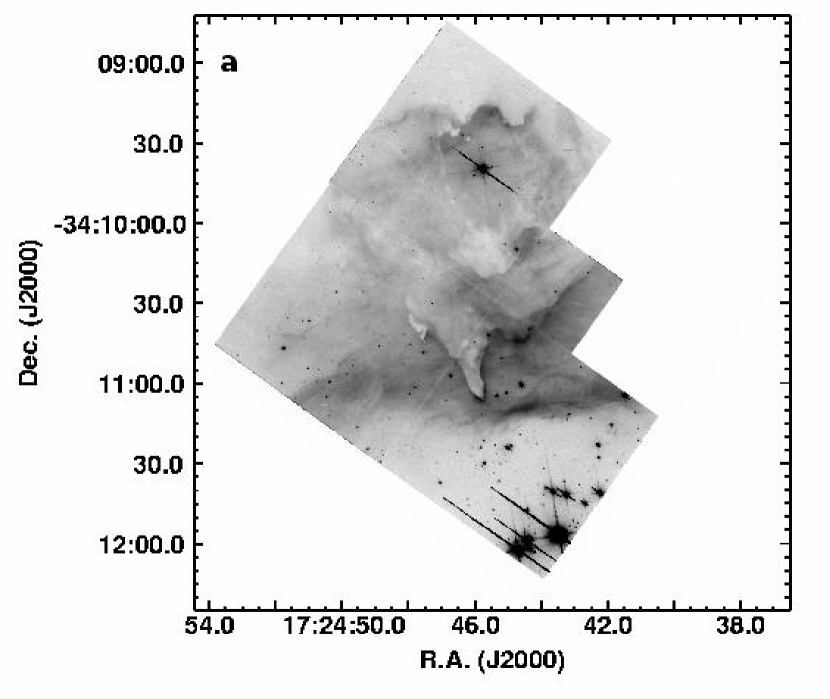
Figure 1b shows the large-scale morphology in the mid-infrared, observed with the Midcourse Space Experiment (MSX) satellite. A large ring-like structure extends in diameter and bright nebulosity is seen at the northern rim. The central cavity appears free of large amounts of warm dust. Far-infrared (FIR) continuum revealed several luminous (L L⊙) embedded sources coincident with CO line and radio continuum emission peaks (McBreen et al., 1983). G353.2+0.9, which we study here, is the youngest ( yr) and brightest of NGC 6357’s three H ii regions. It lies at the northern interface between the cluster and molecular cloud and contains a number of embedded sources (Figure 1a; Frogel & Persson, 1974; Sakellis et al., 1984; Persi et al., 1986; Massi et al., 1997; Bohigas et al., 2004). In contrast with NGC 6334, almost no water maser emission is found in NGC 6357 (Healy et al., 2004a). This may either indicate that massive star formation has ceased in the region (Persi et al., 1986) or that it has been overrun by the ionization front (Healy et al., 2004a). G353.1+0.6 is a more evolved H ii region viewed edge-on, bounded on the northern side by a different molecular cloud. It contains a single O5 star, several B stars and embedded IR sources, but no indication of current star formation can be found (Felli et al., 1990; Massi et al., 1997). G353.2+0.7, which is also a FIR peak, does not contain early type stars (Felli et al., 1990; Massi et al., 1997), but it hosts the only water maser found in NGC 6357 (Sakellis et al., 1984). However, Persi et al. (1986) identifies this water maser source as an evolved late M star.
Despite a number of optical, infrared, and radio studies on NGC 6357, no X-ray observation of this field has been reported. Figure 1f shows an unpublished 9 ks ROSAT PSPC observation revealing a few strong X-ray sources, including NGC 6357’s three H ii regions. The brightest X-ray emission coincides with the core of the Pismis 24 cluster, but the ROSAT instrumentation was unable to resolve the source population.
The OB cluster Pismis 24 is centered south of the G353.2+0.9 ionization front. Early optical study of NGC 6357 and Pismis 24 revealed O-type and early B-type stars (Moffat & Vogt, 1973; Neckel, 1978, 1984; Lortet et al., 1984), including the unusally late-type WC7+O7-9 Wolf-Rayet (WR)/O star binary HD 157504 (= WR 93; van der Hucht, 2001). Two of the cluster members, namely Pismis 24-1 (=HDE 319718) and Pismis 24-17, were recently classified as spectral type O3.5, some of the brightest and bluest stars known (Massey et al., 2001; Walborn et al., 2002). Only a dozen other O3 stars are known in the Galaxy (Massey & Johnson, 1993; Walborn, 1994; Maíz-Apellániz et al., 2004). The two luminous O3 stars are easily identified close to the sharp boundary of the bright optical nebula in the optical image, accompanied by several other bright cluster members extending north-south (Figure 1e), but are not as apparent in the Two Micron All Sky Survey (2MASS) K-band image (Figure 1c). Figure 1d shows a SIRIUS composite image, which has higher resolution and penetrates deeper into the cloud than 2MASS. The two luminous O stars are evident in the center of the SIRIUS image, which contains thousands of stars. Other noticeable features are the bright nebula with tenuous diffuse filaments in the north and the infrared dark column occupying the south-east corner of the image, previously noted as the south eastern complex (S.E.C.) in CO mapping (Massi et al., 1997). Several heavily reddened stars can be seen in the S.E.C. region. However, most NIR stars are foreground and background objects, not cluster members.
Although most researchers believe G353.2+0.9 is excited by the hot stars in Pismis 24 (e.g., Lortet et al., 1984), Felli et al. (1990) argued that Pismis 24 is projected onto the H ii region by chance, and the embedded massive stars (IRS 1, 2, and 4; Persi et al., 1986) supply the ionizing radiation. Recent studies do not support this claim. Massi et al. (1997) have shown that most molecular gas lies behind the H ii region and the cluster location is consistent with a face-on blister-type H ii region morphology. Optical spectroscopic study by Bohigas et al. (2004) indicates that the hot O stars of Pismis 24 emit UV photons s-1, sufficient to ionize the H ii region.
Massey et al. (2001) consider the W-R/O binary WR 93, lying 4′ away from the cluster core, to be a likely member of Pismis 24 and caution that the cluster might be larger than the central concentration of O stars. Spectroscopic study indicates a mass loss rate for WR 93 of M⊙ yr-1 using a clumped wind model with terminal wind velocity km s-1 (Prinja et al., 1990; Nugis et al., 1998; van der Hucht, 2001). The nearby radio continuum and CO peaks suggest that WR 93 ionizes and heats the surrounding cloud (McBreen et al., 1983). The visual extinction towards WR 93 is high, with or mag (Nugis et al., 1998; van der Hucht, 2001).
Healy et al. (2004b) and Hester & Desch (2005) present an HST/WFPC2 image of the G353.2+0.9 H ii region in NGC 6357, illustrating a sequence of formation of low-mass stars and describing their evolution from molecular cores to EGGs to proplyds in the vicinity of massive stars. Very recently, De Marco et al. (2006) analyze HST observations of eight HII regions, including Pismis 24, to look for protoplanetary disks. In Pismis 24, they find a jet-like feature, similar to a Herbig-Haro object in their source # 14. However, no central star is seen in the jet candidate.
3 Observations and Data Reduction
3.1 Chandra Observation and Data Selection
NGC 6357 was observed on July 9, 2004 with the Imaging Array of the Advanced CCD Imaging Spectrometer (ACIS-I) on board Chandra. Detailed description of the instrument can be found in Weisskopf et al. (2002). Four front illuminated (FI) CCDs form the ACIS-I which covers a field-of-view (FOV) of . Two CCD chips on the ACIS Spectroscopic Array (ACIS-S) were also set to be functioning during the observation, although the mirror point spread function (PSF) degrades significantly far () off-axis. Here the ACIS-S data will not be quantitatively discussed. The observation was made in the standard Timed Exposure, Very Faint mode, with 3.2-second integration time and 5 pixel 5 pixel event islands. The total exposure time is 38 ks and the satellite roll angle is 289 degrees. The aim point is centered on the O3 If star Pis 24-1, the heart of OB association Pismis 24. The observation ID is 4477 (catalog ADS/Sa.CXO#obs/4477).
Appendix B of Townsley et al. (2003) and Getman et al. (2005a) provide detailed explanations of the Penn State ACIS data reduction procedure. Data reduction starts with filtering the Level 1 event list processed by the Chandra X-ray Center pipeline to recover an improved Level 2 event list. To improve absolute astrometry, X-ray positions of ACIS-I sources were obtained by running the wavdetect wavelet-based source detection algorithm (Freeman et al., 2002) within the Chandra Interactive Analysis of Observations (CIAO) package on the original Level 2 event list, using only the central of the field. The resulting X-ray sources were matched to the 2MASS point source catalog. We calculated the position offsets between 277 X-ray sources and their NIR counterparts, and applied an offset of in right ascension (RA) and in declination (Dec) to the X-ray coordinates. The CCD charge transfer inefficiency (CTI) was corrected using the Penn State CTI corrector (version 1.16) developed by Townsley et al. (2000, 2002).
3.2 Image Reconstruction and Source Finding
A multifaceted source finding procedure is summarized here, which is designed to locate all potential sources, even in the presence of crowding or a broad PSF, with the recognition that features due to detector noise may also enter the source list. First, we assemble a large number of candidate sources using a variety of techniques and criteria (wavdetect, reconstruction, visual selection, etc., as described below), which includes a number of possible false detections. These spurious sources are identified and removed after the photon extraction step (§3.3), where our customized tool evaluates the statistical significance of each detection above background, rejecting likely false detections when significances fail to meet a chosen threshold. These photons are then returned to the background and we re-evaluate the source significance for the surviving candidates, finally defining reliable detections and marginal detections for inclusion in tables of source properties. The details of this procedure are described below.
Source detection was carried out with the improved Level 2 event list that is band-limited to 0.5–7.0 keV with cosmic ray afterglows removed. Effective exposure maps and images for the full field, the I array, the central of the I array, and the inner of the field were made with 4-pixel, 2.6-pixel, 1-pixel, and half-pixel binning, respectively (an ACIS sky pixel is on a side). Figure 2a shows the raw ACIS I-array image at reduced resolution. Adaptive-kernel smoothed flux images were created with the CIAO tool csmooth (Ebeling et al., 2006) to help identify additional potential faint sources and any possible diffuse emission. The resulting full field two-color smoothed image and a zoom-in on the cluster core are shown in Figure 2; red and blue represent the soft band emission (0.5–2.0 keV) and hard band emission (2.0–7.0 keV), respectively.
The wavdetect program was run with source significance threshold on each of the four binned images described above, in three energy bands (0.5–2.0 keV, 2.0–7.0 keV, and 0.5–7.0 keV). This source significance threshold may give some false detections, but experience has shown us that this threshold is appropriate for crowded fields that might contain complex backgrounds due to diffuse emission. Merging the detections from the 12 runs resulted in a list of 614 potential point sources on ACIS-I. Careful visual inspection revealed that wavdetect still missed several apparent sources in the central region of the cluster. To take advantage of the sub-arcsecond PSF at positions around the aimpoint, we applied a subpixel positioning code (Mori et al., 2001) to improve spatial resolution in the inner part of the field and performed an image reconstruction with the Lucy-Richardson maximum likelihood algorithm (Lucy, 1974).
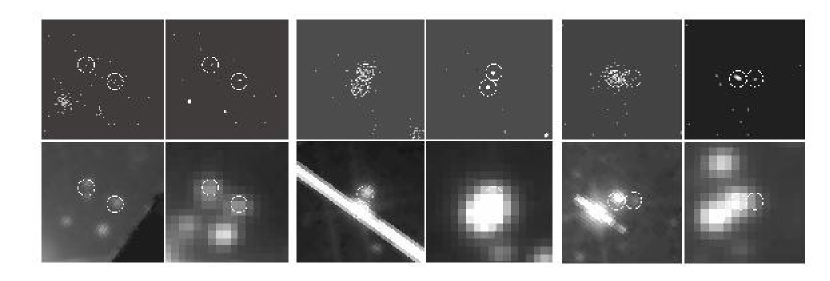
Our image reconstruction technique for crowded stellar clusters is described in detail in Townsley et al. (2006a) and a similar procedure is followed here. The maximum likelihood image reconstruction code 111From the IDL Astronomy User’s Library maintained by Wayne Landsman at http://idlastro.gsfc.nasa.gov/homepage.html. was run in the crowded central region using a image made with 0.2-pixel binning and centered on Pis 24-1, using the 1.0 keV PSF at that on-axis location from the PSF library in the CIAO calibration database. We chose the 200th iteration of the algorithm as the most appropriate image for source searching, as it showed good PSF removal without over-resolving the data. We adopted the find procedure in the DAOPHOT package (Stetson, 1987) to obtain the centroid, shape, and brightness parameters of the resolved peaks. Several combinations of flux (), roundness (), and sharpness () limits were tested to minimize the number of peaks from one photon, and the adopted parameters to reject spurious peaks were: or ; or ; or and . Using SAOImage DS9 (Joye & Mandel, 2003), world coordinate system (WCS) region files were made, centered on the unrejected peaks, based on 90 PSF contours. The final reconstructed source list was made with the aid of the I-array image overlaid with these regions where any remaining reconstructed peaks that contain only single photon events within 90 PSF contours were rejected. This image reconstruction procedure was performed separately using another image centered on Pis 24-17 because Chandra’s PSF varies at different locations and an appropriate local PSF must be used for the reconstruction. Examples of valid sources from image reconstruction are shown in Figure 3. The list of potential sources from the maximum likelihood reconstruction was merged with the wavdetect source catalog. By overlaying regions representing the potential sources onto the original and smoothed ACIS-I images, an additional 40 sources were added based on spatial concentrations of photons and proximity of 2MASS near-IR sources (). The source finding procedure described here results in a total of 910 potential sources identified on the ACIS-I array.
3.3 Photon Extraction and Limiting Sensitivity
A preliminary event extraction for the 910 potential X-ray sources was made with ACIS Extract (version 3.79; hereafter AE), a versatile script written in IDL that performs source extraction, fits X-ray spectra, creates light curves, and computes a wide variety of statistical properties of the sources (Broos et al., 2002)222http://www.astro.psu.edu/xray/docs/TARA/ae_users_guide.html. Using the AE-calculated probability that the extracted events are solely due to Poisson fluctuations in the local background, source validity can be statistically evaluated while taking account of the large distorted PSF at far off-axis locations and spatial variations in the background. The traditional source significance, defined as the photometric signal to noise ratio, is calculated for every source as well. We rejected sources with likelihood of being a background fluctuation. The trimmed source list includes 779 sources, with full-band (0.5–8.0 keV) net (background-subtracted) counts ranging from 1.7 to 1837 counts. We performed source extraction with this list using AE as described in detail by Townsley et al. (2006a).
The 779 valid sources are purposely divided into two lists: the 665 sources with make up our primary source list of highly reliable sources (Table 1), and the remaining 114 sources with likelihood of being spurious background fluctuations333A few values are greater than 0.01, our rejection threshold in the preliminary run. This is due to the feedback to the background from the rejected sources when we re-extract the trimmed source list. As described in detail in §2.1 of Townsley et al. (2006a), our catalog cutting scheme is iterative: the initial set of 910 potential sources is extracted and then cut at the threshold of 1%. The rejected sources are allowed to contribute to the background and the trimmed list of 779 valid sources is then re-extracted, resulting in different local background estimates and different source validity metrics . Thus, some values in Table 2 are %. are listed as tentative sources in Table 2. We believe that most of those tentative sources are likely real detections444The fraction of tentative sources (Table 2) that have optical and near-infrared counterparts is 50%, suggesting that they are not random spurious detections (§4.1). For the 64 weakest X-ray sources that have 3 counts or less, 10 of them have been cautioned with a ”U” flag (unreliable sources that have large probability of being background, §4.5) in the table, while 27 of them have optical and near-infrared identifications. Most of these faint sources are clustered within the central of the field and are likely low-mass cluster members..
We should note that the separation of reliable sources, tentative sources, and invalid sources is based on a single simple statistic, the Poisson probability of observing the extracted counts given the local background density. This permits scientists to evaluate the reliability of each source individually. A high cutoff (around 4 counts for a typical Chandra exposure on-axis) reduces spurious noise-based sources (false positives) but misses some real sources (false negatives). A low cutoff reduces the false negatives while increasing the false positives. In the absence of a consensus statistical procedure for the Poisson weak-signal-in-background problem, there is no way to clean the list in an objective fashion without losing real sources. Since different scientists make different decisions on the balance between false positives and false negatives, and there are good scientific reasons to believe many astronomically interesting faint sources lie in Chandra images of rich stellar clusters, we have opted to report marginal sources in Table 2. The reader is clearly warned that the reality of some of these weakest sources is suspect, and each source’s can be examined individually. These choices concerning how we choose to report faint sources do not affect our science results. The weakest X-ray sources are only used for X-ray luminosity function estimation (§5.1), contributing to the faintest two bins of the XLF, which do not impact on our conclusions regarding the NGC 6357 stellar population. We further note that every detection scheme must – explicitly or implicitly – estimate the local background, and every such estimate must implicitly identify the data that are guessed not to be background. For crowded young stellar clusters, this can never be accomplished in a unique, objective manner as it depends on the unknown distribution of true faint sources (including thousands of stars which lie below any detection threshold) and possibly diffuse emission from O star winds (Townsley et al., 2003).
Table 1 and Table 2 have a format that closely follows the tables in Getman et al. (2006) and are identical to Tables 1 and 2 in Townsley et al. (2006a). Column 1 gives the ACIS running sequence number, and column 2 provides the IAU designation. Columns 3–6 show RA and Dec in degrees, positional error in arcseconds, and off-axis angle in arcminutes. Column 7–11 give net counts in the full band, the associated -equivalent uncertainty based on Poisson statistics, background counts in the extraction region, net counts in the hard band, and the fraction of the PSF used for source extraction (reduced values for this quantity indicate source crowding). Columns 12 and 13 present two measures of the source validity: the photometric significance, and the probability that the source is a spurious background fluctuation , used for establishing source validity as described above. Column 14 lists possible anomalies in the observation and Column 15 checks the source variability. Table footnotes give details for Column 13–15. Column 16 gives the “effective” exposure time, defined as the amount of exposure time needed for the source to accumulate the current number of counts if placed at the Chandra aimpoint. Column 17 gives the source’s median energy in the full spectral band after background subtraction.
The on-axis limiting sensitivity of this 38 ks observation can be estimated using the Portable Interactive Multi-Mission Simulator (PIMMS 555http://heasarc.gsfc.nasa.gov/Tools/w3pimms.html). Assuming an on-axis detection of 3 counts (0.5–8.0 keV) in 38170 seconds and an absorbing column cm-2 (estimated from an average mag to Pismis 24 in Bohigas et al. 2004, adopting the conversion between and from Vuong et al., 2003), the observed X-ray flux for a thermal plasma with temperature of 1 keV (appropriate for a pre-MS star’s X-ray spectrum) is ergs s-1 cm-2. Correcting for absorption and a distance of 2.56 kpc to Pismis 24, this gives a limiting luminosity of erg s-1, where is the intrinsic (absorption-corrected) luminosity in the total Chandra band 0.5–8.0 keV.
3.4 Source Variability and Spectral Fitting
A band-limited, adaptively smoothed light curve for each source was generated by AE together with a median energy time-series. The variability of the source was evaluated by the significance of a one-sided Kolmogorov-Smirnov statistic , comparing the source events arrival times to that of a uniform light curve model. If , the null hypothesis of a constant source was accepted. If , the source was classified as “variable.” Otherwise, the source was “possibly variable.”
For the 40 sources with 80 net counts, the extracted spectra were fit to models of optically thin thermal plasmas using the XSPEC package (Arnaud, 1996), based on source spectra, background spectra, ancillary response functions (ARFs) and redistribution matrix functions (RMFs) constructed by the AE script. The data were grouped in bins with counts and the statistic was adopted to evaluate the goodness-of-fit. A single apec (Smith et al., 2001) thermal plasma model with a single absorption component was considered. Interactive fitting with alternative models (e.g., vapec thermal plasma with variable abundances; two-temperature apec thermal plasma model) was performed for a few strong sources that did not achieve a satisfying fit with the automated process. Table 3 gives the best fit results using the thermal plasma model; its format closely follows Table 3 in Townsley et al. (2006a). Uncertainties representing 90% confidence intervals are given; incomplete confidence levels imply the parameters are not well constrained, or XSPEC may have encountered some abnormality in the error calculations. For the 144 sources that have net counts between 20 and 80, we fit ungrouped spectra with a single temperature apec thermal plasma model using the likelihood ratio test ( statistic); the fitting results are presented in Table 4.
None of the NGC 6357 sources are bright enough to warrant correction for photon pile-up. The brightest source in the field is the W-R/O binary WR 93 which has 1837 ACIS counts in the 38 ks exposure, or a count rate of 0.15 counts per CCD frame. As it lies off-axis where the PSF is somewhat degraded, the photon pile-up effect will not be significant enough to distort the spectral fitting, according to previous simulation work (Townsley et al., 2002).
3.5 SIRIUS NIR Observation
To identify infrared counterparts with images that are deeper and of higher spatial resolution than 2MASS, , , and band images were obtained on 30 September 2005 using the wide-field NIR SIRIUS camera on the 1.4 m IRSF telescope at the South Africa Astronomical Observatory. Details of the instrument can be found in Nagayama et al. (2003). The pixel scale of the detector is 0.45 arcsec pixel-1 with a field-of-view. Three second exposures were made at each of 20 dither positions for a total exposure of 60 seconds. A typical limiting magnitude for such SIRIUS observations is =15.7. Unfortunately, the observing conditions were non-photometric and the seeing was 1.1″ FWHM in the band. We nonetheless found these images to be very valuable for identifying infrared counterparts (as described below) because of the higher spatial resolution compared to 2MASS.
4 Identification of the Chandra Sources
4.1 X-ray Sources with Stellar Counterparts
Identifying stellar counterparts for X-ray sources in massive star forming regions beyond 1 kpc is challenging. In regions such as the Chamaeleon I cloud ( kpc) or Cepheus B region ( kpc), the cluster members are sufficiently bright and well-separated that the 2MASS catalog provides adequate identifiers for nearly all Chandra stellar sources (Feigelson & Lawson, 2004; Getman et al., 2006). However, for NGC 6357 at kpc, deeper and higher resolution observations such as the SIRIUS images are needed for source identification. In massive star forming regions such as NGC 6357, optical and NIR imaging have the additional challenge of detecting faint stars amidst highly structured background emission from the H ii region or deeply embedded in the molecular cloud. Thus we cannot arrive at a quantitative statement regarding the completeness of the search for stellar counterparts of Chandra sources. But we can say that, with very few exceptions, e.g., infrared luminous active galactic nuclei (AGNs), the counterparts which we do identify are indeed cluster members.
For sources with off-axis angle , the Chandra sourcelist was matched to the 2MASS Catalog of Point Sources with a 1′′ matching radius. The search radius was enlarged to 2′′ for in consideration of the degraded off-axis Chandra PSF (Getman et al., 2005a). We find that 445 of our X-ray sources () have 2MASS counterparts. The matching results are presented in Table 5. Four of the ACIS sources (#88, 517, 688, 774) have two counterparts within and we assign the star with the smaller separation as the real counterpart. Three pairs of sources – 252 and 257, 401 and 407, 404 and 406 – share a single 2MASS counterpart within . Given the high density of both X-ray sources and 2MASS objects around cluster center, we follow the simple Monte Carlo technique from Alexander et al. (2003) to evaluate the number of chance superpositions between 2MASS sources and X-ray detections. A random offset between and is applied to the catalog to remove the true associations, and then the same cross-identification radii are used to match X-ray positions to 2MASS positions. This procedure is repeated many times and the resulting false detection rate is %.
For the 564 X-ray sources covered by SIRIUS imaging, we visually identified 476 infrared counterparts with separations from X-ray sources. Of these, 308 are known 2MASS counterparts that have been matched to ACIS sources. Therefore the combined matches from 2MASS and SIRIUS yield 613 NIR counterparts for the 779 X-ray point sources. Of the 166 X-ray sources without NIR counterparts, 89 lie in the SIRIUS FOV.
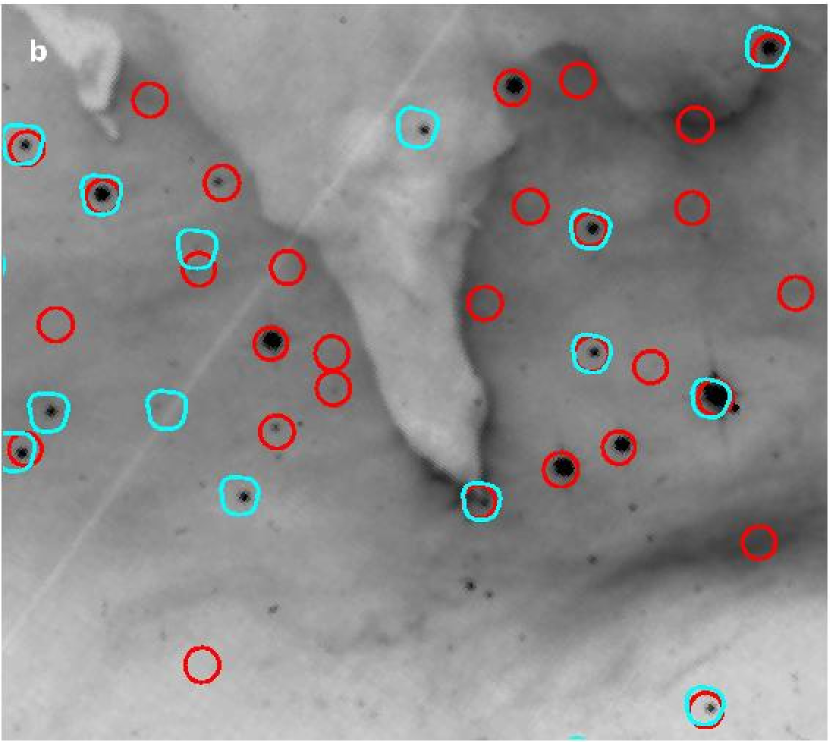
In spite of its small FOV, an archival HST WFPC2 (F814W) image of the H ii region G353.2+0.9 in NGC 6357 (Figure 4; Healy et al. 2004b) was visually examined for optical counterparts. By registering to a 2MASS image, an astrometric correction of and was applied to the HST image. There are 154 X-ray sources covered by the WFPC2 imaging, 99 of which have HST counterparts. The WFPC2 image demonstrates details of this interface between the hot tenuous H ii region and the cold structured molecular cloud. Some of the optically bright sources are not X-ray emitters and are probably foreground stars; a few stars appear very faint and are probably deeply embedded in the molecular cloud. All but three of the HST counterparts (corresponding to ACIS #359, 375, 390) have matched infrared counterparts. This increases the number of X-ray sources with ONIR counterparts to 616. Thanks to HST’s high resolution imaging, those ACIS sources are resolved from the crowded field where infrared images fail to detect them. Even though optical imaging suffers heavily from extinction, we speculate that more HST counterparts for the less-embedded ACIS sources with separations from other sources would have been recovered due to the high spatial resolution, if the HST spatial coverage of Pismis 24 were complete.
4.2 Extragalactic Contamination
We estimate the contamination from the extragalactic population following the method described in Getman et al. (2006). Monte-Carlo simulations of the expected extragalactic source contamination are constructed by placing fake AGNs randomly across the ACIS-I field superposed on the ACIS background. The X-ray flux distribution follows the log–log distribution from Moretti et al. (2003) and the corresponding power law photon index for individual sources follows the flux dependence found by Brandt et al. (2001). Synthetic source spectra were generated with the XSPEC function and convolved with an absorption column . We ran simulations with three typical : the total Galactic absorption towards NGC 6357 ( cm-2, Dickey & Lockman, 1990); Galactic absorption plus an additional cm-2 typical of Pismis 24 OB stars; and Galactic absorption plus an additional cm-2 typical of reddened 2MASS stars. Then we identified the closest real X-ray detection to the fake source. Source significance for each fake AGN was then calculated using the local background of the nearby real source in the NGC 6357 background map. We set a detection threshold of , where is the quantity given in column 12 of Table 1. This limiting source significance is the median of those hard X-ray sources without infrared counterparts and lying far off-axis, which are the most likely candidates for AGNs in the field.
The number of detectable AGNs from typical simulations with the three absorption column densities ranges from 14 to 29. The level of AGN contamination for the NGC 6357 region (Galactic coordinates , ) is similar to the contamination calculated for the Cepheus B (, ) observation which had a similar Chandra exposure (Getman et al., 2006). The true extragalactic contamination may be lower due to localized regions of very high absorption by the molecular cloud behind the OB association. We conclude that no more than 4%, and more likely %, of the 779 X-ray sources are extragalactic contaminants. Among possible AGN candidates, the brightest in X-rays is source #1. Based on its flat X-ray spectrum, large separation from the central cluster, non-variable lightcurve, and lack of optical or near-IR counterpart, ACIS #1 is considered to be a likely AGN. Using a power law model with a single absorption component, its spectrum can be adequately fit using a power law photon index and an absorption column cm-2.
4.3 Field Star Contamination
To estimate possible contamination from foreground field stars, we follow the techniques described in the Chandra Orion Ultradeep Project (COUP) membership study and the Chandra study of the Cep B star forming region (Getman et al., 2005b, 2006). We use simulations based on the stellar population synthesis model of Galactic disk stars by the Besançon group (Robin et al., 2003). The models are calculated using their on-line service666http://bison.obs-besancon.fr/modele/. Synthetic catalogues of stars generated from these models predict field stars with mag in a solid angle of deg2 (ACIS-I FOV) to the distance of NGC 6357. About 10% are F-type main sequence (MS) stars, are G-type MS stars, are K-type MS stars, are M-type dwarfs; the rest are giants with a few subdwarfs.
We then adopt the X-ray luminosity functions (XLFs) for MS K-M stars (Schmitt et al., 1995), F-G stars (Schmitt, 1997), and late type giants (Huensch et al., 1996) derived from a complete volume-limited sample in the solar neighborhood. The conversion of intrinsic X-ray flux in the ROSAT PSPC keV band to Chandra ACIS-I keV count rate is from PIMMS, using a thermal plasma model assuming keV from Güdel et al. (1998), where is the stellar distance and is the X-ray flux in ROSAT PSPC keV band. Only Galactic absorption is assumed to be present for stars in the foreground of the NGC 6357 cloud and the amount of absorption to the fake star is calculated based on its distance when the simulated catalog is generated.
Following the same procedures used in the simulations for extragalactic contamination, a simulated field of X-ray field stars was added to the ACIS background map, and the star locations were examined for source significance. For detection thresholds ranging from to , 10000 simulation runs give a typical number of 6 to 16 detectable foreground field stars. These sources should be readily distinguished from extragalactic AGN and most young cluster members by the brightness of their stellar counterparts and (when sufficient X-ray counts are present to measure median energies) low absorption in their spectra. Eleven individual stars are identified as likely foregound stars in the field (§4.5). Those contaminants will be removed from further consideration of the young cluster population. The likelihood of background star contamination is small because of the heavy absorption of the molecular cloud and the large distance.
The contamination from Galactic disk stars is thus % of the observed source population, about half that of the extragalactic contamination. A complete removal of all non-members is impossible without further information, thus we ignore the remaining foreground star and AGN contamination in our further analysis given that the fraction is statistically very small.
4.4 Likely New Stellar Members
For the 163 ACIS sources without ONIR counterparts, at most 20–30 of them are possible extragalactic contaminants (§4.2). The rest of the 140 sources are probably new members of Pismis 24, in addition to the 605 likely members (excluding the 11 candidate foreground stars) with ONIR counterparts identified from the thousands of ONIR stars in the field (§4.1).
Sixty-two ACIS sources without ONIR counterparts are clustered within of the O3 star Pis 24-1. The rest are widely distributed throughout the field, although a few are located to the northwest of the ionization front where there is much less optical nebulosity. Five of them are clustered around the WR star. Most of these likely members are faint X-ray sources; only two of them have more than 10 net counts. More than 100 of them have median photon energy keV and have keV, implying heavy obscuration (see Figure 8 from Feigelson et al. 2005). We speculate that, due to the face-on geometric configuration, these represent the more distant cluster members that are located behind those optically visible members, deeply immersed in the molecular cloud. Some may be very young, embedded in molecular cores or protostellar envelopes that have not yet been identified. But many are likely to be older Class II and III pre-MS stars that have counterparts in Spitzer Space Telescope surveys. The properties and spatial distribution of these likely new members will be further discussed in §5.2 and §6.5, after we classify the X-ray sources.
4.5 Classification of the X-ray Sample
From the results of the previous sections, we can establish a rough classification of the X-ray sources. These class designations appear in Table 5. The numbers in parentheses after the class names are the number of sources in each category.
- R (600)–
-
Reliable X-ray sources with ONIR stellar identifications. They represent the more massive and less obscured members of the stellar population.
- C (590)–
-
X-ray sources with off-axis angle . They are likely members of the central cluster.
- H (109)–
-
Hard X-ray sources with keV. Most of these are heavily obscured members of the embedded stellar population. About 20-30 of these are probably extragalactic AGNs.
- U (18)–
-
Unreliable X-ray detections. We consider the 18 X-ray sources in Table 2 with large probability of being background () to be possible spurious detections.
- F (11)–
-
Foreground field stars. Seven soft X-ray sources ( keV, corresponding to cm-2) with more than 20 net counts in 0.5–8.0 keV (to have reliable median photon energy measurements) are identified as foreground sources, excluding any known O stars. One X-ray emitting A8 subgiant, HD 157528, was recovered using this criterion. The limitation for this criterion is that unidentified massive stars with soft X-ray emission may be included. Two of these candidate foreground stars, ACIS #9, #539, are included as candiate O stars (see §6.2). In addition, we select 4 soft X-ray sources ( keV) as likely field stars since their colors are consistent with the locus of Besançon simulated field stars. All these sources have visual photometry in the UCAC2 catalogue (Zacharias et al., 2004), which provides additional support for them being classified as likely foreground stars.
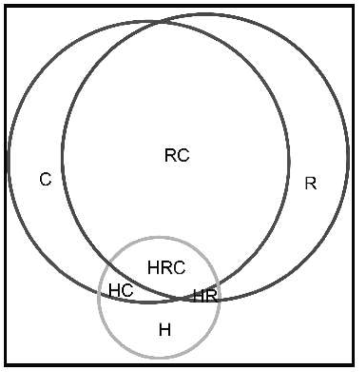
The classes , , and are not exclusive and many sources fall in two or three categories as illustrated in Figure 5. Thirty-eight sources are not classified because they are either too faint or poorly characterized.
Moffat & Vogt (1973) listed 15 bright stars in Pismis 24 as their photometry targets and concluded 12 of them are members. Spectroscopic observation confirmed that seven of these, and four additional stars, are massive OB stars (Massey et al., 2001). Our X-ray sample with infrared counterparts increases the known cluster population 50-fold, from to , providing the first opportunity to investigate the full stellar population of the region.
The vs. color-color diagram of 142 Chandra sources with high-quality 2MASS photometry 777The 2MASS sources plotted here and in the vs. diagram have signal-to-noise ratios greater than 6 (photometric quality higher than “”) and are free of confusion flags and warning of contamination flags. See Explanatory Supplement to the 2MASS All Sky Data Release (Cutri et al. 2003; http://www.ipac.caltech.edu/2mass/releases/allsky/doc/) for details. is shown in Figure 6. The typical uncertainty in color is mag. The locus for main-sequence stars of different spectral types from early O to late M (Bessell & Brett, 1988) is plotted as the thick line. Stars that are reddened by normal interstellar extinction occupy the color space between the two reddening vectors of an O dwarf and an M giant (dashed lines). The foreground A8 subgiant (# 773) clearly reveals itself, lying on the locus with almost no reddening. The stars to the right of the reddening band are -band excess sources. It is clearly seen that the X-ray observation selects far more Class III infrared sources (stars that have simple blackbody spectral-energy distributions, with little or no inner accretion disks) than Class II sources (stars with -band excess circumstellar disks; Lada, 1987; Wolk & Walter, 1996).
The 2MASS vs. color-magnitude diagram (Figure 7) gives both the rough mass distribution and the absorption distribution of the ACIS sources with 2MASS counterparts. Zero age main sequence (ZAMS) track (Cox, 2000) and two pre-MS isochrones (Baraffe et al., 1998; Siess et al., 2000) are shown with spectral types, stellar masses, and reddening vectors for estimation of the dereddened masses and the associated absorption. We assume 1 Myr for the age of Pis 24 cluster and a distance of kpc when estimating stellar properties from the color magnitude diagram. We remind the reader that the estimated mass and the amount of absorption for a given star also relies on the assumption of distance and cluster age besides the uncertainties in the star’s color and magnitude. For example, if we adopt a younger cluster age (0.3 Myr), the pre-MS isochrone will shift upwards and yield a lower dereddened mass and less amount of absorption as shown in Figure 7. Note that the inferred properties for stars with spectral type later than B3 are less dependent on the age and distance assumptions. In addition we show the vs. color-magnitude diagram for the same sample of stars accounting for some small -band excess. Known Pis 24 optical members detected in X-ray are located along the reddening vectors from the locus of O stars with a typical mag. Not surprisingly, the foreground star #773 resembles a very massive and luminous object at the distance of NGC 6357. Besides the foreground star, WR 93 is the most luminous object.
Most of the other ACIS sources occupy infrared color domains that are consistent with being high-mass stars and pre-MS intermediate-mass stars () with at 2.5 kpc. The highly-reddened bright 2MASS sources are possibly obscured massive stars. The new high-mass stars double the known high-mass population of the cluster (§6.2). The intermediate-mass stars, mostly Class III objects, are newly identified members of the cluster (§6.3). The ratio between Class III and Class II objects for the high-mass and intermediate-mass cluster members is based on the 140 stars with mass . Although the uncertainties of the estimated stellar masses are not negligible (as much as a factor of 2; see the discussion of Orion stars in Preibisch et al., 2005; Luhman, 1999; Hillenbrand & White, 2004), this is a quantitative measurement for the massive end of the cluster members and implies that the fraction of stars possessing inner disks among the intermediate-mass and high-mass stars is low even in such a young stellar cluster. Those intermediate-mass stars with significant IR excess are likely the accreting pre-MS stars known as Herbig Ae/Be stars (HAeBes; Herbig, 1960; The et al., 1994). X-ray properties of the intermediate mass stars with infrared excess will be examined in § 6. A handful of objects are heavily obscured with . Due to their brightness in K-band (), these objects, some of which exhibit K-band excess, are easily accessible for ground based follow-up infrared spectroscopic or photometric study. The remaining ACIS members without 2MASS counterparts but seen with SIRIUS and/or HST are likely lower mass stars. The close separations to the high/intermediate mass stars suggest they perhaps are companions, but this could well be a spatial projection effect in such a crowded cluster. Similar to those unobscured ACIS sources without ONIR counterparts, they are either too faint or too close to bright stars to be cataloged in 2MASS.
4.6 EGGs and Protostars
Two-thirds of the IR counterparts – those with low photometric quality – do not appear in Figure 6. Although candidate protostars may be present, the large uncertainty in their IR color and the upper limits in -band do not allow us to confidently classify class II/I objects. Precise infrared photometry will be the key to establishing whether they are true embedded protostellar objects.
When compared to an archival HST WFPC2 image (Figure 4; Healy et al. 2004b), the X-ray source #461 (CXOU J172445.74-341106.9) is spatially coincident with the tip of an evaporating clump extending from the wall of the molecular cloud, which is known as an evaporating gaseous globule (EGG; Hester et al., 1996; Hester & Desch, 2005). It has only 4.6 net counts but the X-ray photons are spatially concentrated; it is a reliable Table 1 source. The X-ray emission appears to be moderately absorbed with keV. The colors of its infrared counterpart show large NIR excess (, ). The 2MASS counterpart was previously detected in the Persi et al. (1986) infrared observation (=IRS 4) and its spectral energy distribution (SED) gives a 1–20 luminosity of 630 (Persi et al., 1986). This luminosity and its infrared colors are consistent with that of a protostar with spectral type B0–B2 (Persi et al., 1986; Bohigas et al., 2004). In addition, it also coincides with the compact radio peak of a 6 cm VLA observation (=VLA A; Felli et al., 1990).
CXOU J172445.74-341106.9 may be the first detection of X-ray emission from an EGG, which represents one important evolutionary stage of star formation. Linsky et al. (2003) identified deeply embedded hard X-ray sources in the “pillars of creation” of the Eagle Nebula (M 16; Hester et al., 1996) but were unable to find any such sources associated with the EGGs. The non-detection of X-ray emission in M 16 EGGs may be related to their high threshold of detection (6 counts), heavy extinction, or the spectral type and evolutionary phases of the embedded stars. Although the uncertainty in the X-ray luminosity is potentially very large for such a faint source, the estimated ergs s-1 from PIMMS is somewhat consistent with other X-ray detected high-mass protostars (NGC 2024 IRS 2b, O8–B2, Skinner et al. [2003]; S106 IRS4, O7–B0, Giardino et al. [2004]). It is likely that the actual X-ray source is the embedded protostar instead of the gaseous globule.
No X-ray detection is associated with the HST jet candidate, Pismis 24 # 14 in De Marco et al. (2006). We examined the X-ray image at the HST position and no photons can be found within a 90% PSF contour.
5 Properties of the Stellar Cluster and Its Environment
5.1 X-ray Luminosity Function
We construct the observed hard band (2–8 keV) XLF for all X-ray sources, excluding sources classified as and . Based on the fact that the extragalactic contamination is small, we only exclude ACIS # 1 that is very likely an AGN. We do not attempt to study the observed total band (0.5–8.0 keV) XLF or absorption corrected total band luminosities (; 0.5–8.0 keV), since we do not have reliable measurements of for faint sources. In the case of heavily absorbed X-ray sources, the unknown soft component can introduce a large uncertainty in the observed total band X-ray luminosity.
For sources with more than 20 net counts, the hard band (2.0–8.0 keV) flux and absorption-corrected hard band flux (and therefore the luminosities and ) are available from XSPEC spectral fitting. For fainter sources, we define the following procedure to estimate and also consistently. First, if the faint X-ray source has a 2MASS counterpart with reliable photometry, we use the derived from the color magnitude diagram to obtain the , assuming a 1 Myr age for the cluster members cm-2 mag-1 (Vuong et al., 2003). We note that adopting a younger age or a smaller distance will shift the pre-MS isochrone upwards in the color magnitude diagram, causing generally lower values for the derived . However for these faint sources that are likely low-mass cluster members, the decrease in is very small, mag (Figure 7). Otherwise, as shown in Feigelson et al. (2005), empirical conversion from median photon energy provides us with an effective approximate value for sources with only a few counts: cm-2 for relatively soft sources ( keV); cm-2 for harder ones ( keV). We estimate that the uncertainties in are and can be as large as for soft sources that have keV. We assign plasma temperature based on to reflect the observed trend of increasing temperature with increasing median energy: typically keV for keV, keV for keV, keV for keV, and keV for keV (see Figure 8 in Feigelson et al., 2005). With the and parameters set and ACIS-I count rates known for each source, we run PIMMS simulations to derive the observed (absorbed) and absorption corrected flux in the hard band.
The XLFs for the lightly obscured ( keV) and heavily obscured ( keV) stellar populations in NGC 6357 are plotted in Figure 9. For comparison, XLFs derived for the lightly obscured COUP Orion Nebula population (Feigelson et al., 2005) and for the Cep B unobscured and obscured populations (Getman et al., 2006) are also shown. The shapes of the high luminosity portions of the lightly obscured and obscured COUP XLFs (see Figure 3 in Feigelson et al. 2005) are very similar, but the weaker sources in the obscured COUP sample are missing. Therefore we adopt the lightly obscured COUP XLF as the template in this population calibration exercise. At the high end, the NGC 6357 XLF is clearly consistent with the power law relation as seen in COUP and Cep B, allowing us to scale to the COUP XLF and make the first reliable estimate of Pismis 24’s total cluster population.
At ergs s-1, the NGC 6357 XLF begins to flatten and decline dramatically. We examine the completeness in the source detection to determine whether the decline is due to a real deficiency of cluster members in this luminosity range or is simply an expected effect when reaching the faint source detection limit. If the observed X-ray flux from a cluster member with such a luminosity is well above our sensitivity limit, the deficiency of stars in this luminosity range would imply a different X-ray luminosity distribution for the population. Given that sources with 10 net counts in the full-band at any off-axis angle are confidently detected, we adopt two different methods to estimate what is the corresponding flux limit to 10 net counts. First, assuming a 2 keV thermal plasma, PIMMS simulation gives ergs s-1 cm-2 for a count rate of counts ks-1. Independently, using all sources with more than 20 net counts that have flux estimates from spectral fitting, we derive an empirical conversion factor between flux and net counts for this observation, and the 10 net counts also converts to ergs s-1 cm-2. Therefore the two approaches give the same , which converts to ergs s-1. The decline in the NGC 6357 XLF below ergs s-1 is thus consistent with incomplete detection of the less luminous cluster members. We do not have sufficient sensitivity to search for a difference in XLF shape compared to COUP below ergs s-1, as seen in Cep B by Getman et al. (2006).
The scaling factor to match the COUP XLF to the NGC 6357 XLF is at higher values of for the lightly obscured population. Using the XLF constructed with gives the same scaling factor. The XLF from for the obscured stellar population in NGC 6357 is comparable to the COUP XLF, while the absorption corrected XLF seems to be consistently times higher than the COUP XLF for the high luminosity bins. Altogether, this implies that the X-ray emitting stellar population in NGC 6357 is roughly times888If the true distance to the cluster is a smaller value, e.g. 1.7 kpc, all the derived luminosities, including and , will be systematically lower by 0.35 dex and the estimated population will be 3 times the Orion Nebular Cluster. richer than the lightly obscured Orion Nebula Cluster (839 unobscured cool stars; Feigelson et al., 2005). Therefore the X-ray emitting population in Pismis 24 is . Given that the ONC has known members from the deep optical study by Hillenbrand (1997) and COUP detects more than half of the stellar population in X-rays, the total stellar population in Pismis 24 is estimated to be two times larger than the population detected in X-rays, members. It is not unexpected, assuming the standard IMF, to find massive stars with in a cluster with such a large population. A note of caution here is that, even in such a young star-forming region, the stellar population in consideration is not perfectly coeval. It perhaps includes a younger population triggered to form by the ionizing front from the massive stars, but the small population of the second generation stars has little impact on the IMF of this rich cluster.
5.2 Spatial Distribution of the Stellar Cluster
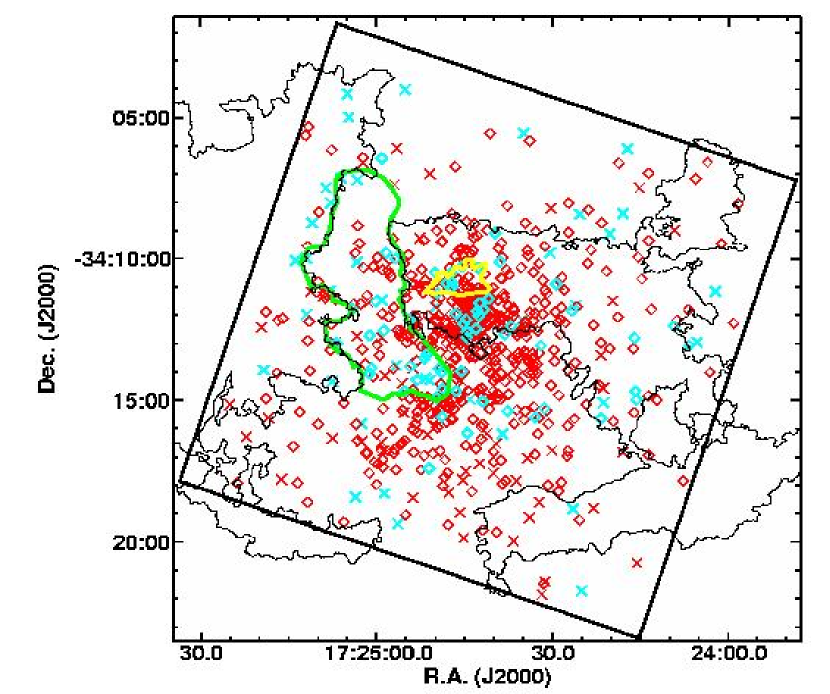
Aside from several dozen known and new OB stars (see §6), the locations of over 700 new lower-mass cluster members are now determined with sub-arcsec precision. Figure 10 shows the spatial distribution of the cluster members. The large scale optical nebulosity contour from the DSS R-band image, which also traces the mid-IR ring-like morphology, is shown together with the outlines of the ionization front in yellow and the CO “South-Eastern Complex” in green (S.E.C. in the CO emission map in Massi et al., 1997). The geometry of the cluster appears spherically symmetric: the source density in the cluster core near the ACIS-I aimpoint is the highest, and declines radially with no apparent discontinuity. There seem to be fewer X-ray detections northwards of the optical nebula, although there is neither an enhancement nor a deficit of stars at the bright photodissociation region (PDR). Although the reduced sensitivity at the chip gaps between the ACIS-I CCDs is not taken into account, we doubt that the number of missing sources in the chip gaps is large enough to alter the spatial distribution of the stellar cluster.
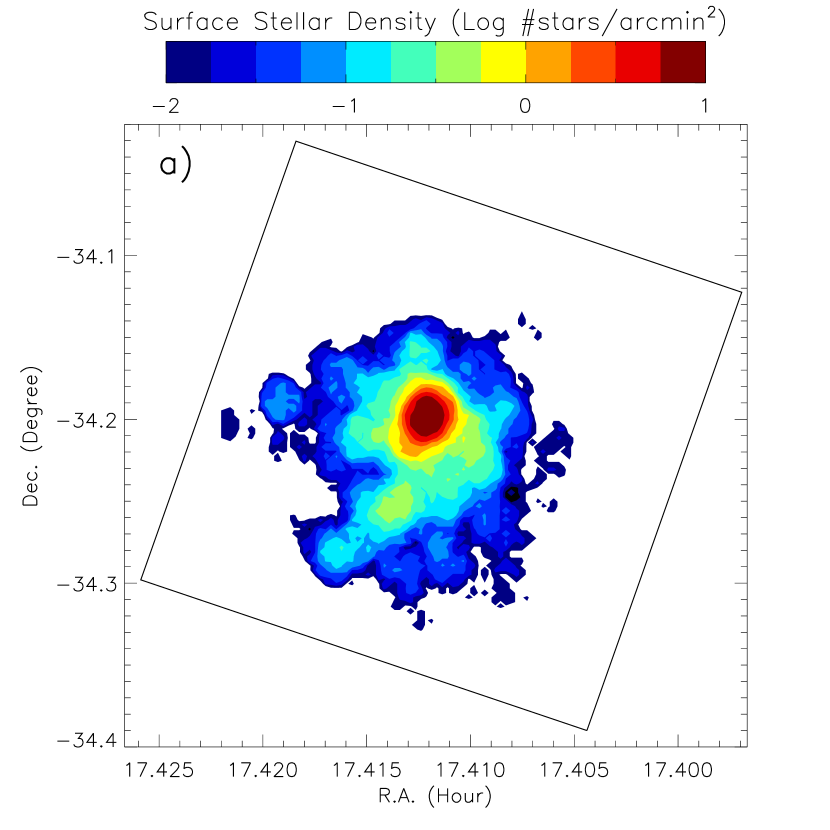
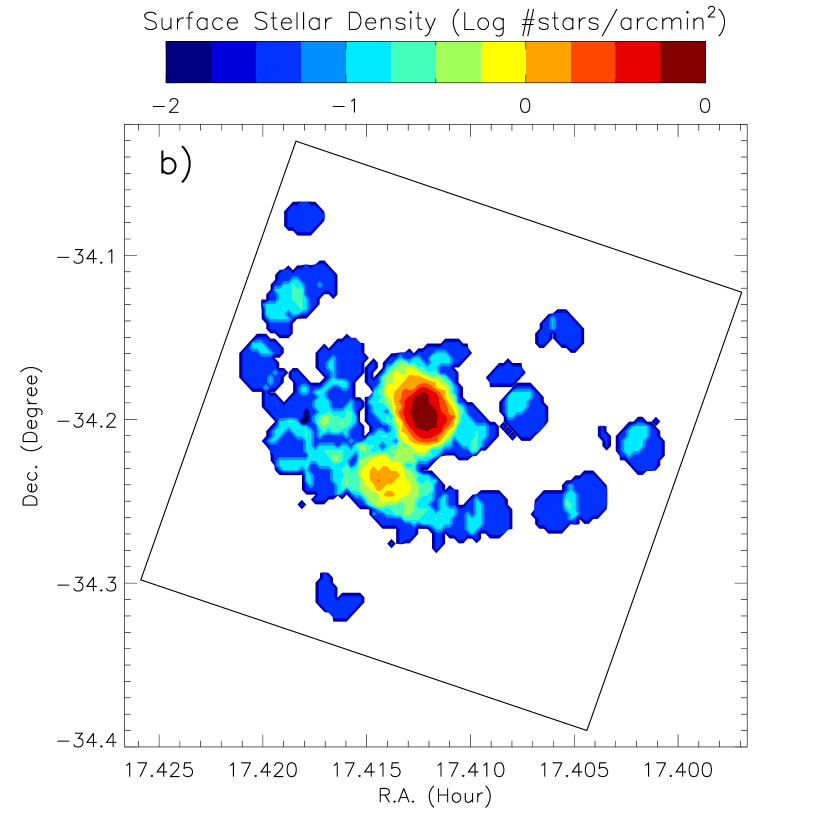
Projected stellar surface density (number of stars arcmin-2) contour maps for the unobscured and obscured populations are shown in Figure 11, in logarithmic scale. The stellar density is smoothed using a radius kernel. As expected, the highest concentration of stars is at the core of the cluster, where the massive O stars are located. The distribution of stars is rather spherically symmetric centered at the O3 stars, except for a density enhancement centered at the tip of the S.E.C. (centered at RA=17:24:48.3, Dec=-34:15:05). Figure 12 further elucidates the structure of the stellar distribution by showing the radial profile of the stellar surface density. The stellar distribution appears to consist of two components: a compact cluster within the central 1.5 pc with a log-normal distribution, and a cluster halo extending to 8 pc with an approximately exponential distribution. The number of X-ray stars in the central region is 333 while the extended region contains 446 stars. Because these stars are poorly studied, we can only speculate that the stars in the central region represent the coeval dense cluster core of Pismis 24, while the apparent extended wing is a mixture of evaporating cluster members and newly formed stars distributed throughout the molecular cloud enveloping the cluster.
Figure 12 also compares the radial profile to the profile of the Orion Nebula Cluster within 1.5 pc for Chandra stars (Getman et al., 2005a; Feigelson et al., 2005). The ONC is only extensively studied within a projected radius of 2.5 pc from Ori C (see Hillenbrand & Hartmann 1998 for a review of ONC structure and dynamics). It is strongly concentrated, with a central density times that of the widespread cloud stellar population distributed at radii pc. The ONC could possess an extended halo of stars as we see in the more massive Pismis 24 cluster but it would be confused with the surrounding stellar population. Thus we limit the comparison of the two X-ray selected clusters to radii 1.5 pc.
The stellar density of the ONC core appears to be 5 times higher than the X-ray population in the Pismis 24 cluster core, but this can be largely attributed to the differencein the number of faint stars detected: the ONC sample from the 800 ksec COUP observation extends into the brown dwarf regime, while the Pismis 24 sample becomes incomplete around (§5.1). Extrapolating to brown dwarf masses using the COUP mass distribution (Getman et al. 2005a), we estimate that the NGC 6357 cluster central density would be 20 times higher than the currently observed one if it were as sensitive as the COUP observation. We thus conclude that the NGC 6357 cluster central density is probably 4 times higher than the ONC central density and similar to the central density of the NGC 3603 super star cluster (see footnote 1 in Hillenbrand & Hartmann 1998).
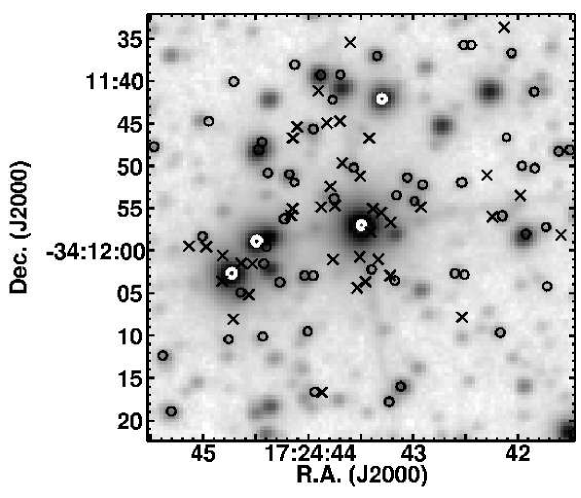
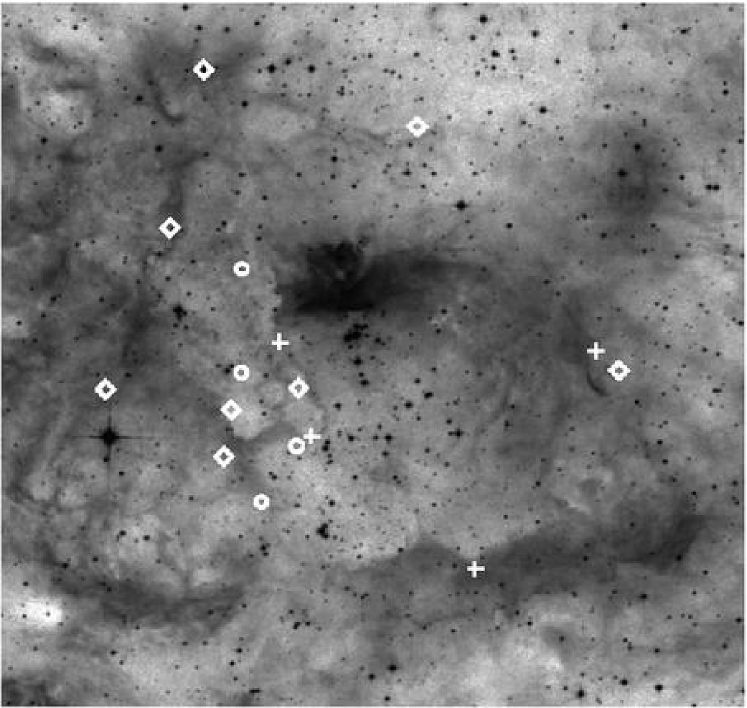
Figure 13 zooms in to the core region of the cluster using the SIRIUS K image as background. The ONIR identified X-ray sources (circles) and unidentified X-ray sources (crosses) are shown with the known massive members highlighted in white. Only a few of the unidentified sources appear isolated, without infrared sources nearby. Most are clustered in the neighborhood of the two O3 stars; 24 are located from near-IR sources, therefore the available NIR images may not be able to resolve them. These unidentified sources very likely are real low-mass members concentrated around the massive stars.
5.3 The Morphology of the Ring-like Nebula
A puzzling feature arises when we compare the core of the massive cluster centered on the two O3 stars to the large ring-like nebula with a large cavity that makes up the wider view of NGC 6357 (Figure 1): the cluster is significantly off-center to the north. The “diamond ring” morphology of NGC 6357 is apparent in the H and mid-IR images, with the bright point along the edge brightened torus. In contrast, the Rosette Nebula has a similar annular nebula morphology, but the massive OB stars in NGC 2244 exciting the nebula are located right in the center. The hollow HII morphology is attributed to strong OB stellar winds excavating molecular materials and the depletion of gas by newly formed stars (Dorland et al., 1986; McCullough, 2000; Townsley et al., 2003). Therefore the nebular shape is generally accepted as spherical or cylindrical. In NGC 6357, the most massive members are so close to the northern edge of the nebula that it seems implausible that the cavity is created by the strong winds of the current generation of hot stars. In general, supernovae explosions and strong stellar winds can shape the natal cloud by creating wind-blown “bubbles”–cavities. However, there is no evidence for a recent supernova: neither diffuse X-ray emission from a hot tenuous plasma nor non-thermal radio emission is detected in this region. We further note that the presence of WR 93, an evolved star, is circumstantial evidence that some population of massive stars in NGC 6357 is old enough to produce supernovae.
It is possible that a previous-generation of hot stars created the large cavity and formation of the current ionizing population was triggered at the densest edge of the excavated cavity. Combined with different viewing angles, this can result in diverse morphologies such as an egg, or a diamond ring, rather than a symmetrical annulus. H images of quite a number of regions where the stars are displaced with respect to the center of an evacuated cavity have been shown in the Large Magellanic Cloud (Gaustad et al., 1999) and modeled as modified Strömgren spheres (McCullough, 2000). The key for testing this hypothesis is to identify the older cluster. X-ray sampling provides a critical test as X-ray luminosities decay only slightly over Myr (Preibisch & Feigelson, 2005). The subcluster seen in the surface density map southeast of the Pis 24 cluster could be the remnant core of the previous generation of stars. ONIR photometric and spectroscopy study of the 30 stars in this subcluster, permitting their placement on the HR diagram, might reveal whether they are older than the main cluster concentrated off the center of the nebula.
An alternative scenario is that the cavity is indeed created by the massive Pis 24 stars that are emitting ionizing photons. In that case, the displacement from the center could be explained with spatial projection and an inhomogeneous molecular cloud, as first proposed by Bohigas et al. (2004). The O stars were close to the geometrical center of the Pismis 24 cluster and created an expanding HII bubble, which may have encountered a much denser interstellar medium in the northern part than in other directions. The apparent deficit of X-ray sources to the north may be evidence for the absence of star formation in the densest region, where a new generation of stars may emerge eventually.
6 X-rays across the Mass Spectrum
6.1 X-rays from known massive stars
OB stars have been known to be X-ray sources since early observations from the satellite (Harnden et al., 1979; Seward et al., 1979). Models were developed where instabilities in radiatively-driven stellar winds from massive stars produce shocks and heat the gas to X-ray emitting temperatures (Lucy & White, 1980; Owocki et al., 1988; Owocki & Cohen, 1999). However, recent studies indicate that more complex models are needed to account for unexpected X-ray emission line profiles and hard, variable continuum emission (e.g., Waldron et al., 2004; Stelzer et al., 2005).
We detect X-ray emission from all known early type stars ranging from O3 to B0.5 in this 38 ks ACIS observation. Table 6 summarizes ACIS detections and non-detections of X-ray emission from O and early B stars in the Pismis 24 cluster that are classified in literature.
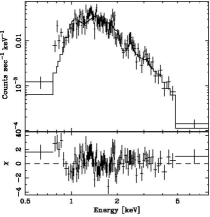
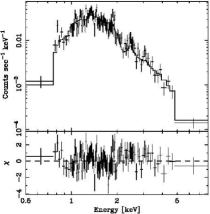
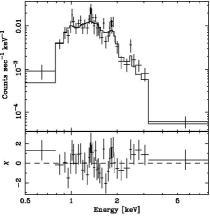
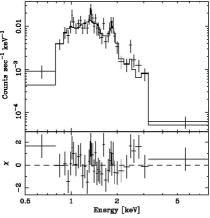
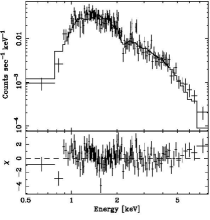
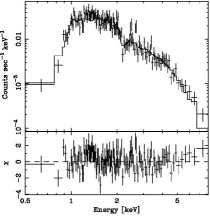
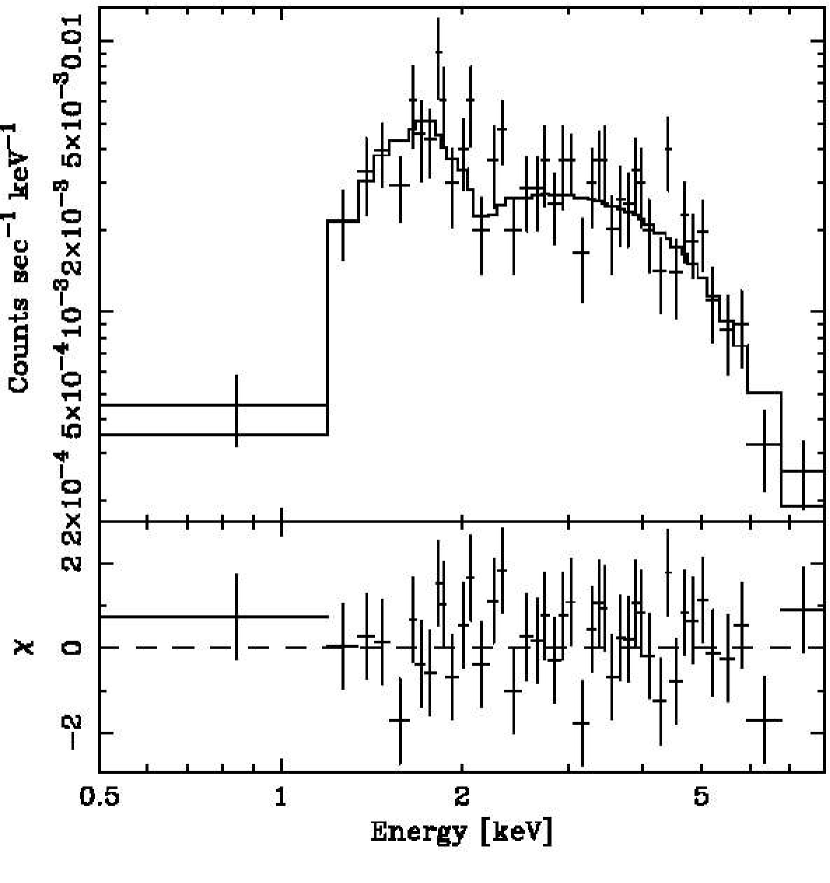
Two of the newly classified O3 stars Pis 24-1 (O3.5If) and Pis 24-17 (O3.5IIIf; Walborn et al., 2002) exhibit X-ray luminosities ergs s-1. This is consistent with HD 93128 in the Carina Nebula cluster Tr 14, which has similar spectral type (Evans et al., 2003). Their lightcurves remain constant through the observation, which is typical for O stars, although variability in X-ray emission from O stars like Ori is well known (Berghoefer & Schmitt, 1994). Figure 14 presents their X-ray spectra and spectral fits (assumed abundances of 0.3 unless otherwise noted). Compared to the best fit using a single temperature plasma model, the X-ray spectrum of Pis 24-1 (#344) is better fit by a two temperature plasma model (cm-2, keV, and keV). Pis 24-17 (#420) can be adequately fitted by a single soft component with cm-2 and keV. The fit is improved by adopting enhanced Mg (), Si (), and Ar abundances (). The Si xiii line at 1.86 keV in Pis 24-17 is exceptionally strong, comparable to the same line seen in the O star IRS 2 in RCW 38 (Wolk et al., 2002). The derived temperatures for soft and hard components for these O stars are similar to the X-ray temperatures of other single massive stars: some O stars exhibit a simple single temperature plasma keV (e.g., MacFarlane et al., 1993; Rho et al., 2004; Townsley et al., 2006a), while a few require an additional high energy component (e.g., Corcoran et al., 1994; Kitamoto & Mukai, 1996; Evans et al., 2004; Stelzer et al., 2005). Gagné et al. (2005) shows that the magnetically channeled wind shock model (Babel & Montmerle, 1997a, b) with strong line-driven winds in a single O star can adequately reproduce both the soft and the hard compents in the recent phase-resolved Chandra grating spectra of Ori C (O5.5V). In some cases, the high energy component may in fact be an indication of binarity, as powerful winds in two massive components shock to produce hard X-rays (e.g., Portegies Zwart et al., 2002; Albacete Colombo et al., 2003; Townsley et al., 2006b).
The brightest X-ray point source in the ACIS field of view is the WC7+O7-9 binary WR 93 (#747) with a ergs s-1, roughly consistent with the earlier ROSAT PSPC value ergs s-1 (0.2–2.4 keV; Pollock et al., 1995). It is one of the spectroscopic WR binaries that are bright enough to be detected by previous generation X-ray telescopes; single WC stars are much fainter (Oskinova et al., 2003). Thus the strong X-ray emission from binary WR stars is likely generated in the region where the massive stellar winds collide. However, while archetype colliding-wind binaries such as WR 140 (WC7+O4V) display characteristic non-thermal emission in the radio band (Dougherty et al., 2005), WR 93 shows thermal radio emission (Abbott et al., 1986). Also the X-ray lightcurve appears to be constant through the entire observation; no orbital X-ray variability is seen 999No orbital period for WR 93 is reported in literature.. The X-ray spectral fit for WR 93 is shown in Figure 14 with an absorption column cm-2 and a rather hard keV. The large absorption column densities towards the two O3 stars and the WR star derived from X-ray spectral fits match well with their large visual extinction () and the reddening from colors.
Five of the bright Pismis 24 stars in Moffat & Vogt (1973) – Pismis 24-4, 7, 8, 9, 11 – were not included in the spectral classification observation of Massey et al. (2001). Based on their strong X-ray emission (except for Pis 24-9 which is undetected), absorption column derived from X-ray spectral fitting, brightness, and colors, we suggest that they are also young OB stars and cluster members (see Table 7).
X-ray emission from OB stars was reported from ROSAT observations to display a characteristic efficiency (Chlebowski et al., 1989; Berghoefer et al., 1997), and this empirical ratio has been examined in recent X-ray observations of massive stars (e.g., Corcoran, 1999; Evans et al., 2004; Stelzer et al., 2005). From the COUP observation, the emission ratio for late O and B stars is found to scatter around the canonical value by three orders of magnitude. However, as they cautioned (Stelzer et al., 2005), this may not represent the most luminous early O stars due to the absence of spectral types earlier than O7. Therefore the Pismis 24 cluster, with two O3 stars, is particularly valuable for assessing this relation in a single massive cluster. Using reported in Massey et al. (2001) 101010It should be noted that Heap et al. (2006) have proposed a new calibration between the spectral type and effective temperature of O stars, based on analysis of high resolution HST, FUSE, and optical spectra. The spectral calibration in general use is by Vacca et al. (1996), which Massey et al. (2001) used to derive bolometric luminosity for Pismis 24 O stars. The derived using the Heap et al. (2006) calibration is 0.4 dex lower than using the Vacca et al. (1996) value for an O4V star, and 0.15 dex lower for an O8V star. Here we use the new bolometric corrections from Heap et al. (2006) to derive bolometric luminosities for Pismis 24 stars. The bolometric correction value for the two O3.5 stars is not provided by Heap et al. (2006), and we adopt . COUP data points are from Stelzer et al. (2005) and originally derived from Hillenbrand (1997)., Figure 15 shows the – relation for our detections of cataloged O and B0 stars together with the strong wind sample and weak wind sample from the COUP study (Stelzer et al., 2005). The ratio for O stars in the Pismis 24 cluster is consistent with the value with an order of magnitude scatter. Although there are only 9 data points and one upper limit ( for WR 93 is not well determined due to the poorly characterized bolometric correction for late-type WC stars; Massey et al., 2001), it appears that the correlation has less scatter for stars of the earliest spectral types and the physics behind this relation is likely to be physically related to stellar wind properties.
6.2 Newly-discovered Candidate O Stars
We assembled a list of candidate O stars in Table 7 to facilitate future spectroscopic follow-up via two approaches. Table 7a lists the 13 sources brighter than 80 counts (to guarantee a reliable X-ray spectral fit) with 0.5–8.0 keV absorption corrected X-ray luminosities ergs s-1 as potential new high-mass stars, since pre-MS stars rarely reach X-ray luminosities ergs s-1 (Favata & Micela, 2003; Getman et al., 2005b). Then we examined their X-ray light curves and observed optical and infrared properties to exclude possible AGNs. Since certain O stars are observed to exhibit powerful flares (Feigelson et al., 2002), we do not exclude the X-ray luminous sources that may be extraordinarily bright flaring pre-MS stars. Their lightcurve variability is noted in Table 7.
O stars may reveal themselves as luminous in infrared but appear relatively faint in X-rays due to heavy obscuration in their early evolutionary stages. For example, an O9V star emitting ergs s-1 behind 15 mag of visual extinction would have and counts in our ACIS image when observed at a distance of 2.5 kpc (assuming a keV and without considering a possible K-excess). We selected bright near-IR sources ( mag) detected in the X-ray image to examine whether their JHK colors and X-ray properties are suggestive of obscured early type stars. This brightness selection is used in Hanson, Howarth, & Conti (1997) when they select the spectroscopy sample of massive YSOs in M 17, and we further adapt it to X-ray emitting samples. All 9 known members with spectral type earlier than B0.5, the WR+O7 binary, and the foreground A8IV star were recovered using this critieria. Table 7b gives 11 additional candidates that have colors consistent with early-type stars and are not known foreground stars. Figure 7 and Figure 8 convincingly suggest that highly reddened bright infrared source #654 and #694 are indeed very obscured early O stars with some IR excess. Source #140 is almost certainly a high-mass star since it qualifies using both the IR and the X-ray selection criteria. As a cautionary note for this method, the presence of -band excess may mislead us to include some accreting intermediate-mass stars as candidate O stars.
Given the uncertainties in distance, age, and absorption, readers are cautioned that ONIR spectroscopy on these objects (Table 7) should yield more appropriate classifications for them (e.g., Massey et al., 2001; Walborn et al., 2002). The X-ray sample suggests that the optical sample of Massey et al. (2001) may have significantly underestimated the O star population. However, using a smaller distance of 1.7 kpc will result in a 0.35 dex decrease in the derived X-ray luminosity. Some of the X-ray selected candidates may indeed be lower mass flaring pre-MS stars, which are readily distinguishable from their ONIR spectra. If a large fraction of these 24 candidate O stars are confirmed, the OB population of Pis 24 (Table 6) is doubled to tripled.
On the top right corner of the infrared color-magnitude diagram (Figure 7 and Figure 8), there is another mysterious bright source, #19 (CXOU J172413.60-341456.7), whose color and brightness (, , ) suggest that it is a very luminous object subjected to significant absorption (). It has 17 net counts in X-ray and the median photon energy is 2.5 keV, which is consistent with being obscured and not a foreground star. However, if the star is located at 2.5 kpc, the intrinsic -band magnitude and infrared luminosity will be exceptionally luminous. Thus it is plausible that source #19 is a massive YSO or a young post main-sequence star like WR 93. Spectroscopy is highly warranted and should reveal the nature of this unusually luminous but obscured star.
6.3 Intermediate Mass Stars
The large population of the Pismis 24 cluster offers an exceptionally rich sample of intermediate mass stars. Of particular interest are those with infrared excess, possibly due to the presence of protoplanetary disks. We note that the estimated stellar masses from the infrared color-magnitude diagrams rely on the uncertain age and distance, which are determined with improved precision in recent literature. The ambiguity is more severe among the early B stars (Figure 7; for example, the inferred stellar mass for a 14 star from the 1 Myr isochrone can be as low as 4 when estimated from a 0.3 Myr isochrone. However, the X-ray selected sample is important for future follow-up for this poorly studied region. We list in Table 8 100 X-ray selected candidate intermediate-mass stars, which have dereddened spectral types A0B0 estimated from the NIR color-magnitude diagram (Figure 7 and Figure 8) assuming 1 Myr for age and 2.56 kpc for distance. Optical spectroscopy is needed to give accurate spectral classifications. Among them, four stars exhibit significant -band excesses in the NIR color-color diagram (Figure 6), which are good candidates for HAeBe stars. spectroscopy on this sample might further reveal the existence of accretion. Their X-ray luminosities are on the order of ergs s-1, consistent with previous ROSAT PSPC (0.1-2.4 keV) observation of HAeBe stars (Zinnecker & Preibisch, 1994).
One interesting result has been mentioned in §4.5 – the available IR photometry data suggest that the ratio between the number of Class II and Class III pre-MS stars with mass is low, . Over the mass range , the ratio between the number of Class II and Class III pre-MS stars is even lower, . It is important to note that such a ratio is derived from X-ray selected stars, without any prior knowledge of disk indicators. The low fraction of the cluster members possessing disks is rather surprising since apparently these X-ray emitting pre-MS stars are very young (in the company of O3 stars). However, the low disk frequency is consistent with the previous studies in NGC 6611 by Hillenbrand et al. (1993). They find that optically thick circumstellar disks are already rare among the intermediate-mass pre-MS stars with ages less than 1 Myr and suggest the disk lifetimes are much shorter for the massive stars than those of solar type stars. It seems also consistent with the suggestion that disk evolution happens rapidly in clusters based on recent Spitzer observations (e.g., Hartmann et al., 2005; Sicilia-Aguilar et al., 2006; Lada et al., 2006). The drastic radiation environment may play a bigger role here in the dissipation of disks, rather than mass loss via accretion. Further Spitzer study on this statistically significant sample will provide constraints on the timescale of the circumstellar disk dissipation and the formation of planetary systems.
6.4 Flaring pre-MS Stars
There are 31 sources identified as highly variable (; variability flag “” in Table 1 and Table 2); their lightcurves exhibit flaring activity as most frequently seen in pre-MS stars when magnetic reconnection events occur in their coronae. Eleven of them have more than 80 net counts (0.5–8.0 keV), so we can reliably derive their X-ray luminosities through spectral fits. Seven of the flaring sources exhibit luminosities above ergs s-1, which is exceptionally high for pre-MS stars in their flaring phase (Feigelson & Montmerle, 1999; Favata & Micela, 2003).
One extraordinarily intense flare is seen in source #672 (CXOU J172457.87-341203.9), comparable to some of the strongest X-ray flares known in pre-MS stars (Grosso et al., 2004; Favata et al., 2005; Getman et al., 2006). The time-energy diagram, binned lightcurve, and X-ray spectrum for #672 are shown in Figure 16. In contrast to the typical impulsive fast rise phase of 2 hr observed in the X-ray flares of pre-MS stars, this flare shows a hr rising phase to reach its highest flux and still remains at the peak level at the end of our observation. This is similar to the powerful flare seen in the non-accreting pre-MS star LkH 312 in the Orion B cloud (Grosso et al., 2004). The count rate is times higher during flaring compared to the quiescent level before flaring. The spectrum is hard ( keV), as seen in many pre-MS stars in COUP during flares (Favata et al., 2005). The spectral fitting gives a rather hard keV, corresponding to thermal plasma of MK. The infrared countpart for this X-ray source shows and its location in the color-magnitude diagram suggests a high-mass star. The SIRIUS images were visually examined and there is a possibility that the flare originates from a poorly resolved low mass companion to the high-mass star. If a future spectrum confirms that it is an early type star, the flaring behavior is similar to that observed in the Orion Nebula O9.5 star Ori A (Feigelson et al., 2002), either from an extraordinary magnetic reconnection flare in a low mass companion, or from non-standard wind shocks in the massive stellar winds (Feigelson et al., 2002; Stelzer et al., 2005).
6.5 X-ray Selected Deeply Embedded Population
In Table 9 we assemble a sample of 16 heavily obscured objects. These are sources that have keV (with net counts to be reliable) or cm-2 derived from spectral fitting. This subsample of the hardest sources (classified in Table 5) likely contains deeply embedded protostars in addition to older stars heavily obscured by molecular material. Their spatial distribution is shown in Figure 17, overlaid on a DSS optical image. Several of them appear to be clustered in the optical/infrared dark column (S.E.C. in the CO map) clearly seen in visible and 2MASS images (Figure 1). Others are widely distributed along the rim of the ringlike nebula. A plausible explanation is that the nebulosity traces the rim of a bowl-shape shell facing us, thus the column density in our line-of-sight to those objects is much higher. This geometric configuration is consistent with the previous conclusion that G353.2+0.9 is a blister HII region viewed face-on (Massi et al., 1997).
7 Diffuse X-ray Emission
With two of the most massive stars known and a luminous WR star in the field, it is reasonable to expect diffuse X-ray emission in NGC 6357, from strong stellar winds and parsec-scale wind-wind collisions (Townsley et al., 2003). A more recent study of X-ray diffuse emission in the 30 Doradus star-forming complex is reported in Townsley et al. (2006b), which provides our technical procedures to extract diffuse emission. From the point source locations and extraction regions (Table 1 and 2), we can mask the point sources and extract the spectrum of possible remaining diffuse emission. Two regions of different scales are used for extraction, which yield consistent measurements of the emission. They are outlined by the white and the cyan polygons in Figure 2b. The background spectrum was scaled by the effective area and by the ratio of the geometric areas to be appropriate for the region of diffuse emission being fit; see Section 5.1 of Townsley et al. (2003) for details. The spectra can be fit using a soft optically thin thermal plasma with keV and cm-2. The corresponding observed soft band X-ray luminosity is ergs s-1 ( ergs s-1 if corrected for absorption). This is comparable to the observed diffuse X-ray emission in M 17 and the Rosette Nebula (Townsley et al., 2003).
However, the detected emission does not necessarily arise from wind-generated plasma. Under the assumption that the gas temperature within the cluster is relatively constant and hot ( K), Stevens & Hartwell (2003) show that the luminosity level of the expected diffuse emission in a stellar cluster can be estimated using a scaling factor (equation 10), which Getman et al. (2006) adopt to evaluate the nature of X-ray diffuse emission in the Cepheus B region. We follow the same method to obtain a crude estimate of diffuse emission from the massive star winds 111111The WC+O star WR 93 is not in the cluster core region, thus we do not include it in the calculation. For reader’s reference, the mass loss rate and the terminal wind velocity for WR 93 is given in §2. Two O3 stars dominates the cluster core and two parameters are needed to predict the X-ray luminosity: the total stellar mass loss rate , and the mean weighted terminal velocity for the stars in the cluster . For the O3 star Pis 24-1, Benaglia et al. (2001) derived a terminal wind velocity of km s-1 and an upper limit for the mass loss rate of yr-1. No measurements for Pis 24-17 is found in the literature, and we assume and are comparable to Pismis 24-1. Adopting these wind parameters, and an unrealistically optimistic 100% efficiency for conversion from stellar wind to thermalization of the cluster, and pc for the radius of the cluster core, we estimate the diffuse X-ray luminosity ergs s-1 (equation 8 and 10). This is apparently insufficient to account for the observed luminosity.
An alternative explanation is that the diffuse emission is mainly the contribution from unresolved X-ray emission from thousands of low mass pre-MS members in Pismis 24. Assuming that Pismis 24 and the ONC have identical IMFs with identical XLFs, the only difference here is that Pismis 24 cluster has 5 times the total known population of the ONC (see §5.1). We focus on the lightly obscured populations since they are less affected by the different amount of absorption along the two sightlines. Scaling from COUP (Feigelson et al., 2005), the total expected soft-band X-ray luminosity is ergs s-1 from the entire Pismis 24 population and the actual observed soft luminosity from resolved cluster members is ergs s-1 (since absorption correction to individual stars is infeasible, we consider this to be a lower limit to the intrinsic soft-band luminosity ). Thus the integrated X-ray emission from the unresolved X-ray emitting pre-MS population in Pismis 24 is estimated to be ergs s-1, after deducting the observed from the expected . This is fully consistent with the absorption-corrected soft diffuse X-ray luminosity ergs s-1. Therefore we suggest that most of the diffuse emission is probably the combined contribution from individually undetected X-ray-faint pre-MS cluster members.
We further note that X-ray emission is clearly present on the ACIS-S chips. Several point sources are detected, with very large PSFs due to large off-axis angles. The X-ray emission captured at the lower edge of the S-array field corresponds to the location of the H ii region G353.2+0.7 (see Figure 2b and Figure 1f). But due to the poor PSF, no further conclusion can be drawn on whether the emission is diffuse in nature. Nevertheless, this detection confirms the ROSAT detection of G353.2+0.7 and implies that it contains lots of X-ray-emitting young stars.
8 Summary
This 38 ks ACIS observation of the NGC 6357 field has provided the first high spatial resolution X-ray image of this massive star-forming complex. We summarize the main results of our study as follows:
1. We detect 779 X-ray sources with a limiting X-ray sensitivity of ergs s-1. There are 445 ACIS sources matched to 2MASS point sources with separation. Further visual inspection of an archival HST image and SIRIUS images yield a total of 616 ONIR counterparts. We estimate the extragalactic contaminants via a careful simulation of detection efficiency of the background AGN population, and conclude that no more than 4% of our detections are AGNs. Similarly we adopt the Besançon stellar population sythesis model of the Galactic disk and suggest 11 stars as foreground objects based on their X-ray softness and NIR color. Excluding X-ray sources without ONIR identifications that are possible AGNs, the rest of the X-ray sources without ONIR counterparts are likely new Pismis 24 members that are clustered around the massive stars and/or deeply embedded in the cloud. The X-ray detected population provides the first deep probe of the rich population of this massive cluster, increasing the number of known members from optical study by a factor of .
2. On the NIR color-color diagram (Figure 6), it is clear that ACIS detects more Class III sources than Class II/I sources. In the color-magnitude plot (Figure 7), the locations of most of the ACIS sources are consistent with being high mass stars and pre-MS intermediate mass stars (), subjected to a visual extinction of at 2.5 kpc. The new high mass stars, if spectroscopically confirmed, double the known high mass population of the cluster. Dozens of intermediate mass stars are newly recognized members of the cluster. The ratio between Class III and Class II objects in the intermediate- to high-mass range is . This is an important new sample for stellar and disk studies of intermediate mass pre-MS stars. The brightness of several K-excess sources makes them extremely favorable for ground based follow-up. We find a very luminous X-ray emitting infrared source subjected to significant absorption, which may be a new obscured massive YSO or a Wolf-Rayet star.
3. We determine the spatial distribution of over 700 new members to sub-arcsecond precision for the first time. The cluster is roughly spherically symmetric, with the highest stellar density around the massive O3 stars. A density enhancement centered at the tip of the molecular filament deserves further investigation (Figure 11). A radial profile of the stellar surface density shows that the physical size of the cluster spans over 2 pc in radius and extends beyond 6 pc (Figure 12).
4. XLFs are derived for lightly obscured and heavily obscured stellar populations in NGC 6357 (Figure 9). The high X-ray luminosity end ( ergs s-1) of the NGC 6357 XLF is clearly consistent with a power law relation as seen in COUP and Cep B, allowing a scaling comparison with the COUP XLF. The first estimate of the total cluster population of Pismis 24 is a few times the known Orion population. The presence of two O3 stars is consistent with the standard IMF.
5. We detect all 10 known OB stars with spectral type earlier than B1 in the Pismis 24 cluster, including the WC7+O7 binary WR 93. Their ratios are consistent with the canonical value with less than an order of magnitude scatter. The O3 stars Pis 24-1 (O3.5If) and Pis 24-17 (O3.5IIIf) exhibit X-ray luminosities ergs s-1. The X-ray spectrum of Pis 24-1 shows a soft emission component ( keV) and a harder component ( keV), while Pis 24-17 exhibits an unusally strong Si xiii line with a soft keV thermal plasma. The WC7+O7 binary WR93 is the brightest X-ray source in the field (). Its hard spectrum suggests that the X-ray emission is generated from colliding winds. The lightcurves of these massive stars are constant through the observation. We assembled a list of candidate O stars from sources with high X-ray and infrared luminosity to facilitate future spectroscopy follow-up. Four candidate HAeBe stars are also identified.
6. We report the detection of X-ray emission from an EGG at the tip of a molecular pillar, which was previously found to be an IR source and the peak of the radio continuum. It is in the early evolutionary of stages of star formation. The spectral type estimated from its SED is B0–B2. The non-detection of EGGs in the Eagle Nebula may be the result of lower stellar mass and earlier evolutionary phases. We assemble a sample of 16 deeply embedded objects.
7. Several flaring sources exhibit luminosities above ergs s-1, which is exceptionally high for pre-MS stars. One powerful flare seen in ACIS #672 (CXOU J172457.87-341203.9) is comparable to the strongest X-ray flares known in pre-MS stars ( ergs s-1). Its lightcurve rises 15 times above the quiescent level during the flare, with a slow rise phase that is distinct from the fast rise flares seen pre-MS stars.
8. Soft unresolved X-ray emission in the NGC 6357 region is present. However, the luminosity derived from spectral fitting is consistent with the estimated level of integrated emission from the unresolved pre-MS stars.
We sincerely thank the anonymous referee for his/her careful review and many constructive suggestions to improve the clarity of our paper. We are grateful to Steve Strom for an enlightening discussion on disk fractions among massive stars. We thank Takahiro Nagayama, Takahiro Kawadu, and the IRSF/SIRIUS team for taking the SIRIUS images of NGC 6357. Support for this work was provided to Gordon Garmire, the ACIS Principal Investigator, by the National Aeronautics and Space Administration (NASA) through NASA Contract NAS8-38252 and Chandra Contract SV4-74018 issued by the Chandra X-ray Observatory Center, which is operated by the Smithsonian Astrophysical Observatory for and on behalf of NASA under contract NAS8-03060. This publication makes use of data products from the Two Micron All Sky Survey, which is a joint project of the University of Massachusetts and the Infrared Processing and Analysis Center/California Institute of Technology, funded by NASA and the National Science Foundation. This research has made use of the SIMBAD database and the VizieR catalogue access tool, operated at CDS, Strasbourg, France. This research made use of data products from the Midcourse Space Experiment. Processing of the data was funded by the Ballistic Missile Defense Organization with additional support from NASA Office of Space Science. This research has also made use of the NASA/ IPAC Infrared Science Archive, which is operated by the Jet Propulsion Laboratory, California Institute of Technology, under contract with NASA.
Facility: CXO (ACIS)
References
- Abbott et al. (1986) Abbott, D. C., Torres, A. V., Bieging, J. H., & Churchwell, E. 1986, ApJ, 303, 239
- Albacete Colombo et al. (2003) Albacete Colombo, J. F., Méndez, M., & Morrell, N. I. 2003, MNRAS, 346, 704
- Alexander et al. (2003) Alexander, D. M., et al. 2003, AJ, 126, 539
- Alter et al. (1970) Alter, G., Balazs, B., Ruprecht, J., & Vanysek, J. 1970, Budapest: Akademiai Kiado, 1970, 2nd ed., edited by G. Alter, B. Balazs, J. Ruprecht
- Arias et al. (2006) Arias, J. I., Barbá, R. H.,Maíz Apellániz, J., Morrell, N. I., & Rubio, M. 2006, MNRAS, 366, 739
- Arnaud (1996) Arnaud, K. A. 1996, ASP Conf. Ser. 101: Astronomical Data Analysis Software and Systems V, 5, 17
- Audard et al. (2003) Audard, M., Güdel, M., Sres, A., Raassen, A. J. J., & Mewe, R. 2003, A&A, 398, 1137
- Babel & Montmerle (1997a) Babel, J., & Montmerle, T. 1997, A&A, 323, 121
- Babel & Montmerle (1997b) Babel, J., & Montmerle, T. 1997, ApJ, 485, L29
- Baraffe et al. (1998) Baraffe, I., Chabrier, G., Allard, F., & Hauschildt, P. H. 1998, A&A, 337, 403
- Barger et al. (2003) Barger, A. J., et al. 2003, AJ, 126, 632
- Benaglia et al. (2001) Benaglia, P., Cappa, C. E., & Koribalski, B. S. 2001, A&A, 372, 952
- Berghoefer & Schmitt (1994) Berghofer, T. W., & Schmitt, J. H. M. M. 1994, Science, 265, 1689
- Berghoefer et al. (1997) Berghoefer, T. W., Schmitt, J. H. M. M., Danner, R., & Cassinelli, J. P. 1997, A&A, 322, 167
- Bessell & Brett (1988) Bessell, M. S., & Brett, J. M. 1988, PASP, 100, 1134
- Bohigas et al. (2004) Bohigas, J., Tapia, M., Roth, M., & Ruiz, M. T. 2004, AJ, 127, 2826
- Brandt et al. (2001) Brandt, W. N., et al. 2001, AJ, 122, 2810
- Broos et al. (2002) Broos, P. S., Townsley, L. K., Getman, K. V., & Bauer, F. E. 2002, ACIS Extract, An ACIS Point Source Extraction Package (University Park: Pennsylvania State Univ.)
- Chini & Kruegel (1983) Chini, R., & Kruegel, E. 1983, A&A, 117, 289
- Chlebowski et al. (1989) Chlebowski, T., Harnden, F. R., & Sciortino, S. 1989, ApJ, 341, 427
- Corcoran et al. (1994) Corcoran, M. F., et al. 1994, ApJ, 436, L95
- Corcoran (1999) Corcoran, M. F. 1999, Revista Mexicana de Astronomia y Astrofisica Conference Series, 8, 131
- Cox (2000) Cox A. N. 2000, Astrophysical Quantities, Publisher: Springer (4rd edition), 2000
- De Marco et al. (2006) De Marco, O., O’Dell, C. R., Gelfond, P., Rubin, R. H., & Glover, S. C. O. 2006, AJ in press, astro-ph/0602545
- Dickey & Lockman (1990) Dickey, J. M., & Lockman, F. J. 1990, ARA&A, 28, 215
- Dorland et al. (1986) Dorland, H., Montmerle, T., & Doom, C. 1986, A&A, 160, 1
- Dougherty et al. (2005) Dougherty, S. M., Beasley, A. J., Claussen, M. J., Zauderer, B. A., & Bolingbroke, N. J. 2005, ApJ, 623, 447
- Ebeling et al. (2006) Ebeling, H., White, D. A., & Rangarajan, F. V. N. 2006, MNRAS, 368, 65
- Elmegreen (2005) Elmegreen, B. G. 2005, in Starbursts: From 30 Doradus to Lyman Break Galaxies, R. de Grijs & R. M. González Delgado (eds.), Dordrecht: Springer, 57
- Evans et al. (2003) Evans, N. R., Seward, F. D., Krauss, M. I., Isobe, T., Nichols, J., Schlegel, E. M., & Wolk, S. J. 2003, ApJ, 589, 509
- Evans et al. (2004) Evans, N. R., Schlegel, E. M., Waldron, W. L., Seward, F. D., Krauss, M. I., Nichols, J., & Wolk, S. J. 2004, ApJ, 612, 1065
- Ezoe et al. (2006) Ezoe, Y., Kokubun, M., Makishima, K., Sekimoto, Y., & Matsuzaki, K. 2006, ApJ in press, astro-ph/0510737
- Favata & Micela (2003) Favata, F., & Micela, G. 2003, Space Science Reviews, 108, 577
- Favata et al. (2005) Favata, F., Flaccomio, E., Reale, F., Micela, G., Sciortino, S., Shang, H., Stassun, K. G., & Feigelson, E. D. 2005, ApJS, 160, 469
- Feigelson et al. (2002) Feigelson, E. D., Broos, P., Gaffney, J. A., Garmire, G., Hillenbrand, L. A., Pravdo, S. H., Townsley, L., & Tsuboi, Y. 2002, ApJ, 574, 258
- Feigelson & Lawson (2004) Feigelson, E. D., & Lawson, W. A. 2004, ApJ, 614, 267
- Feigelson & Montmerle (1999) Feigelson, E. D., & Montmerle, T. 1999, ARA&A, 37, 363
- Feigelson et al. (2003) Feigelson, E. D., Gaffney, J. A., Garmire, G., Hillenbrand, L. A., & Townsley, L. 2003, ApJ, 584, 911
- Feigelson et al. (2005) Feigelson, E. D., et al. 2005, ApJS, 160, 379
- Felli et al. (1990) Felli, M., Persi, P., Roth, M., Tapia, M., Ferrari-Toniolo, M., & Cervelli, A. 1990, A&A, 232, 477
- Freeman et al. (2002) Freeman, P. E., Kashyap, V., Rosner, R., & Lamb, D. Q. 2002, ApJS, 138, 185
- Frogel & Persson (1974) Frogel, J. A., & Persson, S. E. 1974, ApJ, 192, 351
- Gagné et al. (2005) Gagné, M., Oksala, M. E., Cohen, D. H., Tonnesen, S. K., ud-Doula, A., Owocki, S. P., Townsend, R. H. D., & MacFarlane, J. J. 2005, ApJ, 628, 986
- Gaustad et al. (1999) Gaustad, J. E., Rosing, W., McCullough, P. R., & van Buren, D. 1999, IAU Symp. 190: New Views of the Magellanic Clouds, 190, 99
- Getman et al. (2005a) Getman, K. V., et al. 2005, ApJS, 160, 319
- Getman et al. (2005b) Getman, K. V., Feigelson, E. D., Grosso, N., McCaughrean, M. J., Micela, G., Broos, P., Garmire, G., & Townsley, L. 2005, ApJS, 160, 353
- Getman et al. (2006) Getman, K. V., et al., ApJ, in press, astro-ph/0601405
- Giardino et al. (2004) Giardino, G., Favata, F., & Micela, G. 2004, A&A, 424, 965
- Grosso et al. (2004) Grosso, N., Montmerle, T., Feigelson, E. D., & Forbes, T. G. 2004, A&A, 419, 653
- Grosso et al. (2005) Grosso, N., et al. 2005, ApJS, 160, 530
- Güdel et al. (1998) Güdel, M., Guinan, E. F., & Skinner, S. L. 1998, ASP Conf. Ser. 154: Cool Stars, Stellar Systems, and the Sun, 154, 1041
- Hanson, Howarth, & Conti (1997) Hanson, M. M., Howarth, I. D., & Conti, P. S. 1997, ApJ, 489, 698
- Harnden et al. (1979) Harnden, F. R., et al. 1979, ApJ, 234, L51
- Hartmann et al. (2005) Hartmann, L., Megeath, S. T., Allen, L., Luhman, K., Calvet, N., D’Alessio, P., Franco-Hernandez, R., & Fazio, G. 2005, ApJ, 629, 881
- Haynes et al. (1978) Haynes, R. F., Caswell, J. L., & Simons, L. W. J. 1978, Australian Journal of Physics Astrophysical Supplement, 45, 1
- Healy et al. (2004a) Healy, K. R., Hester, J. J., & Claussen, M. J. 2004, ApJ, 610, 835
- Healy et al. (2004b) Healy, K. R., Hester, J. J., Scowen, P. A., & Snider, K. D. 2004, BAAS, 205, 105.02
- Heap et al. (2006) Heap, S. R., Lanz, T., & Hubeny, I. 2006, ApJ, 638, 409
- Herbig (1960) Herbig, G. H. 1960, ApJS, 4, 337
- Hester et al. (1996) Hester, J. J., et al. 1996, AJ, 111, 2349
- Hester & Desch (2005) Hester, J. J., & Desch, S. J. 2005, ASP Conf. Ser. 341: Chondrites and the Protoplanetary Disk, eds. A. N. Krot, E. R. D. Scott, and Bo Reipurth, 341, 107
- Hillenbrand et al. (1993) Hillenbrand, L. A., Massey, P., Strom, S. E., & Merrill, K. M. 1993, AJ, 106, 1906
- Hillenbrand (1997) Hillenbrand, L. A. 1997, AJ, 113, 1733
- Hillenbrand & Hartmann (1998) Hillenbrand, L. A., & Hartmann, L. W. 1998, ApJ, 492, 540
- Hillenbrand & White (2004) Hillenbrand, L. A., & White, R. J. 2004, ApJ, 604, 741
- Huensch et al. (1996) Huensch, M., Schmitt, J. H. M. M., Schroeder, K.-P., & Reimers, D. 1996, A&A, 310, 801
- van der Hucht (2001) van der Hucht, K. A. 2001, New Astronomy Review, 45, 135
- Joye & Mandel (2003) Joye, W. A., & Mandel, E. 2003, ASP Conf. Ser. 295: Astronomical Data Analysis Software and Systems XII, 295, 489
- Kharchenko et al. (2005) Kharchenko, N. V., Piskunov, A. E., Röser, S., Schilbach, E., & Scholz, R.-D. 2005, A&A, 438, 1163
- Kitamoto & Mukai (1996) Kitamoto, S., & Mukai, K. 1996, PASJ, 48, 813
- Lada (1987) Lada, C. J. 1987, IAU Symp. 115: Star Forming Regions, 115, 1, eds. Peimbert,M., Jugaku, J. Dordrecht:Kluwer
- Lada & Adams (1992) Lada, C. J., & Adams, F. C. 1992, ApJ, 393, 278
- Lada & Lada (2003) Lada, C. J., & Lada, E. A. 2003, ARA&A, 41, 57
- Lada et al. (2006) Lada, C. J., et al. 2006, AJ, 131, 1574
- Linsky et al. (2003) Linsky, J. L., Gagne, M., & Mytyk, A. 2003, IAU Symposium, 221, 207P
- Lortet et al. (1984) Lortet, M. C., Testor, G., & Niemela, V. 1984, A&A, 140, 24
- Lucy (1974) Lucy, L. B. 1974, AJ, 79, 745
- Lucy & White (1980) Lucy, L. B., & White, R. L. 1980, ApJ, 241, 300
- Luhman (1999) Luhman, K. L. 1999, ApJ, 525, 466
- MacFarlane et al. (1993) MacFarlane, J. J., Waldron, W. L., Corcoran, M. F., Wolff, M. J., Wang, P., & Cassinelli, J. P. 1993, ApJ, 419, 813
- Maíz-Apellániz et al. (2004) Maíz-Apellániz, J., Walborn, N. R., Galué, H. Á., & Wei, L. H. 2004, ApJS, 151, 103
- Massey & Johnson (1993) Massey, P., & Johnson, J. 1993, AJ, 105, 980
- Massey et al. (2001) Massey, P., DeGioia-Eastwood, K., & Waterhouse, E. 2001, AJ, 121, 1050
- Massi et al. (1997) Massi, F., Brand, J., & Felli, M. 1997, A&A, 320, 972
- McBreen et al. (1983) McBreen, B., Jaffe, D. T., & Fazio, G. G. 1983, AJ, 88, 835
- McCullough (2000) McCullough, P. R. 2000, PASP, 112, 1542
- Meyer et al. (1997) Meyer, M. R., Calvet, N., & Hillenbrand, L. A. 1997, AJ, 114, 288
- Moffat & Vogt (1973) Moffat, A. F. J., & Vogt, N. 1973, A&AS, 10, 135
- Moretti et al. (2003) Moretti, A., Campana, S., Lazzati, D., & Tagliaferri, G. 2003, ApJ, 588, 696
- Mori et al. (2001) Mori, K., Tsunemi, H., Miyata, E., Baluta, C. J., Burrows, D. N., Garmire, G. P., & Chartas, G. 2001, ASP Conf. Ser. 251: New Century of X-ray Astronomy, 251, 576
- Nagayama et al. (2003) Nagayama, T., et al. 2003, Proc. SPIE, 4841, 459
- Neckel (1978) Neckel, T. 1978, A&A, 69, 51
- Neckel (1984) Neckel, T. 1984, A&A, 137, 58
- Nugis & Lamers (2000) Nugis, T., & Lamers, H. J. G. L. M. 2000, A&A, 360, 227
- Nugis et al. (1998) Nugis, T., Crowther, P. A., & Willis, A. J. 1998, A&A, 333, 956
- Oskinova et al. (2003) Oskinova, L. M., Ignace, R., Hamann, W.-R., Pollock, A. M. T., & Brown, J. C. 2003, A&A, 402, 755
- Owocki et al. (1988) Owocki, S. P., Castor, J. I., & Rybicki, G. B. 1988, ApJ, 335, 914
- Owocki & Cohen (1999) Owocki, S. P., & Cohen, D. H. 1999, ApJ, 520, 833
- Persi et al. (1986) Persi, P., Ferrari-Toniolo, M., Roth, M., & Tapia, M. 1986, A&A, 170, 97
- Pismis (1959) Pismis, P. 1959, Boletin de los Observatorios Tonantzintla y Tacubaya, 2, 37
- Pollock (1987) Pollock, A. M. T. 1987, ApJ, 320, 283
- Pollock et al. (1995) Pollock, A. M. T., Haberl, F., & Corcoran, M. F. 1995, IAU Symposium, 163, 512
- Portegies Zwart et al. (2002) Portegies Zwart, S. F., Pooley, D., & Lewin, W. H. G. 2002, ApJ, 574, 762
- Preibisch & Feigelson (2005) Preibisch, T., & Feigelson, E. D. 2005, ApJS, 160, 390
- Preibisch et al. (2005) Preibisch, T., et al. 2005, ApJS, 160, 401
- Prinja et al. (1990) Prinja, R. K., Barlow, M. J., & Howarth, I. D. 1990, ApJ, 361, 607
- Prisinzano et al. (2005) Prisinzano, L., Damiani, F., Micela, G., & Sciortino, S. 2005, A&A, 430, 941
- Rho et al. (2004) Rho, J., Ramírez, S. V., Corcoran, M. F., Hamaguchi, K., & Lefloch, B. 2004, ApJ, 607, 904
- Robin et al. (2003) Robin, A. C., Reylé, C., Derrière, S., & Picaud, S. 2003, A&A, 409, 523
- Sakellis et al. (1984) Sakellis, S., Taylor, M. I., Taylor, K. N. R., Vaile, R. A., & Han, T. D. 1984, PASP, 96, 543
- Schraml & Mezger (1969) Schraml, J., & Mezger, P. G. 1969, ApJ, 156, 269
- Schmitt et al. (1995) Schmitt, J. H. M. M., Fleming, T. A., & Giampapa, M. S. 1995, ApJ, 450, 392
- Schmitt (1997) Schmitt, J. H. M. M. 1997, A&A, 318, 215
- Seward et al. (1979) Seward, F. D., Forman, W. R., Giacconi, R., Griffiths, R. E., Harnden, F. R., Jones, C., & Pye, J. P. 1979, ApJ, 234, L55
- Sicilia-Aguilar et al. (2006) Sicilia-Aguilar, A., et al. 2006, ApJ, 638, 897
- Siess et al. (2000) Siess, L., Dufour, E., & Forestini, M. 2000, A&A, 358, 593
- Skinner et al. (2003) Skinner, S., Gagné, M., & Belzer, E. 2003, ApJ, 598, 375
- Smith et al. (2001) Smith, R. K., Brickhouse, N. S., Liedahl, D. A., & Raymond, J. C. 2001, ApJ, 556, L91
- Stelzer et al. (2005) Stelzer, B., Flaccomio, E., Montmerle, T., Micela, G., Sciortino, S., Favata, F., Preibisch, T., & Feigelson, E. D. 2005, ApJS, 160, 557
- Stetson (1987) Stetson, P. B. 1987, PASP, 99, 191
- Stevens & Hartwell (2003) Stevens, I. R., & Hartwell, J. M. 2003, MNRAS, 339, 280
- The et al. (1994) The, P. S., de Winter, D., & Perez, M. R. 1994, A&AS, 104, 315
- Torres-Dodgen & Massey (1988) Torres-Dodgen, A. V., & Massey, P. 1988, AJ, 96, 1076
- Townsley et al. (2003) Townsley, L. K., Feigelson, E. D., Montmerle, T., Broos, P. S., Chu, Y., & Garmire, G. P. 2003, ApJ, 593, 874
- Townsley et al. (2000) Townsley, L. K., Broos, P. S., Garmire, G. P., & Nousek, J. A. 2000, ApJ, 534, L139
- Townsley et al. (2002) Townsley, L. K., Broos, P. S., Chartas, G., Moskalenko, E., Nousek, J. A., & Pavlov, G. G. 2002, Nuclear Instruments and Methods in Physics Research A, 486, 716
- Townsley et al. (2006a) Townsley, L. K., Broos, P. S., Feigelson, E. D., Brandl, B. R., Chu, Y.-H., Garmire, G. P., & Pavlov, G. G. 2006, AJ, 131, 2140
- Townsley et al. (2006b) Townsley, L. K., Broos, P. S., Feigelson, E. D., Garmire, G. P., & Getman, K. V. 2006, AJ, 131, 2164
- Vacca et al. (1996) Vacca, W. D., Garmany, C. D., & Shull, J. M. 1996, ApJ, 460, 914
- Vuong et al. (2003) Vuong, M. H., Montmerle, T., Grosso, N., Feigelson, E. D., Verstraete, L., & Ozawa, H. 2003, A&A, 408, 581
- Walborn (1994) Walborn, N. R. 1994, ASP Conf. Ser. 60: The MK Process at 50 Years: A Powerful Tool for Astrophysical Insight, 60, 84
- Walborn et al. (2002) Walborn, N. R., et al. 2002, AJ, 123, 2754
- Waldron et al. (2004) Waldron, W. L., Cassinelli, J. P., Miller, N. A., MacFarlane, J. J., & Reiter, J. C. 2004, ApJ, 616, 542
- Weisskopf et al. (2002) Weisskopf, M. C., Brinkman, B., Canizares, C., Garmire, G., Murray, S., & Van Speybroeck, L. P. 2002, PASP, 114, 1
- Williams et al. (1990) Williams, P. M., van der Hucht, K. A., Pollock, A. M. T., Florkowski, D. R., van der Woerd, H., & Wamsteker, W. M. 1990, MNRAS, 243, 662
- Wilson et al. (1970) Wilson, T. L., Mezger, P. G., Gardner, F. F., & Milne, D. K. 1970, A&A, 6, 364
- Wolk & Walter (1996) Wolk, S. J., & Walter, F. M. 1996, AJ, 111, 2066
- Wolk et al. (2002) Wolk, S. J., Bourke, T. L., Smith, R. K., Spitzbart, B., & Alves, J. 2002, ApJ, 580, L161
- Zacharias et al. (2004) Zacharias, N., Urban, S. E., Zacharias, M. I., Wycoff, G. L., Hall, D. M., Monet, D. G., & Rafferty, T. J. 2004, AJ, 127, 3043
- Zinnecker & Preibisch (1994) Zinnecker, H., & Preibisch, T. 1994, A&A, 292, 152
| Source | Position | Extracted Countsaa Full band = 0.5–8 keV; Hard band = 2–8 keV. | Characteristics | ||||||||||||||||
|---|---|---|---|---|---|---|---|---|---|---|---|---|---|---|---|---|---|---|---|
| Seq | CXOU J | Err | bb Off-axis angle. | Net | Net | Bkgd | Net | PSF | Signif | cc probability extracted counts (full band) are solely from background. | Anomdd Source anomalies: g = fractional time that source was on a detector (FRACEXPO from mkarf) is ; e = source on field edge; p = source piled up; s = source on readout streak. Note that a reduced PSF fraction (significantly below 90) indicates that the source is in a crowded region. | Varee Source variability: a = no evidence for variability; b = possibly variable; c = definitely variable. No test is performed for sources with fewer than 4 total full-band counts. No value is reported for sources in chip gaps or on field edges. | EffExp | Med E | |||||
| # | (deg) | (deg) | (″) | (′) | Full | Full | Full | Hard | Frac | (ks) | (keV) | ||||||||
| (1) | (2) | (3) | (4) | (5) | (6) | (7) | (8) | (9) | (10) | (11) | (12) | (13) | (14) | (15) | (16) | (17) | |||
| 1 | 172353.98-340850.8 | 260.974932 | -34.147448 | 0.4 | 10.7 | 267.2 | 17.7 | 22.8 | 160.0 | 0.91 | 14.7 | -5 | …. | a | 32.7 | 2.4 | |||
| 2 | 172358.42-340802.6 | 260.993436 | -34.134056 | 0.5 | 10.2 | 107.0 | 11.5 | 12.0 | 71.7 | 0.91 | 8.9 | -5 | …. | b | 33.1 | 2.6 | |||
| 3 | 172359.11-341217.6 | 260.996328 | -34.204895 | 0.8 | 9.1 | 23.2 | 6.6 | 12.8 | 12.4 | 0.91 | 3.2 | -5 | …. | a | 33.0 | 2.0 | |||
| 4 | 172401.20-340928.0 | 261.005039 | -34.157783 | 0.9 | 9.1 | 13.7 | 5.3 | 8.3 | 7.2 | 0.89 | 2.4 | -4.3 | …. | a | 33.7 | 2.1 | |||
| 5 | 172402.27-341110.4 | 261.009476 | -34.186237 | 0.8 | 8.5 | 19.4 | 5.8 | 7.6 | 20.0 | 0.90 | 3.1 | -5 | …. | a | 34.2 | 3.7 | |||
| 6 | 172403.19-341402.2 | 261.013313 | -34.233962 | 1.1 | 8.5 | 16.6 | 5.7 | 9.4 | 8.0 | 0.90 | 2.7 | -5 | …. | a | 34.2 | 1.9 | |||
| 8 | 172405.42-341257.5 | 261.022606 | -34.215981 | 0.4 | 7.9 | 63.2 | 8.9 | 6.8 | 58.3 | 0.89 | 6.7 | -5 | …. | a | 34.7 | 3.9 | |||
| 9 | 172405.64-340710.0 | 261.023532 | -34.119459 | 0.7 | 9.3 | 38.2 | 7.3 | 7.8 | 1.4 | 0.90 | 4.8 | -5 | …. | a | 33.6 | 1.1 | |||
| 10 | 172406.70-341305.0 | 261.027933 | -34.218067 | 0.8 | 7.6 | 11.0 | 4.8 | 7.0 | 9.3 | 0.90 | 2.1 | -3.5 | …. | a | 34.9 | 3.8 | |||
| 12 | 172407.65-341751.9 | 261.031884 | -34.297766 | 0.8 | 9.3 | 27.8 | 7.1 | 13.2 | 13.7 | 0.90 | 3.7 | -5 | …. | a | 31.6 | 2.1 | |||
Note. — See §3.3 for a detailed description of the columns. The full table of 665 Chandra sources is available in the electronic edition of the Journal.
| Source | Position | Extracted Countsaa Full band = 0.5–8 keV; Hard band = 2–8 keV. | Characteristics | ||||||||||||||||
|---|---|---|---|---|---|---|---|---|---|---|---|---|---|---|---|---|---|---|---|
| Seq | CXOU J | Err | bb Off-axis angle. | Net | Net | Bkgd | Net | PSF | Signif | cc probability extracted counts (full band) are solely from background. | Anomdd Source anomalies: g = fractional time that source was on a detector (FRACEXPO from mkarf) is ; e = source on field edge; p = source piled up; s = source on readout streak. Note that a reduced PSF fraction (significantly below 90) indicates that the source is in a crowded region. | Varee Source variability: a = no evidence for variability; b = possibly variable; c = definitely variable. No test is performed for sources with fewer than 4 total full-band counts. No value is reported for sources in chip gaps or on field edges. | EffExp | Med E | |||||
| # | (deg) | (deg) | (″) | (′) | Full | Full | Full | Hard | Frac | (ks) | (keV) | ||||||||
| (1) | (2) | (3) | (4) | (5) | (6) | (7) | (8) | (9) | (10) | (11) | (12) | (13) | (14) | (15) | (16) | (17) | |||
| 7 | 172403.64-340634.7 | 261.015178 | -34.109657 | 1.4 | 10.0 | 10.4 | 5.1 | 9.6 | 2.6 | 0.91 | 1.8 | -2.7 | …. | a | 32.4 | 1.6 | |||
| 11 | 172406.84-341149.7 | 261.028513 | -34.197157 | 1.2 | 7.5 | 6.4 | 3.7 | 3.6 | 4.0 | 0.90 | 1.5 | -2.4 | …. | a | 33.0 | 2.0 | |||
| 16 | 172412.29-341500.3 | 261.051238 | -34.250107 | 1.0 | 7.0 | 6.8 | 3.9 | 4.2 | 3.7 | 0.90 | 1.5 | -2.4 | …. | a | 33.1 | 2.1 | |||
| 23 | 172415.22-340730.0 | 261.063419 | -34.125011 | 0.9 | 7.5 | 5.2 | 3.6 | 3.8 | 3.8 | 0.90 | 1.3 | -1.8 | …. | a | 32.2 | 2.6 | |||
| 24 | 172415.43-340958.2 | 261.064294 | -34.166176 | 0.9 | 6.2 | 3.7 | 3.0 | 2.3 | 0.5 | 0.90 | 1.0 | -1.5 | g… | 33.6 | 1.4 | ||||
| 25 | 172415.57-342044.7 | 261.064909 | -34.345752 | 1.5 | 10.3 | 7.9 | 5.3 | 13.1 | 1.2 | 0.91 | 1.4 | -1.6 | …. | a | 28.1 | 1.4 | |||
| 27 | 172415.91-341441.2 | 261.066326 | -34.244799 | 0.8 | 6.2 | 6.3 | 3.5 | 2.7 | 6.2 | 0.90 | 1.5 | -2.7 | …. | a | 34.9 | 3.5 | |||
| 32 | 172418.05-340824.5 | 261.075226 | -34.140162 | 0.9 | 6.5 | 4.5 | 3.2 | 2.5 | 5.9 | 0.89 | 1.2 | -1.8 | …. | a | 35.3 | 4.5 | |||
| 33 | 172418.06-341650.6 | 261.075253 | -34.280743 | 1.0 | 7.0 | 6.5 | 3.7 | 3.5 | 2.2 | 0.89 | 1.5 | -2.5 | …. | a | 34.7 | 1.1 | |||
| 37 | 172419.79-341130.3 | 261.082481 | -34.191754 | 1.0 | 4.9 | 4.8 | 3.0 | 1.2 | 2.4 | 0.90 | 1.3 | -2.8 | …. | a | 36.4 | 1.1 | |||
Note. — See §3.3 for a detailed description of the columns. The full table of 114 Chandra sources is available in the electronic edition of the Journal.
| Source | Spectral Fitaa All fits were “wabs(apec)” in XSPEC and assumed solar abundances. | X-ray Luminositiesbb X-ray luminosities: s = soft band (0.5–2 keV); h = hard band (2–8 keV); t = total band (0.5–8 keV). Absorption-corrected luminosities are subscripted with a . Luminosities were calculated assuming a distance of 2.56 kpc. | Goodness | Notescc 2T means a two-temperature fit was also performed; VT means a variable abundance fit was also performed; see §6.1 for fit parameters. S means the spectral fit is only used as a spline fit for a rough estimate of luminosity; actual fit values are unreliable. P means the fit does not formally satisfy the convergence criterion, nevertheless the fit is acceptable to estimate the luminosity. The confidence intervals are missing since no error calculation is reported in XSPEC. Pis24 stars and other cataloged names obtained from VizieR are also shown. USNO-The USNO-B1.0 Catalog (Monet et al. 2003); it TYC-The Tycho-2 Catalogue (Hog et al. 2000); MSX6C-MSX6C Infrared Point Source Catalog (Egan et al. 2003). | |||||||||||
|---|---|---|---|---|---|---|---|---|---|---|---|---|---|---|---|
| Seq | CXOU J | of Fit | |||||||||||||
| # | (cm-2) | (keV) | (cm-3) | (ergs s-1) | |||||||||||
| (1) | (2) | (3) | (4) | (5) | (6) | (7) | (8) | (9) | (10) | (11) | (12) | ||||
| 1 | 172353.98-340850.8 | 22.0 | 55.0 | 31.15 | 31.97 | 32.00 | 32.03 | 32.18 | 0.92 | S; AGN? | |||||
| 2 | 172358.42-340802.6 | 22.3 | 3.0 | 54.9 | 30.68 | 31.54 | 31.65 | 31.60 | 31.97 | 0.93 | 2MASS | ||||
| 51 | 172423.93-340816.2 | 21.4 | 7.1 | 54.3 | 30.76 | 31.22 | 31.23 | 31.35 | 31.44 | 1.07 | USNO 0558-0532169+2MASS | ||||
| 77 | 172428.94-341450.6 | 21.5 | 4.1 | 54.9 | 31.40 | 31.76 | 31.77 | 31.91 | 32.04 | 1.06 | Pis24-15 | ||||
| 78 | 172429.03-341813.5 | 21.9 | 2.7 | 54.7 | 30.88 | 31.32 | 31.37 | 31.46 | 31.72 | 0.27 | USNO 0556-0531216+2MASS | ||||
| 112 | 172433.04-341654.5 | 22.1 | 3.6 | 54.8 | 30.84 | 31.54 | 31.60 | 31.62 | 31.88 | 0.46 | USNO 0557-0528440+2MASS | ||||
| 140 | 172434.79-341318.0 | 21.9 | 7.0 | 55.0 | 31.27 | 31.96 | 32.00 | 32.04 | 32.20 | 0.71 | Pis24-11 | ||||
| 158 | 172436.63-341550.7 | 22.0 | 2.9 | 55.0 | 31.05 | 31.63 | 31.69 | 31.73 | 32.01 | 0.80 | USNO 0557-0528485+2MASS | ||||
| 188 | 172438.73-341202.9 | 22.0 | 3.3 | 54.8 | 30.96 | 31.54 | 31.60 | 31.64 | 31.89 | 0.66 | USNO 0557-0528507+2MASS | ||||
| 196 | 172438.98-341220.6 | 22.0 | 2.2 | 54.7 | 30.76 | 31.21 | 31.28 | 31.34 | 31.68 | 0.47 | USNO 0557-0528516+2MASS | ||||
| 203 | 172439.51-341317.9 | 21.8 | 4.8 | 54.5 | 30.79 | 31.34 | 31.37 | 31.45 | 31.61 | 0.69 | USNO 0557-0528522+2MASS | ||||
| 227 | 172440.67-341403.8 | 22.1 | 7.6 | 54.9 | 30.90 | 31.81 | 31.87 | 31.86 | 32.06 | 0.76 | 2MASS | ||||
| 243 | 172441.23-341138.6 | 22.0 | 3.3 | 54.8 | 30.91 | 31.50 | 31.55 | 31.60 | 31.85 | 1.39 | USNO 0558-0532303+2MASS | ||||
| 270 | 172441.92-341158.0 | 22.0 | 2.2 | 55.0 | 31.05 | 31.50 | 31.56 | 31.63 | 31.96 | 1.31 | USNO 0558-0532308+2MASS | ||||
| 284 | 172442.14-341155.9 | 22.0 | 6.9 | 54.8 | 30.92 | 31.69 | 31.74 | 31.76 | 31.94 | 0.60 | . | ||||
| 290 | 172442.28-341128.0 | 21.6 | 8.0 | 54.6 | 30.97 | 31.55 | 31.57 | 31.65 | 31.76 | 0.61 | 2MASS | ||||
| 319 | 172443.11-341215.9 | 21.8 | 5.6 | 54.6 | 30.87 | 31.46 | 31.49 | 31.56 | 31.71 | 1.10 | USNO 0557-0528600+2MASS | ||||
| 331 | 172443.28-341243.9 | 21.3 | 1.4 | 54.5 | 31.08 | 30.76 | 30.78 | 31.25 | 31.43 | 2.61 | P; Pis24-2+TYC-7383-421-1 | ||||
| 335 | 172443.34-341137.0 | 22.0 | 3.6 | 54.7 | 30.82 | 31.49 | 31.54 | 31.57 | 31.83 | 1.02 | . | ||||
| 344 | 172443.49-341156.9 | 22.1 | 1.2 | 56.2 | 32.19 | 32.26 | 32.36 | 32.53 | 33.11 | 1.57 | 2T; Pis24-1+TYC-7383-7-1 | ||||
| 372 | 172443.88-341139.3 | 21.8 | 5.2 | 54.8 | 31.07 | 31.65 | 31.68 | 31.75 | 31.91 | 1.40 | 2. from Pis24-19 | ||||
| 379 | 172443.95-341145.6 | 22.0 | 55.5 | 31.55 | 32.43 | 32.47 | 32.48 | 32.65 | 0.81 | S; 2MASS | |||||
| 399 | 172444.37-341039.8 | 22.0 | 4.1 | 54.9 | 31.04 | 31.74 | 31.79 | 31.82 | 32.05 | 0.95 | USNO 0558-0532335+2MASS | ||||
| 420 | 172444.72-341202.6 | 22.1 | 0.7 | 55.9 | 31.73 | 31.42 | 31.55 | 31.90 | 32.83 | 1.16 | VT; Pis24-17 | ||||
| 464 | 172445.78-340939.8 | 21.1 | 2.0 | 54.4 | 31.03 | 30.91 | 30.92 | 31.27 | 31.36 | 1.16 | Pis24-13 | ||||
| 471 | 172446.01-341407.3 | 21.9 | 5.7 | 55.2 | 31.35 | 32.06 | 32.10 | 32.13 | 32.32 | 0.73 | 2MASS | ||||
| 472 | 172446.02-340942.3 | 22.0 | 2.6 | 54.7 | 30.78 | 31.27 | 31.33 | 31.39 | 31.69 | 0.36 | . | ||||
| 493 | 172446.68-341233.4 | 22.0 | 3.5 | 54.7 | 30.88 | 31.46 | 31.51 | 31.56 | 31.80 | 0.70 | USNO 0557-0528655+2MASS | ||||
| 519 | 172447.56-341048.6 | 22.1 | 7.5 | 55.2 | 31.27 | 32.13 | 32.18 | 32.19 | 32.38 | 0.93 | 2MASS | ||||
| 530 | 172447.95-341735.3 | 21.4 | 3.1 | 54.4 | 30.98 | 31.17 | 31.18 | 31.38 | 31.49 | 0.33 | 2MASS | ||||
| 577 | 172450.15-341243.4 | 22.0 | 4.1 | 55.1 | 31.26 | 31.94 | 31.99 | 32.02 | 32.25 | 1.29 | USNO 0557-0528716+2MASS | ||||
| 612 | 172453.10-341525.6 | 22.2 | 1.8 | 54.9 | 30.81 | 31.32 | 31.42 | 31.44 | 31.90 | 0.83 | USNO 0557-0528750+2MASS | ||||
| 634 | 172454.31-341209.4 | 22.3 | 54.8 | 30.53 | 31.72 | 31.80 | 31.75 | 31.98 | 1.65 | S; 2MASS | |||||
| 649 | 172455.55-341631.3 | 22.1 | 4.3 | 55.1 | 31.08 | 31.86 | 31.92 | 31.93 | 32.18 | 0.59 | USNO 0557-0528794+2MASS | ||||
| 672 | 172457.87-341203.9 | 22.3 | 55.3 | 31.17 | 32.27 | 32.34 | 32.30 | 32.52 | 0.98 | S; 2MASS | |||||
| 692 | 172459.74-340958.7 | 22.5 | 2.2 | 55.2 | 30.46 | 31.57 | 31.77 | 31.60 | 32.17 | 0.49 | . | ||||
| 746 | 172508.76-341115.2 | 22.0 | 1.9 | 55.2 | 31.31 | 31.65 | 31.72 | 31.82 | 32.18 | 2.19 | P; MSX6C G353.2261+00.8295 | ||||
| 747 | 172508.83-341112.5 | 21.8 | 2.3 | 56.2 | 32.45 | 32.78 | 32.82 | 32.95 | 33.21 | 1.35 | VT; WR 93+TYC7383-162-1 | ||||
| 753 | 172510.93-340843.2 | 22.5 | 54.9 | 30.31 | 31.78 | 31.90 | 31.80 | 32.08 | 0.98 | S | |||||
| 770 | 172516.76-341211.3 | 22.0 | 3.8 | 54.7 | 30.92 | 31.52 | 31.57 | 31.62 | 31.84 | 0.74 | USNO 0557-0529090+2MASS | ||||
Note. — Column 1: X-ray source number. Column 2: IAU designation. Columns 3-5: Estimated column density, plasma energy, and the plasma emission measure. Columns 6-10: Observed and corrected for absorption X-ray luminosities, obtained from our spectral analysis §3.4. Columns 11: Reduced for the spectral fit.
| Source | Spectral Fitaa All fits were “wabs(apec)” in XSPEC and assumed solar abundances. | X-ray Luminositiesbb X-ray luminosities: s = soft band (0.5–2 keV); h = hard band (2–8 keV); t = total band (0.5–8 keV). Absorption-corrected luminosities are subscripted with a . Luminosities were calculated assuming a distance of 2.56 kpc. | Notescc S means the spectral fit is only used as a spline fit for a rough estimate of luminosity; actual fit values are unreliable. Some confidence intervals are missing since no error calculation is reported in XSPEC. | ||||||||||
|---|---|---|---|---|---|---|---|---|---|---|---|---|---|
| Seq | CXOU J | ||||||||||||
| # | (cm-2) | (keV) | (cm-3) | (ergs s-1) | |||||||||
| (1) | (2) | (3) | (4) | (5) | (6) | (7) | (8) | (9) | (10) | (11) | |||
| 3 | 172359.11-341217.6 | 22.0 | 4.8 | 53.9 | 30.01 | 30.73 | 30.78 | 30.81 | 31.02 | . | |||
| 8 | 172405.42-341257.5 | 22.7 | 10 | 54.7 | 29.59 | 31.60 | 31.76 | 31.61 | 31.89 | S | |||
| 9 | 172405.64-340710.0 | 21.0 | 1.8 | 53.9 | 30.62 | 30.38 | 30.39 | 30.82 | 30.86 | . | |||
| 12 | 172407.65-341751.9 | 22.3 | 0.5 | 55.0 | 30.36 | 30.04 | 30.25 | 30.53 | 31.93 | . | |||
| 15 | 172409.28-341224.3 | 22.5 | 2.7 | 54.9 | 30.30 | 31.41 | 31.58 | 31.45 | 31.92 | . | |||
| 19 | 172413.61-340921.8 | 21.5 | 2.9 | 54.0 | 30.53 | 30.74 | 30.76 | 30.95 | 31.08 | . | |||
| 20 | 172413.68-341451.8 | 22.2 | 1.5 | 54.4 | 30.24 | 30.67 | 30.79 | 30.80 | 31.36 | . | |||
| 29 | 172416.17-341526.6 | 22.4 | 2.3 | 54.7 | 30.30 | 31.19 | 31.34 | 31.24 | 31.73 | . | |||
| 30 | 172416.18-341311.3 | 21.6 | 1.9 | 54.1 | 30.49 | 30.55 | 30.58 | 30.82 | 31.05 | . | |||
| 35 | 172418.81-341204.7 | 22.1 | 1.3 | 54.4 | 30.43 | 30.55 | 30.65 | 30.79 | 31.37 | . | |||
Note. — Column 1: X-ray source number. Column 2: IAU designation. Columns 3-5: Estimated column density, plasma energy, and the plasma emission measure. Columns 6-10: Observed and corrected for absorption X-ray luminosities. The full table of 144 sources is provided in the electronic edition of the Journal.
| Source | Counterparts & Class | 2MASS Coordinates | 2MASS Colors & Magnitudes | Cautionary Flags | |||||||||||||
|---|---|---|---|---|---|---|---|---|---|---|---|---|---|---|---|---|---|
| Seq # | CXOU J | 2MASS | SIRIUS | HST | Flags | RA(J2000) | DEC(J2000) | QFLAG | Class | ||||||||
| (1) | (2) | (3) | (4) | (5) | (6) | (7) | (8) | (9) | (10) | (11) | (12) | (13) | (14) | ||||
| 1 | 172353.98-340850.8 | ||||||||||||||||
| 2 | 172358.42-340802.6 | R | 17 23 58.36 | -34 08 02.5 | 0.87 | 2.004 | 1.251 | 11.928 | AAA | 000 | |||||||
| 3 | 172359.11-341217.6 | R | 17 23 59.16 | -34 12 17.0 | 0.80 | 0.749 | 0.487 | 10.690 | AAA | 000 | |||||||
| 4 | 172401.20-340928.0 | R | 17 24 01.32 | -34 09 27.3 | 1.58 | 0.744 | 0.477 | 12.926 | UAA | 000 | |||||||
| 5 | 172402.27-341110.4 | H | |||||||||||||||
| 6 | 172403.19-341402.2 | R | 17 24 03.22 | -34 14 02.1 | 0.35 | 0.990 | 0.369 | 11.313 | AAA | 000 | |||||||
| 7 | 172403.64-340634.7 | R | 17 24 03.56 | -34 06 36.2 | 1.77 | 2.092 | 0.739 | 13.505 | DBA | ccc | |||||||
| 8 | 172405.42-341257.5 | H | |||||||||||||||
| 9 | 172405.64-340710.0 | F | 17 24 05.62 | -34 07 09.5 | 0.60 | 0.399 | 0.172 | 8.458 | AAA | 000 | |||||||
| 10 | 172406.70-341305.0 | HR | 17 24 06.64 | -34 13 04.9 | 0.74 | 2.319 | 1.208 | 13.316 | UCA | 000 | |||||||
Note. — Column 1: X-ray source number. Column 2: IAU designation. Columns 3-5: existence of ONIR counterparts; -counterpart. -no counterpart, -source is out of the field of view of the available images. Column 6: X-ray source classifications. See §5.5 for descriptions of the class designations. Column 7-9: 2MASS (J2000) coordinates and the offset between X-ray position and near-IR position in arcsec. Column 10-12: 2MASS ,, and measurements. Column 13: From Explanatory Supplement to the 2MASS All Sky Data Release (Cutri et al. 2003). 2MASS photometry quality flags with three characters: A = very high significance detection ( SNR); B = high significance detection ( SNR); C = moderate significance detection ( SNR); D = low significance detection; E = point spread fitting poor; F = reliable photometric errors not available; U = upper limit on magnitude (source not detected); X = source is detected but no valid brightness estimate is available. Column 14: From Explanatory Supplement to the 2MASS All Sky Data Release (Cutri et al. 2003). 2MASS confusion and contamination flags with three characters: 0 = source unaffected by artifacts; b = bandmerge confusion (possible multiple source); c = photometric confusion from nearby star; d = diffraction spike confusion from nearby star; p = persistence contamination from nearby star; s = electronic stripe from nearby star. The full table of 779 Chandra sources is available in the electronic edition of the Journal.
| Star | ONIR photometry | X-ray properties | ||||||||||||||
|---|---|---|---|---|---|---|---|---|---|---|---|---|---|---|---|---|
| IDaaIdentifications from Moffat & Vogt (1973) and Massey et al. (2001). | SpecTypebbSpectral types from Massey et al. (2001) and Walborn et al. (2002). Optical photometry from Massey et al. (2001). Bolometric luminosities from Massey et al. (2001) are recalculated using bolometric corrections from Heap et al. (2006) instead of Vacca et al. (1996). | ccUnits of RA are hours, minutes and seconds; units of DEC are degrees, arcminutes, and arcseconds. Coordinates are from the Catalogue of Stellar Spectral Classifications (Skiff 2005) and Massey et al. (2001). | ccUnits of RA are hours, minutes and seconds; units of DEC are degrees, arcminutes, and arcseconds. Coordinates are from the Catalogue of Stellar Spectral Classifications (Skiff 2005) and Massey et al. (2001). | bbSpectral types from Massey et al. (2001) and Walborn et al. (2002). Optical photometry from Massey et al. (2001). Bolometric luminosities from Massey et al. (2001) are recalculated using bolometric corrections from Heap et al. (2006) instead of Vacca et al. (1996). | bbSpectral types from Massey et al. (2001) and Walborn et al. (2002). Optical photometry from Massey et al. (2001). Bolometric luminosities from Massey et al. (2001) are recalculated using bolometric corrections from Heap et al. (2006) instead of Vacca et al. (1996). | bbSpectral types from Massey et al. (2001) and Walborn et al. (2002). Optical photometry from Massey et al. (2001). Bolometric luminosities from Massey et al. (2001) are recalculated using bolometric corrections from Heap et al. (2006) instead of Vacca et al. (1996). | ddInfrared photometry from 2MASS. | ddInfrared photometry from 2MASS. | ddInfrared photometry from 2MASS. | ddInfrared photometry from 2MASS. | eeVisual extinction from Bohigas et al. (2004) (). | Seq # ffACIS source number for X-ray detections. | gg is absorption corrected full-band luminosity (ergs s-1). is X-ray derived column density (cm-2). | gg is absorption corrected full-band luminosity (ergs s-1). is X-ray derived column density (cm-2). | bbSpectral types from Massey et al. (2001) and Walborn et al. (2002). Optical photometry from Massey et al. (2001). Bolometric luminosities from Massey et al. (2001) are recalculated using bolometric corrections from Heap et al. (2006) instead of Vacca et al. (1996). | NoteshhOther identifications from Neckel (1978). |
| Pis 24-1 | O3If* | 17 24 43.49 | -34 11 57.0 | 10.43 | 0.40 | 1.45 | 3.70 | 0.55 | 0.28 | 5.89 | 6.16 | #344 | 33.11 | 22.1 | 39.60 | HDE 319718=[N78] 35 |
| Pis 24-17 | O3III(f*) | 17 24 44.73 | -34 12 02.7 | 11.84 | 1.49 | 4.02 | 0.54 | 0.31 | 6.98 | 6.57 | #420 | 32.83 | 22.1 | 39.09 | [N78] 57 | |
| Pis 24-2 | O5.5V((f)) | 17 24 43.20 | -34 12 43.5 | 11.95 | 0.32 | 1.41 | 3.48 | 0.48 | 0.31 | 7.69 | 5.81 | #331 | 31.43 | 21.3 | 38.81 | |
| Pis 24-13 | O6.5V((f)) | 17 24 45.78 | -34 09 39.9 | 12.73 | 0.11 | 1.48 | 3.92 | 0.57 | 0.29 | 7.95 | 6.45 | #464 | 31.36 | 21.1 | 38.61 | [N78] 36 |
| Pis 24-16 | O7.5V | 17 24 44.45 | -34 11 58.8 | 13.02 | 1.60 | 4.57 | 0.59 | 0.49 | 7.37 | 7.35 | #407 | 31.90 | 22.0 | 38.60 | [N78] 58 | |
| Pis 24-3 | O8V | 17 24 42.30 | -34 13 21.5 | 12.75 | 0.24 | 1.41 | 3.46 | 0.52 | 0.30 | 8.47 | 5.79 | #293 | 31.17 | 21.0 | 38.57 | |
| Pis 24-15 | O8V | 17 24 28.86 | -34 14 50.3 | 12.32 | 0.14 | 1.27 | 3.29 | 0.45 | 0.24 | 8.35 | 5.54 | #77 | 32.04 | 21.5 | 38.63 | [N78] 46 |
| Pis 24-10 | O9V | 17 24 36.04 | -34 14 00.5 | 13.02 | 0.40 | 1.40 | 3.51 | 0.49 | 0.28 | 8.75 | 5.84 | #151 | 31.96 | 22.1 | 38.36 | |
| WR 93 | WC7+O7-9 | 17 25 08.85 | 34 11 12.5 | 10.68 | 0.70 | 1.42 | 3.65 | 0.50 | 0.67 | 5.87 | 5.86 | #747 | 33.21 | 21.8 | 39.97 | HD 157504=[N78] 52 |
| Pis 24-18 | B0.5V | 17 24 43.29 | -34 11 41.9 | 13.97 | 1.48 | 3.97 | 0.68 | 0.34 | 8.97 | 6.42 | #332 | 31.56 | 22.1 | 38.26 | ||
| Pis 24-12 | B1V | 17 24 42.27 | -34 11 41.2 | 13.88 | 0.38 | 1.47 | 3.38 | 0.51 | 0.21 | 9.78 | 5.56 | No | 38.05 | |||
| Pis 24-19 | B1V | 17 24 43.69 | -34 11 40.7 | 14.43 | 1.39 | 3.76 | 0.59 | 0.47 | 9.61 | 6.08 | No | 38.04 | ||||
| Pis 24-8iiNot included in Massey et al. (2001) spectroscopic classification sample. Tentative spectral types are inferred from color-magnitude diagram by de-reddening 2MASS photometric colors to the 1 Myr pre-MS isochrone. | O9? | 17 24 38.81 | -34 14 58.2 | 12.98 | 0.48 | 1.44 | 3.67 | 0.59 | 0.21 | 8.52 | 5.90 | #194 | 31.29 | 21.9 | ||
| Pis 24-7iiNot included in Massey et al. (2001) spectroscopic classification sample. Tentative spectral types are inferred from color-magnitude diagram by de-reddening 2MASS photometric colors to the 1 Myr pre-MS isochrone. | O9? | 17 24 47.81 | -34 15 16.5 | 13.46 | 0.58 | 1.68 | 4.10 | 0.61 | 0.33 | 8.42 | 6.61 | #527 | 30.28 | 22.2 | ||
| Pis 24-4iiNot included in Massey et al. (2001) spectroscopic classification sample. Tentative spectral types are inferred from color-magnitude diagram by de-reddening 2MASS photometric colors to the 1 Myr pre-MS isochrone. | O9-B0? | 17 24 40.39 | -34 12 05.9 | 13.93 | 0.53 | 1.43 | 3.88 | 0.60 | 0.32 | 9.14 | 6.49 | #225 | 30.45 | 22.0 | ||
| Pis 24-9iiNot included in Massey et al. (2001) spectroscopic classification sample. Tentative spectral types are inferred from color-magnitude diagram by de-reddening 2MASS photometric colors to the 1 Myr pre-MS isochrone. | O9-B1? | 17 24 39.29 | -34 15 26.4 | 14.26 | 0.40 | 1.40 | 3.48 | 0.49 | 0.29 | 10.00 | 5.81 | No | ||||
| Pis 24-11iiNot included in Massey et al. (2001) spectroscopic classification sample. Tentative spectral types are inferred from color-magnitude diagram by de-reddening 2MASS photometric colors to the 1 Myr pre-MS isochrone. | O9-B1? | 17 24 34.68 | -34 13 17.1 | 14.53 | 0.30:: | 1.57 | 3.79 | 0.66 | 0.30 | 9.79 | 7.03 | #140 | 32.20 | 21.9 | ||
| Seq # | CXOU J | Notes | ||||||
|---|---|---|---|---|---|---|---|---|
| (a) Stars with | ||||||||
| 140 | 172434.79-341318.0 | 0.660 | 0.296 | 9.789 | 32.04 | 21.9 | 7.0 | Pis 24-11 |
| 158 | 172436.63-341550.7 | 1.194 | 0.504 | 12.270 | 32.01 | 22.0 | 2.9 | V |
| 227 | 172440.67-341403.8 | 1.203 | 0.176 | 14.324 | 32.06 | 22.1 | 7.6 | flaring |
| 379 | 172443.95-341145.6 | -0.572: | 0.651: | 12.298 | 32.65 | 22.0 | 10.0: | HST |
| 399 | 172444.37-341039.8 | 1.063 | 0.957 | 10.972 | 32.05 | 22.0 | 4.1 | HST |
| 471 | 172446.01-341407.3 | 1.636 | 0.802 | 10.674 | 32.32 | 21.9 | 5.7 | … |
| 519 | 172447.56-341048.6 | 1.466 | 0.706 | 10.167 | 32.38 | 22.1 | 7.5 | V;HST |
| 577 | 172450.15-341243.4 | 1.240 | 0.509 | 10.788 | 32.25 | 22.0 | 4.1 | … |
| 649 | 172455.55-341631.3 | 1.286 | 0.510 | 12.064 | 32.18 | 22.1 | 4.3 | V |
| 672 | 172457.87-341203.9 | 1.331 | 0.576 | 10.256 | 32.52 | 22.3 | 10.0: | flaring |
| 692 | 172459.74-340958.7 | 32.17 | 22.5 | 2.2 | faint in SIRIUS | |||
| 746 | 172508.76-341115.2 | 32.18 | 22.0: | 1.9: | close to WR star | |||
| 753 | 172510.93-340843.2 | 32.08 | 22.0 | 3.8 | V; IR nebulosity | |||
| (b) Stars with | ||||||||
| 9 | 172405.64-340710.0 | 0.399 | 0.172 | 8.458 | 31.20 | 21.5 | 0.7 | IRAS 17207-3404 |
| 19 | 172413.61-341656.5 | 2.006 | 0.991 | 5.334 | 31.0 | 21.9 | 2.8 | MSX6C G353.0401+00.9326 |
| 120 | 172433.46-341344.9 | 0.602 | 0.333 | 9.649 | 31.29 | 21.7 | 10.0: | … |
| 194 | 172438.90-341459.0 | 0.587 | 0.208 | 8.519 | 31.29 | 21.9 | 1.7 | Pis24-8 |
| 225 | 172440.50-341206.3 | 0.595 | 0.315 | 9.138 | Pis24-4 | |||
| 312 | 172442.88-340911.6 | 0.931 | 0.502 | 9.231 | … | |||
| 527 | 172447.87-341517.0 | 0.608 | 0.327 | 8.424 | Pis24-7 | |||
| 539 | 172448.44-341743.7 | 0.468 | 0.270 | 8.026 | 31.14 | 21.5 | 0.9 | … |
| 643 | 172455.09-341111.5 | 0.798 | 0.427 | 8.866 | 32.15 | 22.4 | 0.6 | … |
| 654 | 172455.85-341234.0 | 1.297 | 0.952 | 8.389 | … | |||
| 694 | 172459.86-341610.8 | 1.645 | 1.304 | 8.137 | 31.34 | 22.1 | 2.5 | MSX6C G353.1413+00.8083 |
Note. — Column 1: X-ray source number. Column 2: IAU designation. Columns 3-5: 2MASS colors and magnitudes. Columns 6-8: X-ray luminosities (0.5–8.0 keV) corrected for absorption, derived column densities, and thermal plasma energy obtained from our spectral analysis. Columns 9: Related notes: ACIS source number; V=Variable lightcurves; HST=HST counterparts found; Other catalog names. Stars in the top panel are selected from X-ray criteria, and those in the bottom panel are selected from infrared criteria. Missing , , and values mean that the source has net counts.
| Seq # | CXOU J | aaThese quantities assume a cluster age of 1 Myr and kpc. For early B stars, and (estimated visual extinction and mass) are especially dependent on the age and distance assumptions (Figure 7). | aaThese quantities assume a cluster age of 1 Myr and kpc. For early B stars, and (estimated visual extinction and mass) are especially dependent on the age and distance assumptions (Figure 7). | bb marks significant -band excess derived from high quality 2MASS photometry where near-IR color excess is larger than , the uncertainty in color index. | |||
|---|---|---|---|---|---|---|---|
| (mag) | (mag) | (mag) | (mag) | () | (mag) | ||
| 2 | 172358.42-340802.6 | 14.99 | 13.16 | 11.93 | 18 | 13 | |
| 3 | 172359.11-341217.6 | 11.86 | 11.16 | 10.69 | 8 | 14 | |
| 6 | 172403.19-341402.2 | 12.60 | 11.67 | 11.31 | 10 | 13 | |
| 12 | 172407.65-341751.9 | 14.32 | 13.03 | 12.46 | 8 | 3 | |
| 18 | 172413.61-340921.8 | 13.51 | 12.65 | 12.34 | 4 | 3 | |
| 20 | 172413.68-341451.8 | 13.12 | 12.13 | 11.77 | 7 | 4 | |
| 29 | 172416.17-341526.6 | 13.88 | 12.28 | 11.45 | 16 | 16 | |
| 35 | 172418.81-341204.7 | 14.80 | 13.64 | 13.04 | 6 | 2 | |
| 38 | 172420.25-341310.7 | 13.90 | 12.54 | 11.88 | 14 | 12 | |
| 45 | 172421.75-341539.4 | 15.40 | 13.55 | 12.82 | 15 | 4 | |
| 156 | 172436.45-341236.7 | 13.30 | 12.32 | 11.57 | 5 | 3 |
Note. — Column 1: X-ray source number. Columns 2: IAU designation. Columns 3-5: 2MASS -band magnitudes. Columns 6-7: Visual extinction and mass estimated from de-reddened location along the standard interstellar reddening vector to the 1 Myr pre-MS isochrone in the 2MASS color-magnitude diagram, assuming a distance kpc. Column 8: Flag of significant -band excess. The full table of 100 Chandra sources is available in the electronic edition of the Journal.
| Seq # | CXOU J | CriteriaaaSelection criteria: I.– keV; II.– cm-2. The values shown here are rounded. | (cm-2)bbColumn density derived from spectral fitting. | (keV)ccMedian photon energy of the X-ray source. | NotesddRelated notes: V=variable lightcurves; VV=flaring; 2MASS=2MASS counterparts found. |
|---|---|---|---|---|---|
| 8 | 172405.42-341257.5 | I;II | 22.7 | 3.9 | |
| 15 | 172409.28-341224.3 | I | 22.5 | 3.1 | V;2MASS |
| 61 | 172426.47-341850.9 | I | 22.5 | 3.3 | |
| 142 | 172434.95-340533.3 | I;II | 23.2 | 4.7 | |
| 569 | 172449.82-341455.6 | I | 22.4 | 3.4 | |
| 598 | 172451.90-341331.3 | I;II | 22.6 | 3.1 | 2MASS |
| 599 | 172451.95-341513.0 | II | 22.6 | 2.0 | 2MASS |
| 634 | 172454.31-341209.4 | I | 22.3 | 3.1 | VV;2MASS |
| 664 | 172456.97-341651.8 | II | 22.6 | 2.1 | 2MASS |
| 692 | 172459.74-340958.7 | II | 22.5 | 2.9 | |
| 693 | 172459.85-341302.9 | II | 22.5 | 2.8 | 2MASS |
| 702 | 172501.09-341404.6 | I;II | 22.7 | 3.0 | |
| 713 | 172502.54-341549.7 | I;II | 22.7 | 4.1 | |
| 728 | 172504.93-340410.5 | I;II | 22.6 | 3.9 | e |
| 753 | 172510.93-340843.2 | I;II | 22.5 | 3.5 | VV;f |
| 775 | 172519.23-341356.6 | I;II | 22.8 | 3.7 |
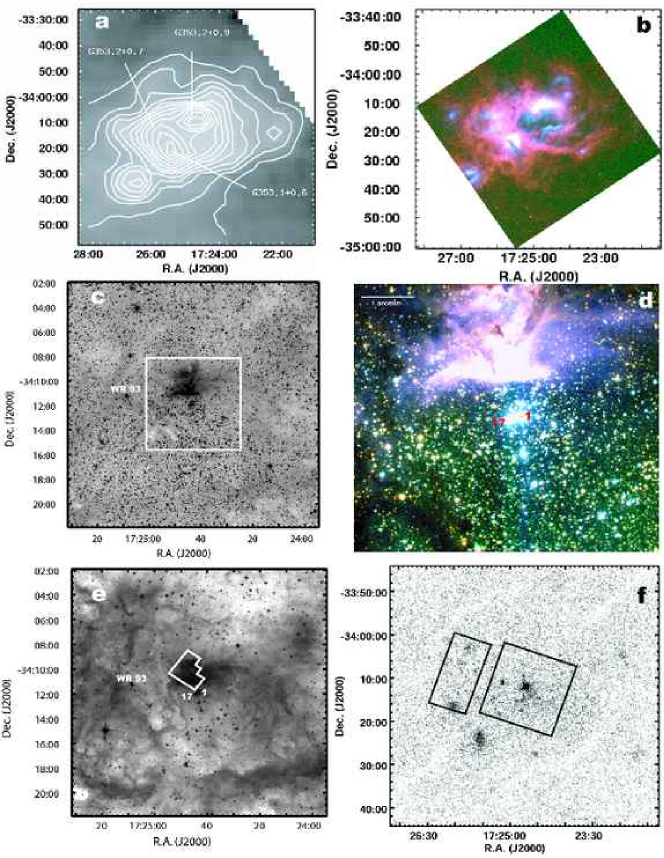
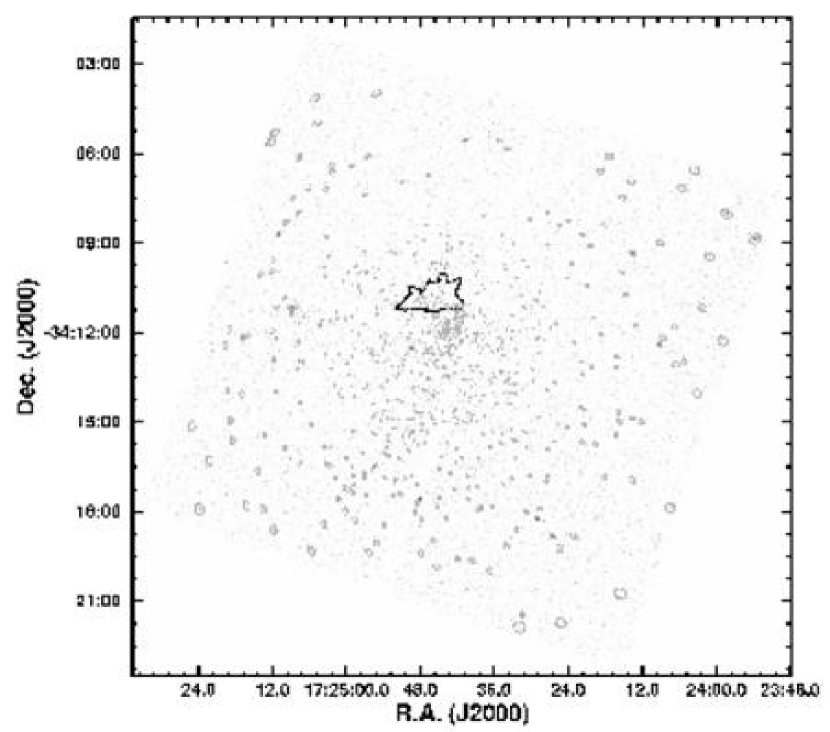
![[Uncaptioned image]](/html/astro-ph/0609304/assets/x3.png)
Fig. 2. — Continued.
![[Uncaptioned image]](/html/astro-ph/0609304/assets/x4.png)
Fig. 2. — Continued.