∎
Nizhniy Arkhyz, Karachaevo-Cherkessia, Russia, 369167
22email: karpov@sao.ru 33institutetext: A. Biryukov 44institutetext: Sternberg Astronomical Institute of MSU,
13 Universitetsky pr., Moscow, 119992, Russia 55institutetext: M. Redfern & A. Shearer 66institutetext: National University of Ireland, Galway,
University Road, Galway, Ireland
Short time scale pulse stability of the Crab pulsar in the optical band††thanks: This work has been supported by the Russian Foundation for Basic Research (grant No 04-02-17555), Russian Academy of Sciences (program ”Evolution of Stars and Galaxies”), by the Russian Science Support Foundation, and by INTAS (grant No 04-78-7366).
Abstract
The fine structure and the variations of the optical pulse shape and phase of the Crab pulsar are studied on various time scales. The observations have been carried out on 4-m William Hershel and 6-m BTA telescopes with APD photon counter, photomultiplier based 4-channel photometer and PSD based panoramic spectrophotopolarimeter with 1s time resolution in 1994, 1999, 2003 and 2005-2006 years. The upper limit on the pulsar precession on Dec 2, 1999 is placed in the 10 s - 2 hours time range. The evidence of a varying from set to set fine structure of the main pulse is found in the 1999 and 2003 years data. No such fine structure is detected in the integral pulse shape of 1994, 1999 and 2003 years.
The drastic change of the pulse shape in the 2005-2006 years set is detected along with the pulse shape variability and quasi-periodic phase shifts.
Keywords:
methods: data analysis pulsars: general objects: PSR B0531+21pacs:
97.60.Jd 97.60.Gb 95.75.Wx1 Introduction
Over the last 30 years the Crab pulsar has been extensively studied. The reasons for it are clear – it is the brightest pulsar seen in optics, it is nearby and young. However, the post popular groups contemporary theories of the Crab high-energy emission, the “polar cap” (Daugherty & Harding, 1996) and “outer gap” (Cheng et al., 2000) ones, can’t explain the whole set of observational data.
One of the main properties of the Crab emission is the very high stability of its optical pulse shape despite the secular decrease of the luminosity, related to the spin rate decrease (Pacini, 1971; Nasuti et al., 1996).
At the same time the pulsars in general and the Crab itself are unstable. The instabilities manifest itself as a glitches, likely related to the changes of the neutron star crust, timing noise, powered by the collective processes in the superfluid internal parts of it, magnetospheric instabilities, results of the wisps around the pulsar, precession, et al. All these factors may influence the optical pulse structure and change it on various time scales, both in periodic and stochastic way.
However, it has been found early that the variations of the Crab optical light curve, in contrast with the radio ones, are governed by the Poissonian statistics (Kristian et al., 1970). A number of observations show the absence of non-stationary effects in the structure, intensity and the duration of the Crab optical pulses, and the restrictions on the regular and stochastic fine structure of its pulse on the time scales from 3s to 500s (Beskin et al., 1983; Percival et al., 1993), the fluctuations of the pulse intensity (Kristian et al., 1970).
Along with the increase of the observational time spans and the accuracy of measurements the small changes of the optical pulse intensity, synchronous with the giant radio pulses, have been detected (Shearer et al., 2003). Also, the evidence for the short time scale precession of the pulsar has been detected by studying its optical light curve (Cadez et al., 2001).
All this raises the importance of the monitoring of the Crab optical emission with high time resolution.
2 Observations
| Date | Telescope | Instrument | Duration, sec | Spectral range |
|---|---|---|---|---|
| Dec 7, 1994 | BTA, Russia | Four-color photometer | 2400 | U+B+V+R |
| with photomultiplier | ||||
| Dec 2, 1999 | WHT, Canary Islands | Avalanche photo-diode | 6600 | R |
| Nov 15, 2003 | BTA, Russia | Avalanche photo-diode | 1800 | R |
| Dec 29, 2005 - | BTA, Russia | Panoramic spectro-polarimeter | 48000 | 4000 - 7000 A |
| Jan 3, 2006 | with position-sensitive detector |
We analyzed the sample of observational data obtained by our group over the time span of 12 years on different telescopes. The details of observations are summarized in Table 2. The equipment used were four-color standard photometer with diaphragms based on photomultipliers, fast photometer with avalanche photo-diodes (Shearer et al., 2003) and panoramic spectro-polarimeter based on position-sensitive detector (Debur et al., 2003; Plokhotnichenko et al., 2003). All devices provide the 1s time resolution.
For each data set the list of photon arrival times has been formed. They have been processed in the same way by using the same software to exclude the systematic differences due to data analysis inconsistencies. Photon arrival times have been corrected to the barycenter of the Solar System using the adapted version of axBary code by Arnold Rots. The accuracy of this code has been tested with detailed examples provided by Lyne et al. (2005) and is found to be better than 2s.
The barycentered photon lists then have been folded using both Jodrell-Bank radio ephemerides pjb_ephem and our own fast-folding based method of timing model fitting.
The accuracy of timing model is proved to be better than at least several microseconds (see Figure 1), which permits to fold the light curve with 5000 bin (6.6 s) resolution.
3 Phase stability


We performed the search for timing model residuals using two longest continuous data sets of 1999 and 2005-2006 years. The data has been divided into the number of subsets of fixed length and they have been folded separately using the same base epoch. Then the sample light curves have been cross-correlated with the standard one (which has been derived for each set separately by folding the whole data) and its phase shift have been derived by fitting the maximum of the cross-correlation function with the Gaussian. The results for 1999 year set are shown in Figure 1. No evidence for significant deviations from zero is seen, the phase is consistent with the Gaussian noise with 4.1s rms in the 10 s - 2 hr time range.
The data of the last set of 2005-2006 years, however, show the significant quasi-periodic variations with rms amplitude. The characteristic time scale of the variations is estimated to be roughly d.
4 Pulse shape
Due to the presence of significant residuals relative to the timing model the pulse profile during the observations of 2005-2006 years can’t be derived by folding the whole data set directly. Instead, we divided the data set into the one-hour segments and folded them separately applying the time shift corrections to compensate the phase residuals. The intrinsic phase shift inside each block is less than , so the folding with 5000 bins is possible. The folded light curves have been co-added.
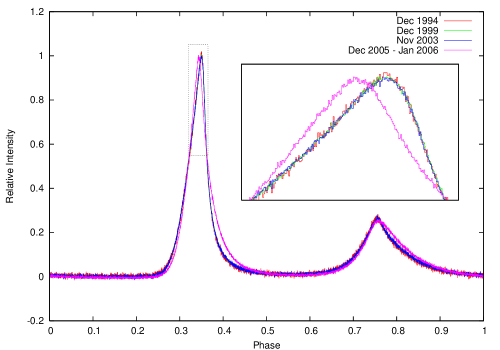
All the other data has been folded directly and shifted in phase to the same pulse position for the ease of comparison. All pulse profiles are shown in Figure 3, with the off-pulse emission subtracted and pulse height scaled to the same value.
The profiles of 1994, 1999 and 2003 years are in a perfect agreement with each other. The profile of 2005-2006 years, however, deviates from them significantly – the pulse remains of the same FWHM while its skewness is much smaller, and its shape is nearly symmetric.
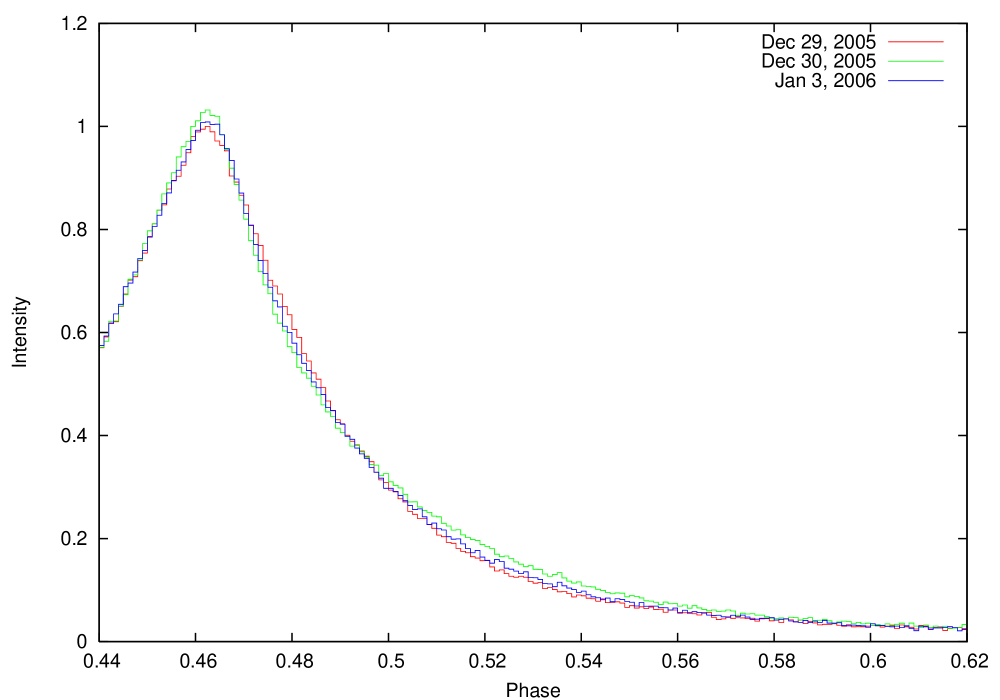
We folded the data of this set for each of three observational nights separately using the same method. These profiles are shown in Figure 4. There is the significant variation of its shape from night to night. Unfortunately the low amount of data available do not permit to track the profile shape change inside each night and check whether it is smooth or whether the shape is correlated with the timing residuals.
5 Pulse fine structure


For the first three observational set where the pulse profile is stable we performed the search for the fine structure of the main pulse. The data sets has been reduced to the same phase base point with precision better than half of the phase bin (less than 3.3s) and the cumulative light curve has been computed. The peak region of it is shown on Figure 5. No statistically significant deviations from the smooth peak shape is seen. However, light curves of 1999 and 2003 years data sets alone (plotted on Figure 6) each show the evidence of fine structure on the level of 3-5 sigma (roughly 1 % of the intensity) with typical duration of 10-30 s. Such details may give an evidence of coherent generation of optical emission, if the emission generation region is deep enough (deeper than 0.1 of light cylinder radius), due to brightness temperature exceedes K.
6 Discussion
The results of the last data set differs significantly from all previous results. We studied carefully the possibility of its being the result of some hardware or data processing problem.
The data of last set has been acquired using the panoramic spectro-polarimeter based on the position-sensitive photon counter (Debur et al., 2003; Plokhotnichenko et al., 2003) in low-resolution spectral mode. There is no difference of the pulse profile in different spectral bands (derived using different parts of the spectrum detected). The detector behaviour is proved to be linear in the flux range used. The data acquisition system, “Quantochron 4-48”, which records the time of arrival of the detected photons, has been checked for short time scale stability by recording the signal from the stationary 100-Hz generator. It has been processed and folded in the same way as a pulsar one (passing the unnecessary barycentering step). It shows no distortion of the signal shape larger than 1s. Large scale timing stability of acquisition system is ensured by means of 1 Hz and 10 kHz frequency signals from GPS receiver. The barycentering correction code passed the tests provided in Lyne et al. (2005) with the accuracy of 1 s. The correctness of the radio ephemerides has been checked by performing the timing model fitting using our own software, the results of phase shift and folding analysis agree with ones based on the radio data. There is no small time scale (of order of 100 seconds and larger) changes of the pulse profile inside the set with amplitude comparable to the difference between the last set and previous ones.
Taking into account all these arguments we may conclude that the pulse profile change and quasi-periodic phase shifts detected in this observational set is most likely not related to the hardware or software problems of the equipment used.
The detection of the variations of both the pulse arrival times and its shape strongly supports the geometrical interpretation of the effect. It may be described as a quasi-periodic change of the pulsar beam orientation due to the strong precession commenced suddenly before the observations, but after the previous set. It may be related to the very strong glitch of the Feb-Mar 2004, or other recent change in the neutron star state (Lyne et al., 2005)
7 Conclusions
We analyzed the data of several sets of optical observations with high temporal resolution of the Crab pulsar performed by our group over the 12 last years.
No evidence for short time scale precession (like 60-sec free precession discovered in Cadez et al. (2001) ) is detected on the level of - s-1 pulsar frequency variation on 10 s - 2 hours time scale on Dec 2, 1999 (see Figure 1), which corresponds to the precession wobble angle to be less than approximately . Also, no signatures of short time scale timing noise is seen in this data set.
No significant fine structure is detected in the integral pulse profile of 1994, 1999 and 2003 years data set (see Figure 5), however, each data set alone show the evidence of fine structure on the level of 3-5 sigma, which may be related to its instability on the time scale of years along with the stability of the pulse shape on the same scale.
We discovered the significant change of the time-averaged Crab pulse profile in the Dec 2005 - Jan 2006 set of observations. The pulse profile also shows the variations between the nights. Also, the quasi-periodic phase shifts in respect to the second-order timing solution (up to second frequency derivative) has been detected in the data with amplitude of s and characteristic time scale of 0.7 days. We have not found any hardware or software issue able to mimic such pulsar behaviour. These results may be interpreted as a geometric effects due to the Crab precession suddenly started between our observations of 2003 and 2005-2006 years.
References
- Beskin et al. (1983) Beskin G. M., Neizvestnyi S. I., Pimonov A. A. et al. Sov.Astron.Lett 9, 148 (1983)
- Cadez et al. (2001) Cadez A., Vidrih S., Galieie M. et al. A&A, 366, 930 (2001)
- Cheng et al. (2000) Cheng K.S., Ruderman M. & Zhang L. ApJ 537, 964 (2000)
- Daugherty & Harding (1996) Daugherty J.K. & Harding A.K. ApJ 458, 278 (1996)
- Debur et al. (2003) Debur V., Arkhipova T., Beskin G. et al. Nuclear Instruments and Methods in Physics Research, A 513, 127 (2003)
- Jordan (2006) Jordan C.A.: Private communication. (2006)
- Kristian et al. (1970) Kristian J., Visvanathan N., Vestphal J.A. et al. ApJ 162, 475 (1970)
- Lyne et al. (2005) Lyne A.G., Jordan C.A. & Roberts M.E. Crab Monthly Ephemeris available on http://www.jb.man.ac.uk/ pulsar/crab.html (2005)
- Nasuti et al. (1996) Nasuti F.P., Mignani R., Caraveo P.A. et al. A&A 314, 849 (1996)
- Pacini (1971) Pacini F. ApJ 163, 17 (1971)
- Percival et al. (1993) Percival J.W., Biggs J.D., Dolan J.F. et al. ApJ 407, 276 (1993)
- Plokhotnichenko et al. (2003) Plokhotnichenko V., Beskin G., Debur V. et al. Nuclear Instruments and Methods in Physics Research, A 513, 167 (2003)
- Shearer et al. (2003) Shearer A., Stappers B., O’Connor, P. et al. Science, 301, 493 (2003)