11email: guedel@astro.phys.ethz.ch 22institutetext: Columbia Astrophysics Laboratory, Mail Code 5247, 550 West 120th Street, New York, NY 10027, USA 33institutetext: CASA, 389, University of Colorado, Boulder, CO 80309-0389, USA 44institutetext: Osservatorio Astrofisico di Arcetri, Largo Enrico Fermi, 5, I-50125 Firenze, Italy 55institutetext: Laboratoire d’Astrophysique de Grenoble, Université Joseph Fourier - CNRS, BP 53, F-38041 Grenoble Cedex, France
X-rays from jet-driving protostars and T Tauri stars
Abstract
Aims. We study jet-driving protostars and T Tau stars to characterize their X-ray emission. We seek soft spectral components that may be due to shock emission, and search for soft, shock-induced emission displaced from the stellar position.
Methods. We study two stellar samples, the first consisting of lightly absorbed T Tau stars with strong jets, the other containing protostars with disks seen nearly edge-on. The former sample was observed in the XMM-Newton Extended Survey of the Taurus Molecular Cloud (XEST), while Chandra archival data provided observations of the latter.
Results. We confirm the previously identified peculiar spectrum of DG Tau A and find similar phenomenology in GV Tau and DP Tau, suggesting a new class of X-ray spectra. These consist of a lightly absorbed, very soft component and a strongly absorbed, very hard component. The latter is flaring while little variability is detected in the former. The absorption of the harder component is about an order of magnitude higher than expected from the optical extinction assuming a standard gas-to-dust mass ratio. For the absorbed protostars, only the hard, stellar X-ray component is found.
Conclusions. The flaring hard component represents active coronal emission. Its strong absorption is attributed to mass inflow from the accretion disk. The optical extinction is small because the dust has sublimated at larger distances. The weakly absorbed soft component cannot originate from the same location. Because the stars drive strong jets, we propose that the X-rays are generated in shocks in the jets. We find that for the three peculiar X-ray sources, the luminosity of the soft component roughly scales with the equivalent width of the [O I] 6300 line formed in the jets, and with the mass outflow rate. In the more strongly obscured protostars, the soft component is entirely absorbed, and only the hard, coronal component penetrates the envelope or the near-edge-on disk.
Key Words.:
Stars: coronae – Stars: formation – Stars: pre-main sequence – X-rays: stars – Stars: individual: DG Tau AB, GV Tau AB, DP Tau, FS Tau AB, HH 34, HH 1111 Introduction
Pre-main sequence stars show various signs of accretion and outflow, such as circumstellar disks detected at radio and millimeter wavelengths (e.g., Simon et al. 2000), molecular outflows observed in molecular lines (e.g., Bachiller 1996 for a review), and accompanying optical (e.g., Hirth et al. 1997; Eislöffel & Mundt 1998) and radio jets (e.g., Anglada 1995). The most visible manifestation of outflows are the optically visible jets that may be excited close to the star, in internal shocks along the mass stream, or at distances up to several parsecs as the fast stream encounters the interstellar medium where it shock-ionizes the gas in Herbig-Haro objects (for a review of Herbig-Haro flows, see Reipurth & Bally 2001). Under ideal circumstances (low extinction, strong ionization), jets can be identified at distances as close as 0.1″ to the star (Bacciotti et al., 2002). The same compact jets are also routinely detected at radio wavelengths, where the emission mechanism is thought to be bremsstrahlung from the shock-heated gas (Rodríguez, 1995; Anglada, 1995). Radio brightness temperatures suggest overall gas temperatures of order K. This picture is ambiguous, however, as a number of non-thermal jets have been suggested from radio polarization or synchrotron-like spectral shapes (Yusef-Zadeh et al., 1990; Curiel et al., 1993; Hughes, 1997; Ray et al., 1997; Smith et al., 2003; Loinard et al., 2005). Magnetic fields may thus play a role not only in the launching of jets, but in their propagation as well.
Two principal families of models for the jet-launching mechanism have been proposed: The magnetocentrifugal mechanism (Blandford & Payne, 1982; Königl & Pudritz, 2000) posits that outflows are launched on the disk along outward-bent, open magnetic fields owing to the increasing centrifugal forces along the field lines that are co-rotating with their disk footpoints. In contrast, the X-wind model (Shu et al., 2000) assumes that outflows are launched from magnetized regions between the star and the disk. Magnetohydrodynamic simulations show that magnetic reconnection and subsequent plasmoid ejection may lead to field-aligned outflows (Hayashi et al., 1996).
Accretion and outflow processes are prone to producing X-rays, given that shocks with shock jump velocities of order several hundred km s-1 are possible and sometimes observed. Accretion onto the star essentially extracts gravitational energy and transforms it into thermal energy through shocks. The relevant theory has been presented by Ulrich (1976), Calvet & Gullbring (1998) and Lamzin (1999). Material falling along magnetic fields toward the stellar surface with nearly free-fall velocity, , develops strong shocks near or within the photosphere, heating plasma to temperatures of [K] where and are the stellar mass and the stellar radius, respectively, in solar units, is the mean molecular weight, is the proton mass, and is the Boltzmann constant. For T Tau stars, heating to a few MK is thus entirely plausible (as, e.g., proposed for TW Hya, Kastner et al. 2002), but the temperatures in excess of 10 MK that often dominate X-ray emitting plasmas in T Tau stars (Skinner et al., 2003; Preibisch et al., 2005) cannot be due to accretion shocks. Rather, high electron temperatures in pre-main sequence stars are conventionally attributed to magnetized plasma trapped in corona-like or large-scale “magnetospheric” magnetic fields around the stars.
Shocks also form in jets and outflows, in particular in Herbig-Haro (HH) objects. The relevant theory and a simple model have been discussed by Raga et al. (2002). The strong-shock temperature can be expressed as K (for fully ionized gas) where is the shock speed relative to a target in units of 100 km s-1. Jet speeds are typically of order km s-1 (Eislöffel & Mundt, 1998; Anglada, 1995; Bally et al., 2003), allowing for shock speeds of similar magnitude. If a flow shocks a standing medium at 400 km s-1, then MK.
Observations have explicitly demonstrated that faint, soft X-ray emission originates from some HH objects (Pravdo et al., 2001, 2004; Favata et al., 2002; Tsujimoto et al., 2004; Pravdo & Tsuboi, 2005; Grosso et al., 2006). Bally et al. (2003) used a Chandra observation to show that X-rays form within an arcsecond of the protostar L1551 IRS-5 while the star itself is too heavily obscured to be detected. As this example illustrates, the jet-launching region of powerful protostellar jets is usually inaccessible to optical, near-infrared or X-ray studies of protostellar outflow sources due to excessive absorption. However, there are a number of optically-revealed, classical T Tau stars that drive appreciable jets and outflows (Hirth et al., 1997). Their jets were initially dubbed “micro-jets” although recent studies have shown them to reach parsec scales and the mass loss rates compete with those of more embedded sources (McGroarty & Ray, 2004).
One of the most prominent examples, the classical T Tau star DG Tau A, has recently obtained scrutiny with high-resolution Chandra X-ray observations. Güdel et al. (2005) discovered a new type of X-ray spectrum in which a lightly absorbed spectral component from a rather cool (2–3 MK) plasma is complemented by a strongly absorbed component from a very hot (20–30 MK) plasma. The latter was interpreted as being related to the usual coronal/magnetospheric source often seen in T Tau stars, subject to some excess absorption. In the light of this interpretation, the cooler plasma is unlikely to be located close to the magnetospheric component because the source of absorption would likely affect it as well. The strong jets and high mass-loss rates of DG Tau A motivated the suggestion that the soft X-rays are produced in shocks in the acceleration region of the jet (the “base” of the jet), which is unresolved in Chandra or XMM-Newton images. Complementary evidence was seen in faint and very soft X-ray emission along the optical jet, outside the stellar point-spread function and co-spatial with a strong bow-shock feature seen in the optical. The spectral distribution of the counts in the jet source was reminiscent of the count distribution in the soft stellar component. A spectrum requiring two absorbers was also reported for a proplyd in the the Orion Nebula Cluster, with a variable hard component but a constant soft component (Kastner et al., 2005). Skinner et al. (2006) have detected a similar two-component spectrum in the strongly accreting FU Ori, the prototype of FU Ori-type stars. The cooler, weakly absorbed component, however, reached temperatures more common to T Tau stars ( MK) and was therefore identified with a coronal component, while the very hot component was again strongly absorbed.
The recently conducted XMM-Newton Extended Survey of the Taurus Molecular Cloud (XEST henceforth; Güdel et al. 2006) offers unique access to numerous stellar objects in the Taurus Molecular Cloud (TMC). It covers most stellar concentrations in the TMC molecular filaments and offers high-quality spectra and light curves for any “typical” T Tau star in the field of view. XEST also covers a number of well-studied jet-driving T Tau stars and protostars. The observations confirm the initial discovery of the anomalous DG Tau A and add substantial evidence for a jet-related origin. We find further clear examples of these two-absorber X-ray sources (TAX sources henceforth). The present paper describes these new observations and presents a detailed discussion on the possible origin of the X-ray emission. For a comparison, we also present X-ray spectra of jet-driving sources that are deeply absorbed by their thick circumstellar disks seen nearly edge-on. The soft component, if present, would thus be absorbed unless it is displaced sufficiently from the star to make it separate from the stellar X-ray image. These complementary data are based on high-resolution Chandra observations.
| Parameter | DG Tau A | GV Tau | DP Tau | CW Tau |
|---|---|---|---|---|
| XEST number | 02-022 | 13-004 | 10-045 | 20-046 |
| ObsID (XMM-Newton) | 0203540201 | 0203541301 | 0203542201 | 0203542001 |
| Start time (UT) | 2004-08-17 06:08:10 | 2004-08-25 11:11:23 | 2005-03-05 05:56:38 | 2004-09-12 07:04:43 |
| End time (UT) | 2004-08-17 17:32:46 | 2004-08-25 19:59:19 | 2005-03-05 14:44:30 | 2004-09-12 15:52:37 |
| Exposure time (s) | 41076 | 31676 | 31672 | 31674 |
| Boresight RA (J2000.0) | 04h 27m 19.6s | 04h 29m 52.0s | 04h 42m 20.9s | 04 14 12.9 |
| Boresight (J2000.0) | 28 12 12 | |||
| Star: RA (J2000.0)a | 04h 27m 04.70s | 04h 29m 23.73s | 04h 42m 37.70s | 04h 14m 17.00s |
| Star: (J2000.0)a |
| Parameter | DG Tau B | FS Tau B | HH 34 IRS | HH 111 IRS |
|---|---|---|---|---|
| XEST number | C3-2 | 11-054 = C2-1 | … | … |
| ObsID (Chandra) | 4487 | 4488 | 4489 | 4490 |
| Start time (UT) | 2004-01-11 02:58:51 | 2003-11-08 12:57:58 | 2003-12-05 08:59:23 | 2004-11-21 17:05:50 |
| End time (UT) | 2004-01-11 11:52:21 | 2003-11-08 21:56:34 | 2003-12-05 17:38:31 | 2004-11-22 01:36:42 |
| Exposure time (s) | 29717 | 29674 | 28590 | 28795 |
| Boresight RA (J2000.0) | 04h 27m 02.3s | 04h 22m 00.2s | 05h 35m 32.07s | 05h 51m 54.97s |
| Boresight (J2000.0) | ||||
| Star: RA (J2000.0)b | 04h 27m 02.55s | 04h 22m 00.70s | 05h 35m 29.84s | 05h 51m 46.31s |
| Star: (J2000.0)b |
2 Targets and observations
2.1 Data reduction
The observations reported here were obtained as part of the XEST project and have been subject to a data reduction procedure that is described in detail in Güdel et al. (2006). In brief, the XMM-Newton (Jansen et al., 2001) data have been obtained using all three EPIC cameras (MOS and PN; Turner et al. 2001, Strüder et al. 2001), with the medium filter inserted. We applied extraction regions that maximize the signal-to-noise ratio; their radii amount to 22″, 15″, 13″, and 12″ for our targets DG Tau A, GV Tau, DP Tau, and CW Tau, respectively. Standard response matrices distributed by the XMM-Newton project were used, and ancillary response files were created for each source. An observing log is given in Table 1. For DG Tau A and GV Tau, we also extracted the simultaneous light curves from the Optical Monitor (OM; Mason et al. 2001). The OM data reduction is described in Audard et al. (2006).
For spectral analysis, we used the XSPEC software package (Arnaud, 1996). We applied the vapec thermal collisional ionization equilibrium models that include emission lines and bremsstrahlung continua, combined with the photoelectric absorption model, wabs, based on absorption cross sections by Morrison & McCammon (1983).
The Chandra exposures described here were reduced using standard strategies for ACIS. The observations of DG Tau AB, FS Tau AB (= Haro 6-5 AB), HH 34, and HH 111 used the “Very Faint Mode” of ACIS to minimize background contributions, while the GV Tau (= Haro 6-10 AB) observation used the “Faint Mode”. The data were reduced in CIAO vers. 3.0.2 following the standard analysis threads111http://cxc.harvard.edu/ciao/guides/. These procedures included corrections for charge transfer inefficiency and afterglow, and selection of good time intervals. Spectra were extracted from level 2 event files with specextract which also produces response matrices and ancillary response files.
2.2 Jet-driving T Tau stars
The XEST survey contains several jet-driving, optically revealed classical T Tau stars (Hirth et al., 1997), in particular DG Tau A, GV Tau AB = Haro 6-10 AB, DP Tau, CW Tau, XZ Tau, UZ Tau, and DD Tau. One further object, HN Tau, was observed with the Chandra HRC-I but was recorded only as a very faint source (Güdel et al., 2006).
At least three XEST targets, namely DG Tau A, GV Tau A, DP Tau, and possibly a fourth, CW Tau, reveal the same anomalous spectral phenomenology previously described for the first object (Güdel et al., 2005). Further, UZ Tau reveals a peculiarly soft spectrum, while DD Tau shows a very hot source that is subject to an anomalously high photoelectric absorption, judged from the visual extinction which is relatively small (Güdel et al., 2006). The present paper concentrates on a discussion of the first three unambiguous cases.
| Parameter | DG Tau A | Refa | GV Tau A | Refa | GV Tau B | Refa | DP Tau | Refa | CW Tau | Refa |
| Spectral type | K5-M0 | 4, 5, 7, 8, 15 | K3-7 | 4, 8 | … | … | M0-0.5 | 5, 8 | K3 | 7 |
| YSO class | II | 4, 8 | I | 4, 6, 8 | I | … | II | 4, 6, 8, 18 | II | 4, 6, 8 |
| FSb | 6, 18 | |||||||||
| T Tau type | CTTS | 5, 17 | CTTS | 8 | … | … | CTTS | 5 | CTTS | 17 |
| (K) | 4205 | 7 | 4730 | 7 | 5150 | 12 | 3778 | 14 | 4730 | 7 |
| 4775 | 8 | 4000 | 8, 12 | 3800 | 8 | |||||
| Mass () | 0.9-1.8 | 7, 8c | 0.7-2.1 | 4, 8c | 2 | 12 | 0.52-0.53 | 4, 8c | 1.4 | 4c |
| 0.67 | 15 | |||||||||
| 0.88 | 5 | |||||||||
| Radius () | 2.5d | … | 2.8d | … | 3.1 | 12 | 1.05d | … | 1.6d | … |
| W([O I]) (Å) | 11-22 | 15 | 3.8 | 2 | … | … | 0.7 | 2 | 3.5 | 2 |
| 7.9 | 15 | |||||||||
| 3.62 | 8 | 1.8 | 8 | … | … | 0.2 | 14 | 1.1 | 7 | |
| 1.7 | 7, 15 | 1.3 | 12 | 0.3 | 5 | 0.76 | 5 | |||
| 1.15 | 5 | |||||||||
| 6.4 | 4 | 6.98 | 4 | 6.1 | 12 | 0.7 | 4, 8 | 2.7 | 4 | |
| 8 | 1 | |||||||||
| (mag) | 1.41 | 5 | 3.3 | 11 | 49 | 12 | 1.26 | 5 | 3.4 | 15 |
| 2.20 | 10 | 5.6 | 12 | 1.46 | 4 | 2.29 | 4 | |||
| 3.32 | 8 | 12.1 | 8 | 35 | 13 | 6.31 | 8 | |||
| 3.2 | 15 | |||||||||
| (mag) | 0.36 | 7 | … | … | … | … | 0.41 | 14 | 0.55 | 7 |
| -7.34 | 5 | -6.71 | 8 | … | … | -8.50 | 5 | -7.99 | 5 | |
| -6.13 | 8 | -6.92 | 8 | |||||||
| -5.7 | 15 | |||||||||
| -6.19 | 8 | -6.54 | 8 | … | … | -7.42 | 8 | -7.1 | 15 | |
| -6.5 | 15 | |||||||||
| -6.1 | 10 | |||||||||
| -6.6 | 16 | |||||||||
| 0.02 | 6 | 0.003 | 6 | … | … | 0.0005 | 6 | 0.002 | 6 | |
| age (Myr) | 1.3-2.2 | 7, 8c | 0.89-0.98 | 4, 8c | … | … | 1.5-7.2 | 8, 14c | 7 | 4c |
| (km s-1) | 250 | 2 | 80-300 | 2 | … | … | 90-110 | 2 | 110 | 2 |
| (km s-1) | 194 | 3 | … | … | … | … | … | … | … | … |
| (km s-1) | … | … | 90 | 2 | … | … | 86 | 2 | … | … |
| (d) | 6.3 | 19 | … | … | … | … | ||||
| (km s-1) | 28.6 | 8 | 25.3 | 8 | … | … | 19.2 | 8 | 27.4 | 8 |
-
a
References: 1 Cohen & Kuhi (1979); 2 Hirth et al. (1997), radial velocities (along line of sight) for the high-velocity outflow component; 3 Dougados et al. (2000), proper motion for DG Tau A; 4 Kenyon & Hartmann (1995); 5 White & Ghez (2001); 6 Andrews & Williams (2005); 7 Briceño et al. (2002); 8 White & Hillenbrand (2004); 9 2MASS, Cutri et al. (2003); 10 Muzerolle et al. (1998); 11 Leinert et al. (2001); 12 Koresko et al. (1997); 13 Ménard et al. (1993); 14 Luhman (2004); 15 Hartigan et al. (1995); 16 Bacciotti et al. (2002); 17 Kenyon et al. (1998); 18 Hartmann et al. (2005); 19 Bouvier et al. (1993)
-
b
FS = flat-spectrum source (also I/II)
-
c
Ages and masses calculated based on parameters given in the cited references, using Siess et al. (2000) evolutionary tracks
-
d
Radius calculated from and
-
e
Upper limit to rotation period calculated from radius and
Basic properties of the four peculiar X-ray sources are collected in Table 2. The table lists spectral type, infrared classification (“YSO class”), T Tauri type according to the H equivalent width, the stellar effective temperature , the stellar mass based on Siess et al. (2000) evolutionary tracks, the stellar radius computed from the stellar luminosity and , the equivalent width of [OI] lines (that can be formed in jets, Hirth et al. 1997), the stellar photospheric luminosity , the bolometric luminosity (integrated from the infrared+optical spectral energy distribution, including contributions from disks and envelopes), the extinctions and , the mass accretion rate , the mass outflow rate , estimates of the total disk mass , the estimated age as derived from Siess et al. (2000) evolutionary tracks, the jet radial velocity and its dispersion , the rotation period (derived from ), and the projected equatorial velocity . For DG Tau, we also list a value for the jet proper motion . Multiple values are given if they are significantly different, as reported in the literature. A few notes on the individual stars follow.
DG Tau A is a classical T Tau star whose infrared spectrum, however, shows a rare, flat infrared spectral energy distribution (Andrews & Williams, 2005). It drives a very energetic jet (Mundt & Fried, 1983) similar to Class I protostars, including a counter-jet (Lavalley-Fouquet et al. 2000). The jets can be traced out to a distance of 14.4′ (McGroarty & Ray, 2004). DG Tau is one of the most active CTTS known, and ranks among the CTTS with the highest mass accretion and mass outflow rates, competing with well-studied protostellar jet sources (Hartigan et al., 1995; Bacciotti et al., 2002). The star has indeed been suggested to be a transition object between protostars and CTTS (Pyo et al., 2003). On the other hand, the stellar visual extinction is rather modest, with reported in the range of 1.4–3.3 mag (Hartigan et al., 1995; Muzerolle et al., 1998; White & Ghez, 2001; White & Hillenbrand, 2004). A much lower visual extinction has been determined for the jet’s Herbig-Haro objects, namely mag (Cohen & Fuller, 1985).
The jet is also known from radio observations (Cohen & Bieging, 1986). High-resolution studies have shown that a narrow jet ploughs through progressively slower and wider outflow structures. A few arcseconds from the star, the proper motion of the jet indicates velocities in the plane of the sky of km s-1, on average (Dougados et al., 2000), with a maximum of km s-1 (Eislöffel & Mundt, 1998). The jet radial velocity is 210–250 km s-1, compatible with the reported inclination angle of 38 deg (Eislöffel & Mundt, 1998). Bulk gas speeds reach 500 km s-1 (Bacciotti et al., 2000; Beristain et al., 2001), with FWHM line widths of 100–200 km s-1 (Pyo et al., 2003).
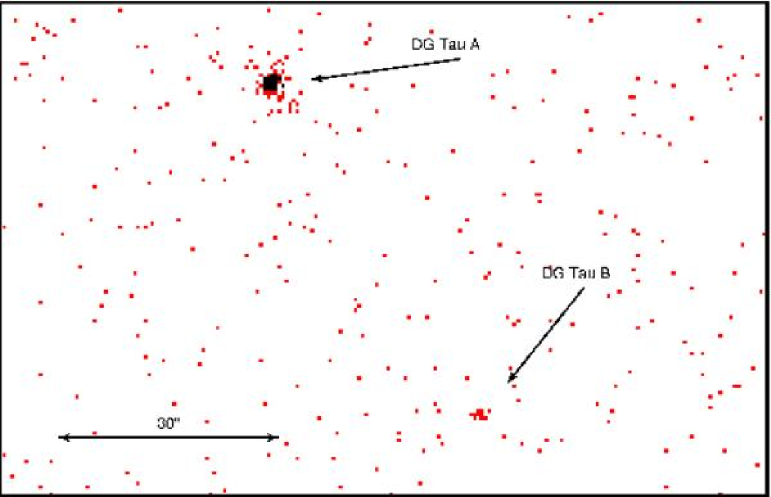
The high-velocity jet shows bow-shock like structures out to distances of several arcsecs (also known as HH 158, Mundt & Fried 1983) but can be followed down to 0.1″ from the star (Bacciotti et al., 2000; Pyo et al., 2003). Recently, Bacciotti et al. (2002) measured rotation of the jet around its flow axis, which has subsequently been used to infer the origin of the jet in the inner disk (0.34 AU for the lower-velocity component, and possibly in the X-wind region at the inner-disk edge at AU for the high-velocity jet; Anderson et al. 2003; Pyo et al. 2003). The jet mass-loss rate has been estimated by various authors in the range of yr-1 (Hartigan et al., 1995; Muzerolle et al., 1998; Bacciotti et al., 2002; White & Hillenbrand, 2004). This rate amounts to about 30% of the accretion rate, yr-1 (Hartigan et al. 1995; White & Hillenbrand 2004; White & Ghez 2001 give a somewhat lower accretion rate). Shocks seem to be the principal source of heating and excitation (Lavalley-Fouquet et al., 2000). We note that DG Tau B, a jet-driving protostar, is located at a considerable distance from DG Tau A (separation ), much larger than the PSF of the EPIC cameras. We will discuss this second source further below.
GV Tau = Haro 6-10 AB is a close, embedded binary system with a separation of 1.3″, consisting of an optically revealed T Tau-like star and a deeply embedded “infrared companion” considered to be as a protostar. The infrared spectrum of the system is that of a protostar (Class I, Table 2). This binary has received particularly detailed study in the radio range (Reipurth et al., 2004). The jet shows radial velocities in the range 80–200 km s-1 (Hirth et al., 1997).
DP Tau drives a jet that has been recorded to a distance of at least 27, and possibly to 111. The jet is oriented relatively close to the plane of the sky (Mundt & Eislöffel, 1998) although radial velocities of the jet still reach about 110 km s-1 (Hirth et al., 1997). The star shows strong [OI] emission from the jets (Hirth et al., 1997).
CW Tau drives a bipolar outflow that can be traced out to at least 4–6 from the star (Hirth et al., 1994), with Herbig-Haro objects found out to 16.8′ (McGroarty & Ray, 2004). A dedicated study of this jet was presented by the latter authors. Dougados et al. (2000) reported a highly collimated, transversally resolved jet structure.
2.3 Jet-driving protostars
We took advantage of the high spatial resolution of Chandra to obtain images of four protostellar sources that drive strong, collimated jets and outflows. Their circumstellar disks are seen nearly edge-on so that any soft emission will be strongly absorbed unless it is originating sufficiently far away from the star. This allows us to distinguish between X-ray sources coincident with the protostars and softer X-rays from internal shocks in the jets (Bally et al., 2003) and will thus assist in our interpretation of the soft components seen in the T Tau sources. This geometry also permits us to probe the disks and envelopes themselves, by studying photoelectric absorption.
Two objects, DG Tau B and FS Tau B = Haro 6-5B, are part of the XEST survey, but we also discuss here two further stars that are located in the Orion region at larger distances, namely the protostellar sources of the HH~34 and the HH~111 jets.
We used the wavdetect algorithm included in the Chandra CIAO software to identify relevant X-ray sources and to determine their positions. The algorithm was applied to images containing photons in the 0.3–10 keV range, the inspected field containing approximately standard ACIS pixels of size . We set the sigthresh parameter at a value of , which means that only one X-ray detection in the field is likely to be spurious.
To optimize the positional information for the X-ray sources, we registered, as far as possible, field sources against 2MASS catalog entries (Cutri et al., 2003) but found that the positional agreement is extremely good, with typical offsets222The 90% source location error circle in Chandra has a radius of about 0.5″, see Chandra Proposes’ Observatory Guide v.8. of , which is not significant. We provide some specific information on the four sources below.
DG Tau B is an embedded, envelope-dominated, jet-driving protostar described in detail by, among others, Mundt & Fried (1983), Mundt et al. (1987), and Eislöffel & Mundt (1998). Near-infrared imaging shows two narrow cavities and a thick dust-lane seen nearly edge-on, but probably not the protostar (Padgett et al. 1999 = P99). DG Tau B is considered to be in a Class I stage (Watson et al., 2004). It was detected as a radio source by Rodríguez et al. (1995).
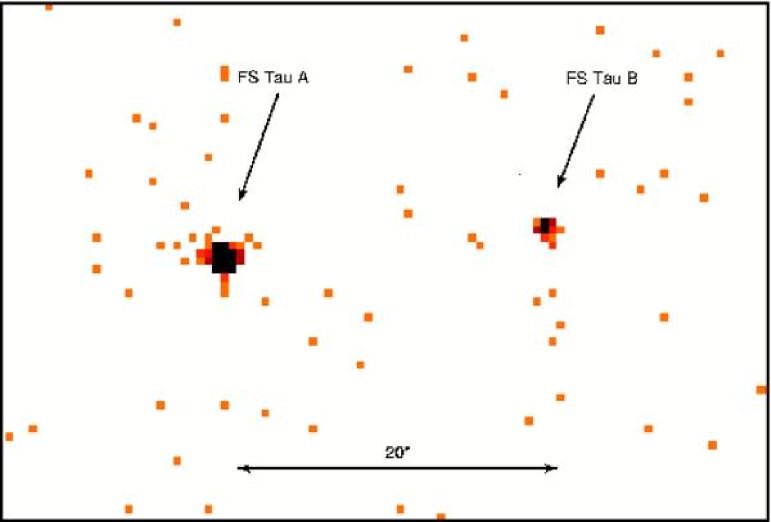
FS Tau B = Haro 6-5B is a jet-driving embedded source about 20″ west of the classical T Tau binary system FS Tau A. It was discovered as a jet source by Mundt et al. (1984) and described in detail by Mundt et al. (1987), Eislöffel & Mundt (1998), and Krist et al. (1998). Near-infrared imaging shows it as a disk-dominated protostar in which a thick dust lane, seen nearly edge-on, separates two nebulae considered to be the illuminated surfaces of the flared disk, with a widely open cavity (P99). FS Tau B is probably in a rather evolved stage of Class I evolution, in transition to becoming a TTS. In the near-infrared, the star itself seems to be detected (P99). FS Tau B was found as a radio source by Brown et al. (1985).
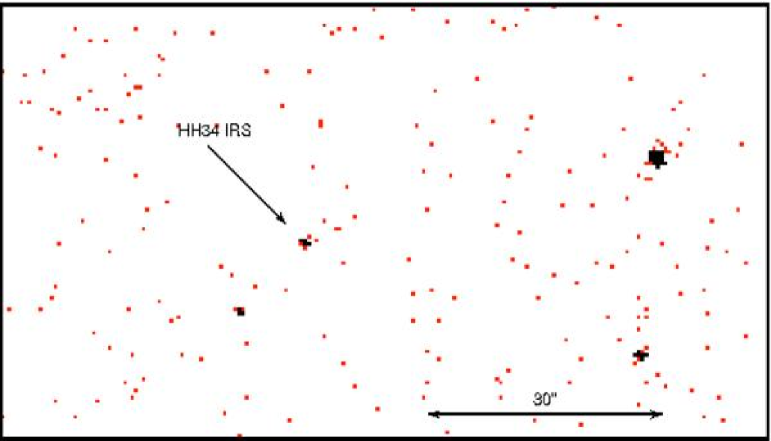
The HH 34 source drives one of the finest, highly collimated jets (Bührke et al., 1988). The optical jet can be followed to within of the Class I protostar. The star itself has been detected in the optical (Bührke et al., 1988), in the infrared (IR) (Reipurth et al., 2002), and in the radio (Rodríguez & Reipurth, 1996), with a molecular cloud surrounding it.
The HH 111 infrared source drives another highly collimated, long jet but the source and the innermost 22″ of the jet are very highly obscured (Reipurth et al., 1997). The absorbed portions of the jet have been revealed in the infrared by Reipurth et al. (1999) and Reipurth et al. (2000). Radio detections have also been reported by Rodríguez & Reipurth (1994) and Reipurth et al. (1999). They identify a quadrupolar outflow, suggesting that the driving source is a close binary.
3 Results
3.1 Optically revealed, jet-driving T Tau stars
3.1.1 Spectral interpretation
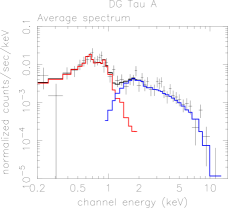
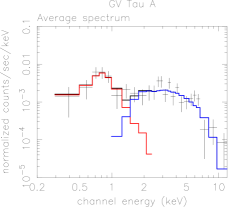
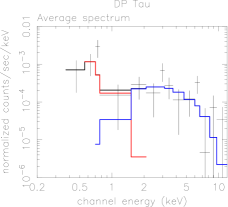
Fig. 1 presents EPIC PN spectra from DG Tau A, GV Tau, and DP Tau, respectively, together with spectral fits (see below). We have used the full exposure times except for a few intervals with high background radiation. The MOS spectra are similar but considerably fainter. They were used for spectral fits together with the PN spectra in the case of DG Tau A, while they were too faint to add useful information in the other cases.
All three spectra are rather flat and show two shallow maxima, one around 0.65–0.8 keV and the other at 1.5–3 keV, with an intervening trough at 1–1.5 keV. These spectra cannot be acceptably fitted with a combination of thermal coronal models subject to a single photoelectric absorption component, as was already pointed out by Güdel et al. (2005) for the Chandra ACIS spectrum of DG Tau A. The softer maximum is formed by emission lines of O viii Ly at 18.97 Å (0.65 keV), Fe xvii at 17 Å (0.73 keV) and at 15 Å (0.83 keV), as well as Fe xviii at 16 Å (0.78 keV, blended with O viii Ly) and at 14.2 Å (0.87 keV). The Ne ix He-like triplet contributes at Å (0.92 keV, blended with F xvii at 13.8 Å or 0.9 keV). All these lines have maximum formation temperatures between 3.2 MK and 6.9 MK (O viii: 3.2 MK; Ne ix: 3.9 MK; Fe xvii: 5.2 MK; Fe xviii: 6.9 MK). The best matches of the subpeaks at 0.7 keV and at 0.80–0.85 keV in the DG Tau A spectrum are clearly the O viii Ly and the two Fe xvii lines. On the other hand, we note the absence of strong emission around 1 keV usually present in very active stars with hot coronae (Telleschi et al., 2005). This latter emission would be formed by Ne x at 12.1 Å (1.0 keV, MK), Fe xx at 12.8 Å (0.97 keV), and by various further lines of Fe xx-xxiv ( MK). For typical elemental compositions, these spectral properties clearly suggest emission by a rather cool plasma in the absence of prominent contributions from hot components. The rather high emission level down to 0.2 keV in DG Tau A and to keV in DP Tau further suggests a rather low absorbing column density.
On the other hand, the spectra above keV are shallow and can, despite the low count rates, be followed out to 10 keV for all three stars. This unambiguously indicates emission from very hot ( MK) plasma which would normally form strong emission lines around 1 keV as well. The hard emission is dominated by bremsstrahlung which, in the absence of absorption, rises toward lower energies. But these low-energy features of hot plasma are suppressed by strong photoelectric absorption: All three hard spectral components reveal a turnover around 2 keV.
As suggested by Güdel et al. (2005), these spectra can be successfully fitted with a model consisting of two thermal components, each subject to a separate photoelectric absorption component. We fitted the spectra as follows. For DG Tau A and GV Tau, we first considered counts within the soft maximum only (0.25–1.0 keV). The abundances adopted (and held fixed) reflect an “inverse First Ionization Potential” distribution often found in magnetically active and pre-main sequence stars (see Güdel et al. 2006 for a discussion). Fit parameters were the absorbing hydrogen column density , a single temperature , and the emission measure EMs. The fits were perfect, with reduced . Next, we added the hard portion of the observed spectrum up to 10 keV but held the fit obtained above fixed. We added a second spectral component with its own absorption component and fitted the corresponding variables , , and EMh. To optimize in particular the overlapping spectral region (1–1.5 keV), we continued fitting the , , and EM parameters of both components simultaneously, but this did not significantly change the parameters. The DP Tau spectrum is too poor to allow for step-wise fitting. We therefore fitted the two components simultaneously from the outset.
| Soft component | Average hard component | ||||||
| Star | |||||||
| DG Tau Ac | 0.11 (0.08-0.14) | 3.7 (3.2-4.6) | 0.96 | 1.80 (1.21-2.40) | 69 (44-188) | 5.1 | 89.9/93 |
| = 0.45 | 2.2 (2.05-2.35) | 9.6 | 1.71 (1.14-2.30) | 73 (45-220) | 5.0 | 100.2/94 | |
| GV Tau A | 0.12 (0.01-0.79) | 5.8 (2.1-9.1) | 0.54 | 4.12 (2.07-6.47) | 80 (34-…) | 10.2 | 20.3/19 |
| = 1.12 | 0.94 (0.94-1.31) | 4170 | 3.48 (1.69-5.48) | 95 (42-…) | 9.6 | 24.6/20 | |
| DP Tau | 0.00 (0.00-1.05) | 3.2 (0.0-7.7) | 0.04 | 3.78 (1.38-14.0) | 61 (10-…) | 1.1 | 8.9/7 |
| = 0.29 | 2.3 (0.94-3.8) | 1.1 | 3.13 (0.78-13.8) | 104 (10-…) | 0.92 | 9.1/8 | |
-
a
90% confidence intervals in parentheses (ellipses indicating unconstrained parameter)
-
b
Modeled for the 0.1–10 keV energy interval
-
c
Fits applied to combined PN, MOS1, and MOS2 data
As far as abundances are concerned, the spectrum of DG Tau marginally suggested a somewhat higher Fe abundance (0.4 instead of the adopted 0.2 times the solar photospheric value given by Anders & Grevesse 1989), but this value was poorly constrained, and the other parameters of interest here, and , did not change in any significant way. We further experimented with variable abundances as follows. We kept the adopted abundance ratios fixed but varied the absolute abundance level. For DG Tau A, the best fit resulted in unacceptably low abundances of Fe (% of the solar value), while the temperatures and absorption column densities again remained similar.
The final results are reported in Table 3. The X-ray luminosities and refer to the 0.1–10 keV range based on integration of the best-fit model, and assume a distance of 140 pc of the Taurus association (e.g., Loinard et al. 2005; Kenyon et al. 1994).
Noting that the value for the soft component of DG Tau A are lower than those anticipated from optical extinction, and is only marginally in agreement with the lowest reported for GV Tau A, we next adopted a fixed value for the soft component (marked by “=” in Table 3), using the standard conversion formula, cm-2, valid for standard gas-to-dust ratios (see Vuong et al. 2003 and references therein). These fit results are also reported in Table 3. Fixing at the expected values provides significantly worse fits and lowers the temperature of the cooler component, at the same time rising its . The value of the latter is unacceptable for GV Tau because it approaches , while is usually bound by (Güdel 2004 and references therein). We believe that the origin of this excess is purely numerical: increased allows more and cooler plasma to be present without significant spectral contribution, because X-rays from cooler plasma are softer and therefore more strongly absorbed. The effect continues as one increases . This lends most credibility to the best fit without enforced , and this best fit indeed results in only modest suppression even at low energies.
In summary, the spectra of DG Tau A, GV Tau, and DP Tau are thus composed of two components, a cool component subject to very low absorption and a hot component subject to photoelectric absorption about one order of magnitude higher. The cool component shows temperatures atypical for T Tau stars (Skinner et al., 2003; Telleschi et al., 2006), ranging from 3–6 MK (best fit), while the hot component reveals extremely high temperatures (60–100 MK). If is fitted to the spectrum, it tends to be lower than expected from the optical extinction.
The spectrum of CW Tau resembles the spectrum of DP Tau but is too weak to derive definitive results. This source is also affected by the wings of the nearby and very bright X-ray source of V773 Tau (at a distance of 1.5′). A single- fit to the harder photons (above 1.2 keV) requires an excessively absorbed ( cm-2), very strong cool component with MK, but there is a marginal excess of counts below 1 MK that requires a further, low-absorption component. Better-quality data are needed. We note that the star’s mag (Kenyon & Hartmann, 1995) suggests a much smaller cm-2.
Results for the three further jet/outflow driving sources mentioned above, UZ Tau, DD Tau, and XZ Tau, are summarized in Güdel et al. (2006). UZ Tau (a triple system) reveals a relatively soft spectrum (emission-measure weighted average temperature of 5–7 MK). On the contrary, the very faint spectrum of DD Tau is extremely hard, reminiscent of the harder component of the sources discussed above, with MK and excess absorption ( cm-2, whereas mag after White & Ghez 2001, or mag after Briceño et al. 2002). A soft excess is not found for this source. Adopting a jet bulk velocity of 300 km s-1 and a radial velocity of km s-1 (Hirth et al., 1997), we infer an inclination angle of 75 deg. The strong photoelectric absorption may be due to disk material, while the low values of and may be affected by scattered light. No anomaly was found for XZ Tau.
3.1.2 Light curves and time-resolved spectroscopy
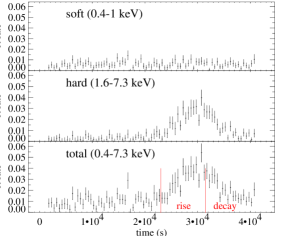
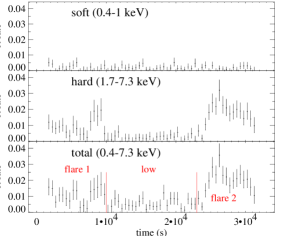

We present the light curves in Fig. 2, where we used counts below keV and above keV (depending on the spectral shape) for the soft and the hard component, respectively. All light curves show clear signatures of flaring. Surprisingly, however, flaring is revealed only in the hard component while the soft component remains at a low level. We tested the background-subtracted light curves for constancy, applying a test. To do so, we rebinned the light curve of DG Tau A such that the bins of the soft curve contained, on average, 8 or 11 counts. This required bins of 1500-2000 seconds, which is sufficient to still recognize typical flares. With the same binning, the hard curve contained, on average, 6 or 8 cts but showed the strong flare well resolved. For GV Tau, we binned to 2000 and 3000 s, which on average resulted in only 2.3 and 5 cts per bin, respectively. The hard curve shows a 2.7 times higher count rate. A test for constancy resulted in a reduced that was smaller than unity for the soft light curves of DG Tau A and GV Tau, whereas the variability in the hard curve is highly significant with . DP Tau is too faint for a meaningful test of this kind.
To further clarify the spectral behavior in time, we extracted EPIC spectra during various episodes for DG Tau A and GV Tau (low level, flare rise, and flare decay for DG Tau A; low level, first flare episode and second flare episode for GV Tau; see Fig. 2 for a graphical definition of the corresponding time intervals). The corresponding plots are shown in Fig. 3. The hard component varies both in flux and in spectral shape: the shallower slope during the flares indicates higher temperatures, while the soft component remains at the same level. This is borne out by spectral fits performed for the same intervals. The results are reported in Table 4. Because the spectra are too poor to fit reliably, this parameter was frozen at the value found for each integrated spectrum. The temperature of the soft component remains constant within the errors, while the temperature of the hard component rises during the flare episodes. Note also that the X-ray luminosities of the soft component are very similar (the spectrum of the first flare episode of GV Tau is too faint to produce reliable results).
| Soft component | Average hard component | ||||||
| Star | |||||||
| DG Tau A lowc | =:0.11 | 3.7 (3.3-4.6) | 0.91 | =:1.80 | 23 (14-42) | 2.1 | 24.5/33 |
| DG Tau A risec | =:0.11 | 3.9 (3.1-5.6) | 0.89 | =:1.80 | 396 (144-…) | 12.4 | 27.9/31 |
| DG Tau A decayc | =:0.11 | 3.9 (3.3-4.9) | 1.02 | =:1.80 | 74 (44-144) | 6.7 | 15.7/24 |
| GV Tau low | =:0.12 | 4.7 (3.0-9.7) | 0.54 | :=4.12 | 17.5 (4.3-63) | 7.3 | 5.4/5 |
| GV Tau flare 1 | =:0.12 | 2.1 (…) | 0.16 | =:4.12 | 77 (24-…) | 16.3 | 3.7/2 |
| GV Tau flare 2 | =:0.12 | 4.5 (…-12.6) | 0.45 | =:4.12 | 119 (52-…) | 19.9 | 6.7/7 |
-
a
90% confidence intervals in parentheses (ellipses indicating unconstrained parameter)
-
b
Modeled for the 0.1–10 keV energy interval
-
c
Fits applied to combined PN, MOS1, and MOS2 data


3.1.3 Comparison with Chandra spectra
Both DG Tau A and GV Tau have been observed by Chandra ACIS as well (see Güdel et al. 2006 for an observation log). The sources are rather faint, and no flaring was detected during the observations. We therefore present only the integrated spectra and compare them with the integrated XMM-Newton spectra. Figure 4 shows the observed Chandra spectra together with the spectral model of the soft component of the XMM-Newton observations, folded with the appropriate ACIS response matrices. We note that the Chandra and XMM-Newton observations were separated by 7 months for DG Tau A and by 8 months for GV Tau.
Whereas the flux of the hard components varied greatly during the 30–40 ks XMM-Newton observations, the flux of the soft components changed little in the 7–8 months between the Chandra and XMM-Newton observations, although some details in the spectrum do differ. The Chandra spectrum of DG Tau A shows excess flux at 0.8–0.9 keV, a discrepancy that did not disappear if the the soft portions (1 keV) of both spectra were fitted simultaneously, even if we changed the abundances. Fitting the Chandra spectrum finds a best-fit Fe abundance of (Anders & Grevesse, 1989), the same that we adopted for the XMM-Newton model. The soft-component is again low ( cm-2) and marginally compatible with XMM-Newton, although the best-fit temperature is somewhat higher (4.4 MK). No significant deviation between the soft Chandra and XMM-Newton spectra is found for GV Tau.


3.2 Embedded, jet-driving protostars
The embedded, jet-driving protostars seen at high inclination expectedly reveal rather faint X-ray fluxes owing to strong photoelectric absorption. Table 5 summarizes X-ray detection properties and results from spectral fits (see below).
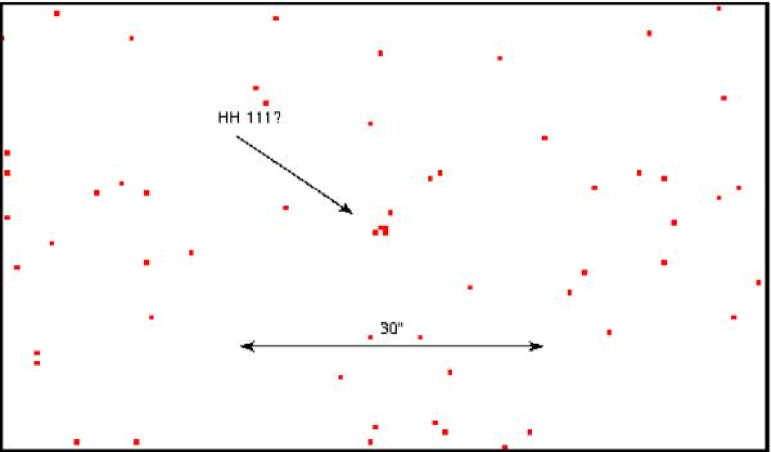
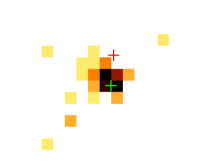
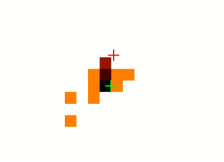
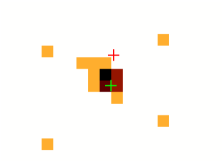
Three of the four target sources (DG Tau B, FS Tau B, and HH 34 IRS) were clearly detected very close to the expected positions based on wavdetect, while only 4 counts were registered for HH 111 (Fig. 5). The close positional coincidence with the radio source (0.15″ distance from the HH 111 radio position given by Rodríguez & Reipurth 1994), the strong clustering of the counts within a radius of 1–2 pixels (Fig. 5), the energy of the four counts (3.3–6.4 keV, very similar to the distributions found for the other absorbed sources), and the rather low background level make it probable that these photons originate from the HH 111 jet-driving protostar although the significance is too low to prove this identification. The background level was such that 0.1 counts would be expected in the 3–7 keV range in a circle with a radius of 3″ around the source, and 0.6 cts in the 0.3–10 keV range.
| Parameter | DG Tau B | Refa | FS Tau B | Refa | HH 34 IRS | Refa | HH 111 IRS | Refa |
|---|---|---|---|---|---|---|---|---|
| Useful spectral range (keV) | 2–6.5 | - | 2–7 | - | 3–7 | - | 3–6.5 | - |
| Detected X-ray counts | 9 | - | 32 | - | 15 | - | 4 | - |
| Position: | ||||||||
| Expected R.A. (h m s) | 04 27 02.55 | 1 | 04 22 00.70 | 2 | 05 35 29.84 | 2 | 05 51 46.31 | 3 |
| Expected | 26 05 30.90 | 1 | 26 57 32.50 | 2 | -06 26 58.40 | 2 | 02 48 29.72 | 3 |
| Observed R.A. (h m s) | 04 27 02.58 | - | 04 22 00.71 | - | 05 35 29.84 | - | 05 51 46.30 | - |
| Observed | 26 05 30.91 | - | 26 57 32.17 | - | -06 26 58.24 | - | 02 48 29.70 | - |
| Offset (″) | 0.40 | 0.36 | - | 0.16 | - | 0.15 | - | |
| X-rays: | - | |||||||
| Expected | 1.4 | 6 | , , 4.6 | 1, 6, 4 | 1 | 5 | 7 | |
| Measured | 51 (6–72) | 26 (10–37) | - | 28 (14–54) | - | - | - | |
| a References: 1 = Padgett et al. (1999), 2 = 2MASS, Cutri et al. (2003), 3 = Rodríguez & Reipurth (1994), 4 = Krist et al. (1998), | ||||||||
| 5 = Reipurth et al. (1986), 6 = Mundt et al. (1987), 7 = Reipurth (1989) | ||||||||
| b Expected from reported optical extinction: cm-2 | ||||||||
| is given in units of cm-2, 90% confidence ranges are in parentheses | ||||||||
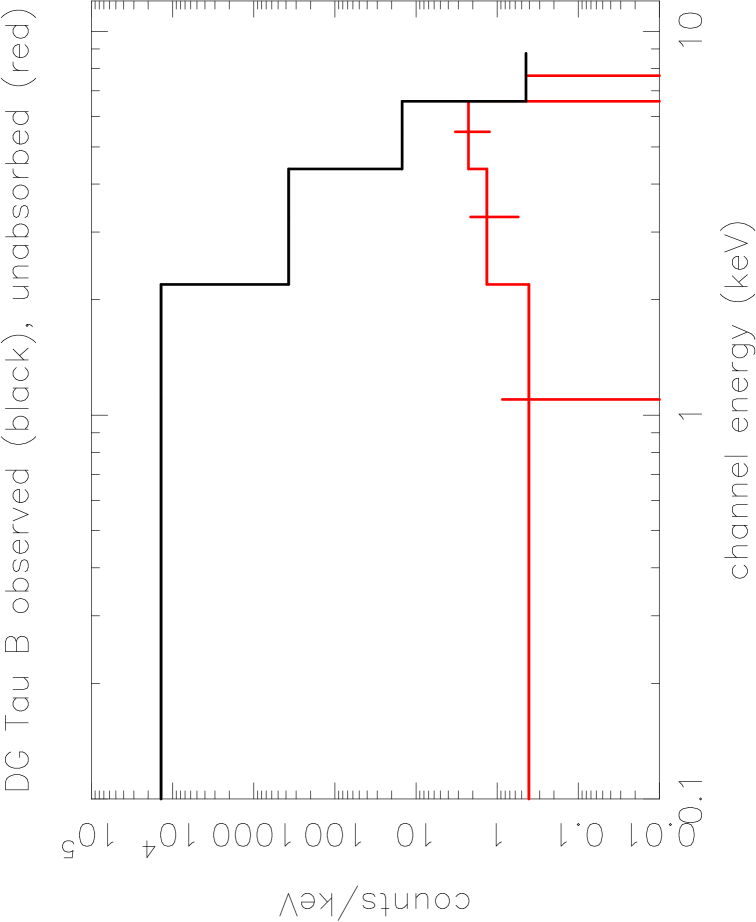
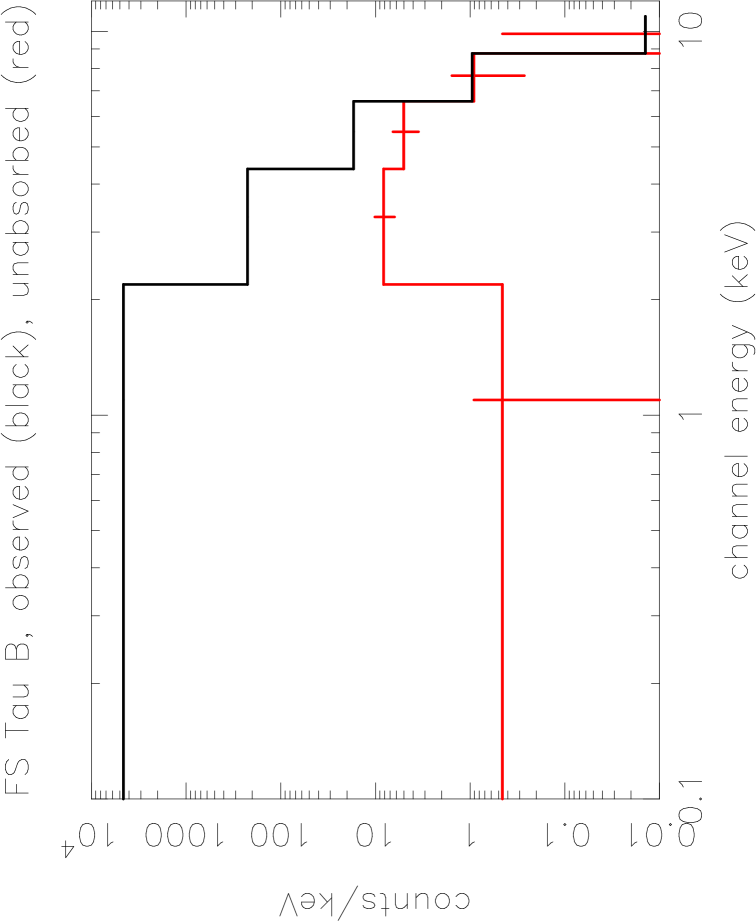
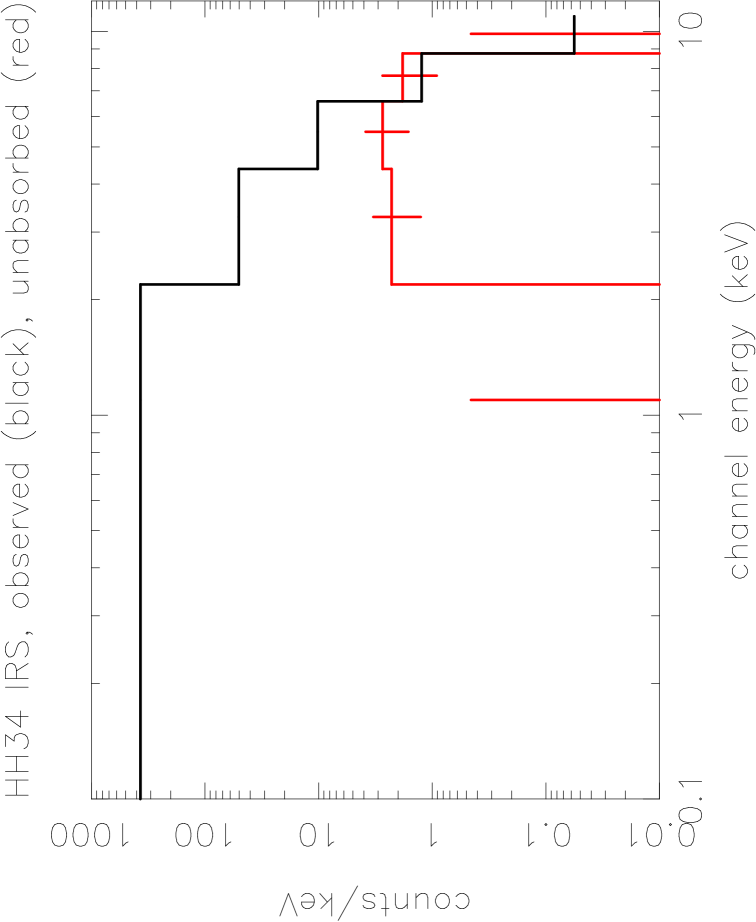
To avoid systematic effects in the spectral fits due to coarse binning of the few counts, we used the C statistic in XSPEC in combination with unbinned data in the energy range of 0.5–8 keV. The metallicity was fixed at 0.2 times solar photospheric values (Anders & Grevesse 1989), coincident with the adopted Fe abundance for the other spectral fits (we note that the only emission lines significantly contributing to the absorbed protostellar sources are those in the Fe complex at 6.7 keV; even adopting solar abundances did not change our results significantly). For illustration purposes, we show in Fig. 6 binned spectra together with the best-fit unabsorbed models. These figures illustrate that most of the flux is suppressed by photoelectric absorption. The best-fit results and the acceptable 90% ranges for are summarized in Table 5; other parameters were not sufficiently constrained for further discussion.
4 Discussion
The TAX spectra from the optically revealed jet-driving T Tau stars presented in this paper clearly require two spatially distinct sources because both their time behavior and their absorption along the line of sight are different. We now discuss possible models.
4.1 CTTS: The hard component
The hard components of the spectra reveal very high temperatures. Such temperatures are commonly found in other T Tau stars (Skinner et al., 2003; Telleschi et al., 2006). The flares seen in the light curves clearly argue in favor of a magnetic origin. For DG Tau A, the U band light curve extracted from the simultaneous observations with the OM peaked before the X-rays, in analogy to solar flares (Fig. 7, upper panel). We therefore interpret this component as being due to a magnetically confined corona above the surface of the star. The time resolution of the OM data is too coarse to reveal a clear temporal relation for GV Tau (Fig. 7, lower panel).
The excessive absorption of this coronal component requires a large amount of cool gas along the line of sight to the observer. A cool wind or a molecular outflow are potential absorbers. However, in that case the soft component must be located at very large distances from the star in order to escape from strong absorption. Also, dust admixtures would lead to correspondingly strong optical extinction of the star, which is not observed.


We propose a scenario related to accretion streams. The mass accretion rates of our stars are among the largest found in any TTS in the TMC (Table 2). Much of the gas accreting from the circumstellar disk is only weakly ionized. This gas will stream along the magnetic field lines that form the corona and thus enshroud X-ray bright coronal loops so that photoelectric absorption attenuates the soft X-rays from the underlying coronal plasma.
Why, then, is the optical extinction of the stars relatively small? The measured columns would imply mag for each star while measured optical extinctions are only a few magnitudes (Table 2). Such deviations are possible if the X-rays are propagating through an anomalous mixture of gas and dust in which dust is depleted. Dust destruction and evaporation occurs at temperatures around K (D’Alessio et al., 1998; Whitney et al., 2004), and the dust sublimation radius from the center of the star can be estimated from the empirical formula,
| (1) |
(Whitney et al. 2004, where K has been assumed). Using from Table 2, we find radial distances of . As a consequence, there should be no strong extinction by dust from the accretion streams while photoelectric absorption remains in effect. In this picture, visual and near-infrared extinctions are due to the larger-scale environment of the star, while photoelectric absorption is due to both the large-scale environment (for the soft components) and, more strongly, the immediate surroundings of the star (for the hard component). Our observations may thus give indirect evidence for dust sublimation in the inner circumstellar accretion disks of T Tau stars on the one hand and for strong gaseous accretion streams in the innermost region or onto the star on the other hand.
4.2 CTTS: The soft component
The soft component dominates the spectrum below 1 keV. The spectral shape in this region shows no indication of an equally prominent plasma component at temperatures MK. This component, considered in isolation, is unusual for T Tau stars that normally reveal spectra dominated by hot temperatures (Telleschi et al., 2006). The exception extensively discussed in the recent literature is TW Hya, the X-ray spectrum of which is strongly dominated by a soft spectral component of this kind. TW Hya is, however, a rather evolved classical T Tau star with an age of Myr and a low accretion rate of yr-1 (Muzerolle et al., 2000). Kastner et al. (2002) proposed that the low temperatures and the high electron densities inferred from the O VII He-like triplet are indicative of X-rays produced in accretion shocks rather than coronal X-rays. Stelzer & Schmitt (2004) argued that the anomalous abundances found in the TW Hya X-ray spectrum are further support for this picture.
In the case of the jet-driving sources, this explanation faces serious difficulties. The accretion rates measured for these stars are among the highest known in TMC. If X-rays are produced near the footpoints of accretion funnels, then we would expect that the same gas streams absorbing the hot coronal emission also strongly absorb the soft component.
On the contrary, the measured absorption column densities tend to be smaller than expected from the optical extinction of the star, at least for DG Tau A. Either, the soft X-rays escape through a region of depleted gas in between the accretion streams, or they are formed significantly outside the immediate environment of the star. Consulting Table 2, the distinguishing property of the TAX sources are their jets. The strong differences in of the cool component (ratio of 1:0.56:0.04 for DG Tau A : GV Tau : DP Tau) mirror in two parameters: the equivalent width of [O I] (1:0.23:0.05), and the mass outflow rate (1:0.3:0.06). Although no linear relation is to be expected, the trend is rather suggestive for outflow-related X-ray activity.
A faint soft component was also found at a distance of 2–5″ from DG Tau A, co-spatial with bow-shock structures in the jet (Güdel et al. 2005, see also Fig. 5). Because the knots at this distance show X-ray emission while those further away do not, Güdel et al. (2005) proposed that the more luminous soft component forms in shocks even closer to the star, presumably at the base of the jets but clearly outside the magnetospheric accretion zone around the star. This would simply require that the jet portions closer to the star contain more emission measure heated to X-ray temperatures although the temperatures would be the same. This scenario is supported by the close similarity between the soft component of the X-ray spectrum obtained from the region within one arcsecond around the star, and the extended X-ray source coincident with the jet.
Further support for this hypothesis comes from optical extinction measurements of the Herbig-Haro structures in the jet of DG Tau A. Cohen & Fuller (1985) found an of 0.39 mag while the stellar has been reported between 1.4 mag and 3.3 mag (Table 2). Using standard interstellar gas-to-dust ratios, we would expect a hydrogen column density of cm-2 toward the jet, comparable with the X-ray determined value of cm-2.
The precise cause for the heating of such jet/related X-ray sources is unclear. Bally et al. (2003) suggested, for an X-ray source in the jet but spatially resolved from the location of the fully absorbed protostar L1551 IRS-5, a number of scenarios:
i) Shock-heating at the working surface of a bow shock colliding with the ambient medium, in analogy to shock heating in the more distant HH objects; ii) Thompson scattering of protostellar X-rays into the line of sight by a cool, dense medium perhaps in the outer, expanding regions of the circumstellar disk or the accreting envelope; iii) shock heating at an obstacle immersed in the jet flow, where either magnetic fields or a dense, ambient medium redirects the initially expanding wind and collimates it to a jet; iv) wind-disk or wind-wind collisions in a binary system. We are not in a position to discriminate between such models, except to note that the final option is unlikely to apply to our sources, as discussed in the next section.
We speculate that magnetic fields may further heat the jet gas. The jet of DG Tau A has been found to rotate around its axis. This motion derives from the Kepler motion of the circumstellar disk from where the jet accelerates. The motion is differential in radius, and the mass flow along the field generates a trailing spiral (Anderson et al., 2003). In ionized gas, such field configurations induce currents that may dissipate and heat the gas if its resistivity is large enough. Further irregularities can be introduced by pulsed outflows, precession, and the shock with the ambient medium (Cerqueira & de Gouveia Dal Pinto, 2004). Magnetic “tangential discontinuities” may lead to reconnection, thus liberating additional (magnetic) energy (Parker, 1983). Direct magnetic field measurements are yet to be made, although radio observations suggest the presence of weak magnetic fields in jets or outflows (e.g., Ray et al. 1997).
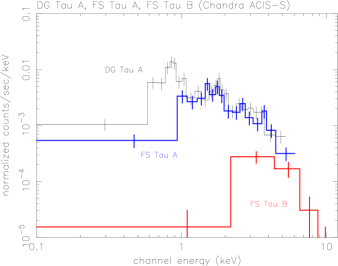
We next compare in Fig. 8 three CCD spectra from Chandra (ACIS-S): The spectrum of DG Tau A (black, with soft excess), the spectrum of FS Tau A (thick, blue), and the spectrum of the protostar FS Tau B.333we discuss data only from Chandra for this comparison because the strongly absorbed FS Tau B is located in the wings of the XMM-Newton image of FS Tau A, and FS Tau A itself was showing a gradual decay from a strong flare during the XMM-Newton observation FS Tau A is subject to a similar absorption to the hot component in DG Tau A ( cm-2, Güdel et al. 2006), shows a similar (unabsorbed) erg s-1, and also reveals an extremely hot electron temperature of 43 MK (higher temperature of a two-component fit; Güdel et al. 2006). FS Tau is, however, not known to drive strong jets, although a poorly collimated wind seems to be present (Hirth et al., 1997). While the two spectra are very similar above 1.5 keV, the absence of a soft component in FS Tau A is striking. The spectrum of the jet-driving FS Tau B does not show any soft emission because such emission from the star and the jet within an arcsecond or so would be absorbed. The hard component above 5 keV, however, is again similar in flux to the hard spectral component of the other two stars, suggesting a similar coronal component.
Optical jets are detected in predominantly low-excitation lines such as forbidden lines of [O I], [N II], and [Si II] formed at no more than a few thousand degrees (Hirth et al., 1997). On the other hand, the X-ray emission detected in direct imaging around DG Tau A (Güdel et al., 2005) and the soft spectral components suggested here to be due to jets as well require plasma with electron temperatures above 1 MK. The challenge is to reconcile the observational evidence from two widely disparate temperature ranges when the presence of an intermediate temperature range ( K) is apparently less evident in the observations. What is the status with respect to intermediate-excitation lines?
First, detectability of forbidden lines requires favorable densities for their formation, and a sufficient emission measure. Modeling of [O I], [N II], and [Si II] lines indicates that they form in distinct regions (Hamann, 1994); [O I] forms in a gas in the electron-temperature range of 9,000–14,000 K and high densities ( cm-3), while [Si II] forms above 13,000 K and in lower densities ( cm-3). At high velocities only, [N II] and [O II] lines may be formed, requiring K and cm-3. These results therefore indicate that decreases away from the star, while increases, at least as far as high-velocity gas is concerned.
Conditions in the jets may in general simply not be favorable to the production of detectable amounts of flux in higher-excitation lines, e.g., [O III]. On the other hand, there are now several reports of the presence of hot winds and outflows from T Tau stars. Beristain et al. (2001) presented an extensive study of He I and He II emission line profiles. The important diagnostic power of these lines lies in their high excitation potentials (20–50 eV), requiring gas temperatures of K in the case of collisional excitation (Beristain et al., 2001). The authors found that blueshifted absorption features in broad He I line profiles and maximum blue-wing velocities exceeding 200 km s-1 indicate the presence of hot, coronal winds in about half of their sample, one of the clearest examples being DG Tau A with a maximum blue-wing velocity of 600 km s-1. These winds would be launched in the polar region of the stars, complementary to cooler winds that are probably accelerated around the disk/magnetosphere boundary.
Work on He lines was extended to the He I 10830 line by Takami et al. (2002), Edwards et al. (2003) and Edwards et al. (2006). This feature is again a high-excitation line (20 eV, requiring K for collisional ionization) and has an unprecedented sensitivity to hot, inner winds. Significant absorption below the continuum was found in 71% of the CTTS, but in none of the WTTS, suggesting that the feature is due to accretion-driven winds, originating in the immediate vicinity of the star. Specifically in the case of DG Tau A, absorption and emission components were found, identified with an inner wind and the jet shocks, respectively (Takami et al., 2002). Further, [O III] 4959 and 5007 emission is indeed also found in one of the outer working surfaces of the DG Tau jet (Cohen & Fuller, 1985) and in other shock-related features in Herbig-Haro objects (Matt & Böhm 2003 and references therein), indicating that singly ionized O is further ionized beyond its ionization potential of 35 eV. Shock modeling suggests post-shock electron temperatures in the range of K (Cohen & Fuller, 1985), and higher temperatures at specific locations in Herbig-Haro shock regions must exist to explain recently detected X-ray emission (see summary in Sect. 1).
Gómez & Verdugo (2001) have analyzed high-resolution profiles of semiforbidden ultraviolet lines of C III] 1908 and Si III] 1892 in two CTTS. They concluded that the lines are not formed in accretion shocks but in a hot wind outside and not farther from the star than 38 (for RY Tau), suggesting a bow-shaped shock source at the base of the jet, with densities cm-3 (i.e., at least times denser than Herbig-Haro objects) and temperatures in the range of K.
Still higher outflow temperatures have been suggested by far-ultraviolet observations. The CTTSs TW Hya and T Tau both show P Cygni profiles, line asymmetries, and absorption in C III 977 and O VI 1032 lines that are indicative of a fast (400 km s-1) and hot ( K) accelerating outflow close to the star (Dupree et al., 2005).
In summary, although there is no coherent model of winds and jets at all temperature and density levels, it appears clear that CTTS show evidence for jet- or wind-related gas at temperatures from K to several times K. It is then natural to think of the X-ray emission as a continuation toward higher temperatures. It appears that at various locations in the jet, in particular in shock regions, conditions may be favorable for the production of X-rays, while densities and volumes seem to be unfavorable for appreciable line emission at lower ionization stages such as [O III]. A speculative possibility would be that rapidly heated X-ray sources in the jets freely expand and cool in such a way that their densities and emission measures are too low for easy detection in intermediate-excitation lines once the temperature has dropped to appropriate values. The dominant [O I] emission is not necessarily formed at the same locations (Hamann, 1994).
4.3 Binarity?
TAX spectra may originate from a binary with components that are located behind largely different gas columns, each thus contributing one of the spectral components. This model is unlikely for the following reasons: i) The less absorbed companion would in all cases reveal a uniquely soft, non-flaring X-ray component only. None of the bright TTS in the XEST survey, single or multiple, revealed such an X-ray spectrum (Telleschi et al., 2006; Güdel et al., 2006). ii) Except for GV Tau, no companions have been found to the TAX sources despite detailed searches (e.g., Leinert et al. 1991). iii) GV Tau = Haro 6-10 is indeed a binary, the more absorbed component being an embedded protostar behind a large gas column (see Reipurth et al. 2004 for a radio image). A high-resolution archival Chandra image (ObsID = 4498), however, reveals that the soft and hard photons originate from the same location, and this location agrees, within the error ranges for Chandra, the VLA (Reipurth et al., 2004) and 2MASS, with the less absorbed component Haro 6-10A (Table 6; Fig. 9). We conclude that the embedded Haro 6-10B does not contribute to the detected X-ray emission.
We also note that the prominent jet from the GV Tau system is associated with the optically revealed star GV Tau A rather than the deeply embedded infrared source (Reipurth et al., 2004).
| Object | Observation | RA(J2000.0)a | (J2000.0)a |
| h m s | |||
| GV Tau A | 2MASS | 4 29 23.734 | +24 33 00.277 |
| GV Tau Bb | 2MASS | 4 29 23.725 | +24 33 01.577 |
| GV Tau Ac | VLA | 4 29 23.733 | +24 33 00.125 |
| GV Tau Bc | VLA | 4 29 23.724 | +24 33 01.425 |
| soft X | Chandra | 4 29 23.744(8) | +24 33 00.54(11) |
| hard X | Chandra | 4 29 23.749(7) | +24 33 00.66(10) |
| total X | Chandra | 4 29 23.737(4) | +24 33 00.53(5) |
-
a
Errors for Chandra sources in units of last digits; formal wavdetect fit errors
-
b
Applying radio offset to GV Tau A 2MASS source
-
c
From Reipurth et al. (2004)
4.4 The protostars
Although the ACIS protostellar sources are very faint, their photon energy distribution is revealing: we detect at most one count below keV in each source, which is normally the dominant spectral range for a coronal source.
The emission cannot be radiation from shocks in the jets or Herbig-Haro objects. Such sources are too soft and will therefore be absorbed (Bally et al. 2003). The hard sources required here are reminiscent of coronal emission of very active stars. Useful information on the hydrogen absorption column density, , can therefore be obtained for the circumstellar disk.
Although the 90% confidence ranges in , , and are large (Table 5), the values of are consistently found in the range of cm-2 if we require “reasonable” values for and (e.g., typical saturation values given the estimated , and in the range of MK). We thus expect mag, much higher than reports in the literature (; Reipurth et al. 1986, Reipurth 1989, Mundt et al. 1987, Krist et al. 1998, P99): Either, the values are erroneous due to IR emission from the stellar surrounding, or the gas-to-dust (G/D) ratios are significantly enhanced in these circumstellar disks.
5 Summary and conclusions
Jets are assumed to be launched within a few AU from the central star and have been resolved down to 0.1″ (14 AU) from the latter at the distance of the Taurus Molecular Cloud (Bacciotti et al., 2000). These regions remain unresolved from the central star in present-day X-ray observations. Nevertheless, several jet-driving T Tau stars reveal peculiar X-ray spectra that have been taken as evidence for shock formation at the base of the jets (Güdel et al. 2005, and our discussion above). In all cases, a very weakly attenuated ( cm-2), luminous but very soft spectral component indicates electron temperatures of no more than a few MK. While this component produces photons mostly between 0.5–1 keV, a strongly absorbed ( cm-2), hard spectral component dominates above 2 keV, resulting in a shallow spectral shape with two peaks. The hard component originates from hot plasma of several tens of MK. In each case, it reveals flares while no significant variability is detected from the soft component whose flux is approximately constant, even on time scales of 6–8 months (Sect. 3.1.3).
We attribute the hard component to a magnetospheric corona, as observed on most T Tauri stars. Although these T Tauri stars are unusually strong accretors (with up to yr-1) we do not attribute the soft component to an accretion shock close to the surface of the star as proposed for the so far unique CTTS TW Hya (Kastner et al., 2002). Such emission would be subject to the same high absorption experienced by the hard component, while the observed soft component is little absorbed. Instead, we propose that the soft component originates further away from the star where the first shocks form at the base of the jets. Indeed, the X-ray luminosity of the soft component in these three stars appears to scale with the mass outflow rate and with the equivalent width of [O I] from the jet.
It is interesting to note that the visual extinction of the T Tau stars showing Two-Absorber X-ray (TAX) spectra is modest and does not agree with the photoelectric absorption of the hard component if standard gas-to-dust mass ratios compatible with the interstellar medium are assumed. We suggest that the hard emission is absorbed by accreting material an that this accreting material is dust-depleted. This is supported by the dust sublimation radius of our sources being several stellar radii. Our observations thus provide both evidence for dust sublimation in the innermost part of the accretion disk and for massive gas accretion streams from the disk to the star enshrouding the hot coronal plasma. Because the line of sight toward DG Tau A is inclined against the axis at a rather small angle of deg (Eislöffel & Mundt, 1998), the absorbing mass accretion streams must reach high stellar latitudes rather than fall toward the equatorial regions. This fully supports the common picture of magnetic accretion (e.g., Calvet & Gullbring 1998).
Detection of the soft jet component requires low attenuation by gas, i.e., it is inaccessible in embedded protostars although such X-rays may locally exist in all jet-driving sources. We have indeed found only hard components in our strongly obscured targets, and they coincide very closely with the position of the stars. No displaced soft components were identified although we recall that a soft jet source was reported previously for DG Tau A (Güdel et al. 2005; see also Fig. 5).
Acknowledgements.
We thank several of our colleagues, in particular Nicolas Grosso, François Ménard, and Karl Stapelfeldt, for discussions on the subject of this paper. We acknowledge constructive comments by an anonymous referee that helped to significantly improve this paper. We warmly acknowledge financial support by the International Space Science Institute (ISSI) in Bern to the XMM-Newton XEST team. X-ray astronomy research at PSI has been supported by the Swiss National Science Foundation (grants 20-66875.01 and 20-109255/1). MA acknowledges support by NASA grants NNG05GF92G. Part of this research is based on observations obtained with XMM-Newton, an ESA science mission with instruments and contributions directly funded by ESA member states and the USA (NASA). This publication makes use of data products from the Two Micron All Sky Survey (2MASS), which is a joint project of the University of Massachusetts and the Infrared Processing and Analysis Center/California Institute of Technology, funded by the National Aeronautics and Space Administration and the National Science Foundation. Further, our research has made use of the SIMBAD database, operated at CDS, Strasbourg, France.References
- Anders & Grevesse (1989) Anders, E., & Grevesse, N. 1989, Geochim. Cosmochim. Acta, 53, 197
- Anderson et al. (2003) Anderson, J. M., Li, Z.-Y., Krasnopolsky, R., & Blandford, R. D. 2003, ApJ, 590, L107
- Andrews & Williams (2005) Andrews, S. M., & Williams, J. P. 2005, ApJ, 631, 1134
- Anglada (1995) Anglada, G. 1995, RevMexAA, 1, 67
- Arnaud (1996) Arnaud, K. A. 1996, in ASP Conf. Ser. 101, Astronomical Data Analysis Software and Systems V, ed. G. Jacoby & J. Barnes (San Francisco: ASP), 17
- Audard et al. (2006) Audard, M., et al. 2006, A&A, this volume
- Bacciotti et al. (2000) Bacciotti, F., Mundt, R., Ray, T. P., et al. 2000, ApJ, 537, L49
- Bacciotti et al. (2002) Bacciotti, F., Ray, T. P., Mundt, R., Eislöffel, J., & Solf, J. 2002, ApJ, 576, 222
- Bachiller (1996) Bachiller, R. 1996, ARA&A, 34, 111
- Bally et al. (2003) Bally, J., Feigelson, E., & Reipurth, B. 2003, ApJ, 584, 843
- Beristain et al. (2001) Beristain, G., Edwards, S., & Kwan, J. 2001, ApJ, 551, 1037
- Blandford & Payne (1982) Blandford, R. D., & Payne, D. G. 1982, MNRAS, 199, 883
- Bouvier et al. (1993) Bouvier, J., Cabrit, S., Fernandez, M., Martín, E. L., & Matthews, J. M. 1993, A&A, 272, 176
- Briceño et al. (2002) Briceño, C., Luhman, K. L., Hartmann, L., Stauffer, J. R., Kirkpatrick, J. D. 2002, ApJ, 580, 317
- Brown et al. (1985) Brown, A., Drake, S. A., & Mundt, R. 1985, in Radio Stars (Dordrecht: Reidel), 105
- Bührke et al. (1988) Bührke, T., Mundt, R., & Ray, T. P. 1988, A&A, 200, 99
- Calvet & Gullbring (1998) Calvet, N., & Gullbring, E. 1998, ApJ, 509, 802
- Cerqueira & de Gouveia Dal Pinto (2004) Cerqueira, A. H., & de Gouveia Dal Pinto, E. M. 2004, A&A, 426, L25
- Cohen & Bieging (1986) Cohen, M., & Bieging, J. H. 1986, AJ, 92, 1396
- Cohen & Fuller (1985) Cohen, M., & Fuller, G. A. 1985, ApJ, 296, 620
- Cohen & Kuhi (1979) Cohen, M., & Kuhi, L. V. 1979, ApJS, 41, 743
- Curiel et al. (1993) Curiel, S., Rodríguez, L. F., Moran, J. M., & Cantó, J. 1993, ApJ, 415, 191
- Cutri et al. (2003) Cutri, R. M., et al. 2003, The IRSA 2MASS All-Sky Point Source Catalog, NASA/IPAC Infrared Science Archive. http://irsa.ipac.caltech.edu/applications/Gator/
- D’Alessio et al. (1998) D’Alessio, P., Cantó, J., Calvet, N., & Lizano, S. 1998, ApJ, 500, 411
- Dougados et al. (2000) Dougados, C., Cabrit, S., Lavalley, C., & Ménard, F. 2000, A&A, 357, L61
- Dupree et al. (2005) Dupree, A. K., Brickhouse, N. S., Smith, G. H., & Strader, J. 2005, ApJ, 625, L131
- Edwards et al. (2003) Edwards, S., Fischer, W., Kwan, J., Hillenbrand, L., & Dupree, A. K. 2003, ApJ, 599, L41
- Edwards et al. (2006) Edwards, S., Fischer, W., Hillenbrand, L., & Kwan, J. 2006, ApJ, 646, 319
- Eislöffel & Mundt (1998) Eislöffel, J., & Mundt, R. 1998, AJ, 115, 1554
- Favata et al. (2002) Favata, F., Fridlund, C. V. M., Micela, G., Sciortino, S., & Kaas, A. A. 2002, A&A, 386, 204
- Gómez & Verdugo (2001) Gómez de Castro, A. I., & Verdugo, E. 2001, ApJ, 548, 976
- Grosso et al. (2006) Grosso, N., Feigelson, E. D., Getman, K. V., et al. 2006, A&A, 448, L29
- Güdel (2004) Güdel, M. 2004, A&AR, 12, 71
- Güdel et al. (2005) Güdel, M., Skinner, S. L., Briggs, K. R., et al. 2005, ApJ, 626, L53
- Güdel et al. (2006) Güdel, M., Briggs, K. R., Arzner, K., et al. 2006, A&A, this volume
- Hamann (1994) Hamann, F. 1994, ApJS, 93, 485
- Hartmann et al. (2005) Hartmann, L., Megeath, S. T., Allen, L., et al. 2005, ApJ, 629, 881
- Hartigan et al. (1995) Hartigan, P., Edwards, S., & Ghandour, L. 1995, ApJ, 452, 736
- Hayashi et al. (1996) Hayashi, M. R., Shibata, K., & Matsumoto, R. 1996, ApJ, 468, L37
- Hirth et al. (1994) Hirth, G. A., Mundt, R., & Solf, J. 1994, A&A, 285, 929
- Hirth et al. (1997) Hirth, G. A., Mundt, R., & Solf, J. 1997, A&AS, 126, 437
- Hughes (1997) Hughes, V. A. 1997, ApJ, 481, 857
- Jansen et al. (2001) Jansen, F., Lumb, D., Altieri, B., et al. 2001, A&A, 365, L1
- Kastner et al. (2002) Kastner, J. H., Huenemoerder, D. P., Schulz, N. S., Canizares, C. R., & Weintraub, D. A. 2002, ApJ, 567, 434
- Kastner et al. (2005) Kastner, J. H., Franz, G., Grosso, N., et al. 2005, ApJS, 160, 511
- Kenyon & Hartmann (1995) Kenyon, S. J., & Hartmann, L. 1995, ApJS, 101, 117
- Kenyon et al. (1994) Kenyon S. J., Dobrzycka D., & Hartmann L. 1994 AJ, 108, 1872
- Kenyon et al. (1998) Kenyon, S. J., Brown, D. I., Tout, C. A., & Berlind, P. 1998, AJ, 115, 2491
- Königl & Pudritz (2000) Königl, A., & Pudritz, R. E. 2000, Protostars and Planets IV (Tucson: University of Arizona Press), 759
- Koresko et al. (1997) Koresko, C. D., Herbst, T. M., & Leinert, Ch. 1997, ApJ, 480, 741
- Krist et al. (1998) Krist, J. E., Stapelfeldt, K. R., Burrows, C. J., et al. 1998, ApJ, 501, 841
- Lamzin (1999) Lamzin, S. A. 1999, Astron. Lett., 25, 430
- Lavalley-Fouquet et al. (2000) Lavalley-Fouquet, C., Cabrit, S., & Dougados, C. 2000, A&A, 356, L41
- Loinard et al. (2005) Loinard, L., Mioduszewski, A. J., Rodríguez, L. F., et al. 2005, ApJ, 619, L179
- Leinert et al. (1991) Leinert, C., Haas, M., Mundt, R., Richichi, A., & Zinnecker, H. 1991, A&A, 250, 407
- Leinert et al. (2001) Leinert, Ch., Beck, T. L., Ligori, S., et al. 2001, A&A, 369, 215
- Luhman (2004) Luhman, K. L. 2004, ApJ, 617, 1216
- Mason et al. (2001) Mason, K. O., Breeveld, A., Much, R., et al. 2001, A&A, 365, L36
- Matt & Böhm (2003) Matt, S., & Böhm, K.-H. 2003, PASP, 115, 334
- McGroarty & Ray (2004) McGroarty, F., & Ray, T. P. 2004, A&A, 420, 975
- Ménard et al. (1993) Ménard, F., Monin, J.-L., Angelucci, F., & Rouan, D. 1993, ApJ, 414, L117
- Morrison & McCammon (1983) Morrison, R., & McCammon, D. 1983, ApJ, 270, 119
- Mundt & Eislöffel (1998) Mundt, R., & Eislöffel, J. 1998, AJ, 116, 860
- Mundt & Fried (1983) Mundt, R., & Fried, J. W. 1983, ApJ, 274, L83
- Mundt et al. (1984) Mundt, R., Bührke, T., Fried, J. W., et al. 1984, A&A, 140, 17
- Mundt et al. (1987) Mundt, R., Brugel, E. W., & Bührke, T. 1987, ApJ, 319, 275
- Muzerolle et al. (1998) Muzerolle, J., Hartmann, L., & Calvet, N., 1998, AJ, 116, 2965
- Muzerolle et al. (2000) Muzerolle, J., Calvet, N., Briceño, C., Hartmann, L., & Hillenbrand, L. 2000, ApJ, 535, L47
- Padgett et al. (1999) Padgett, D. L., Brandner, W., Stapelfeldt, K. R., et al. 1999, AJ, 117, 1490
- Parker (1983) Parker, E. N. 1983, ApJ, 264, 642
- Pravdo & Tsuboi (2005) Pravdo, S. H., & Tsuboi, Y. 2005, ApJ, 626, 272
- Pravdo et al. (2001) Pravdo, S. H., Feigelson, E. D., Garmire, G., et al. 2001, Nature, 413, 708
- Pravdo et al. (2004) Pravdo, S. H., Tsuboi, Y., & Maeda, Y. 2004, ApJ, 605, 259
- Preibisch et al. (2005) Preibisch, T., Kim, Y.-C., Favata, F., et al. 2005, ApJS, 160, 401
- Pyo et al. (2003) Pyo, T.-S., Kobayashi, N., Hayashi, M., et al. 2003, ApJ, 590, 340
- Raga et al. (2002) Raga, A. C., Noriega-Crespo, A., & Velázquez, P. 2002, ApJ, 576, L149
- Ray et al. (1997) Ray, T. P., Muxlow, T. W. B., Axon, D. J., et al. 1997, Nature, 385, 415
- Reipurth (1989) Reipurth, B. 1989, Nature, 340, 42
- Reipurth & Bally (2001) Reipurth, B., & Bally, J. 2001, ARA&A, 39, 403
- Reipurth et al. (1986) Reipurth, B., Bally, J., Graham, J. A., et al. 1986, A&A, 164, 51
- Reipurth et al. (1997) Reipurth, B., Hartigan, P., Heathcote, S., Morse, J. A., & Bally, J. 1997, AJ, 114, 757
- Reipurth et al. (1999) Reipurth, B., Yu, K. C., Rodríguez, L. F., Heathcote, S., & Bally, J. 1999, A&A, 352, L83
- Reipurth et al. (2000) Reipurth, B., Yu, Ka Chun, Heathcote, S., Bally, J., & Rodríguez, L. F. 2000, AJ, 120, 1449
- Reipurth et al. (2002) Reipurth, B., Heathcote, S., Morse, J., et al. 2002, AJ, 123, 362
- Reipurth et al. (2004) Reipurth, B., Rodríguez, L. F., Anglada, G., & Bally, J. 2004, AJ, 127, 1736
- Rodríguez (1995) Rodríguez, L. F. 1995, RevMexAA, 1, 10
- Rodríguez & Reipurth (1994) Rodríguez, L. F., & Reipurth, B. 1994, A&A, 281, 882
- Rodríguez & Reipurth (1996) Rodríguez, L. F., & Reipurth, B. 1996, RevMxAA, 32, 27
- Rodríguez et al. (1995) Rodríguez, Anglada, G., & Raga, A. 1995, ApJ, 454, L149
- Shu et al. (2000) Shu, F. H., Najita, J. R., Shang, H., & Li, Z.-Y. 2000, Protostars and Planets IV (Tucson: University of Arizona Press), 789
- Siess et al. (2000) Siess, L., Dufour, E., & Forestini, M. 2000, A&A, 358, 593
- Simon et al. (2000) Simon, M., Dutrey, A., & Guilloteau, S. 2000, ApJ, 545, 1034
- Skinner et al. (2003) Skinner, S. L., Gagné, M., & Belzer, E. 2003, ApJ, 598, 375
- Skinner et al. (2006) Skinner, S. L., Briggs, K. R., & Güdel, M. 2006, ApJ, in press
- Smith et al. (2003) Smith, K., Pestalozzi, M., Güdel, M., Conway, J., & Benz, A. O. 2003, A&A, 406, 957
- Stelzer & Schmitt (2004) Stelzer, B., & Schmitt, J. H. M. M. 2004, A&A, 418, 687
- Strüder et al. (2001) Strüder, L., Briel, U., Dennerl, K., et al. 2001, A&A, 365, L18
- Takami et al. (2002) Takami, M., Chrysostomou, A., Bailey, J., et al. 2002, ApJ, 568, L53
- Telleschi et al. (2005) Telleschi, A., Güdel, M., Briggs, K., et al. 2005, ApJ, 622, 653
- Telleschi et al. (2006) Telleschi, A., et al. 2006, A&A, this volume
- Tsujimoto et al. (2004) Tsujimoto, M., Koyama, K., Kobayashi, N., et al. 2004, PASJ, 56, 341
- Turner et al. (2001) Turner, M. J. L., Abbey, A., Arnaud, M., et al. 2001, A&A, 365, L27
- Ulrich (1976) Ulrich, R. K. 1976, ApJ, 210, 377
- Vuong et al. (2003) Vuong, M. H., Montmerle, T., Grosso, N., et al. 2003, A&A, 408, 581
- Watson et al. (2004) Watson, D. M., Kemper, F., Calvet, N., et al. 2004, ApJS, 154, 391
- White & Ghez (2001) White, R. J., & Ghez, A. M. 2001, ApJ, 556, 265
- White & Hillenbrand (2004) White, R. J., & Hillenbrand, L. A. 2004, ApJ, 616, 998
- Whitney et al. (2004) Whitney, B. A., Indebetouw, R., Bjorkman, J. E. & Wood, K. 2004, ApJ, 617, 1177
- Yusef-Zadeh et al. (1990) Yusef-Zadeh, F., Cornwell, T. J., Reipurth, B., & Roth, M. 1990, ApJ, 348, L61