Optimizing WIMP directional detectors
Abstract
We study the dependence of the exposure required to directly detect a WIMP directional recoil signal on the capabilities of a directional detector. Specifically we consider variations in the nuclear recoil energy threshold, the background rate, whether the detector measures the recoil momentum vector in 2 or 3 dimensions and whether or not the sense of the momentum vector can be determined. We find that the property with the biggest effect on the required exposure is the measurement of the momentum vector sense. If the detector cannot determine the recoil sense, the exposure required is increased by an order of magnitude for 3-d read-out and two orders of magnitude for 2-d read-out. For 2-d read-out the required exposure, in particular if the senses can not be measured, can be significantly reduced by analyzing the reduced angles with the, time dependent, projected direction of solar motion subtracted. The background rate effectively places a lower limit on the WIMP cross-section to which the detector is sensitive; it will be very difficult to detect WIMPs with a signal rate more than an order of magnitude below the background rate. Lowering the energy threshold also reduces the required exposure, but only for thresholds above 20 keV.
keywords:
dark matter , directional detectionPACS:
95.35+d,1 Introduction
Weakly Interacting Massive Particle (WIMP) direct detection experiments aim to directly detect non-baryonic dark matter via the elastic scattering of WIMPs on detector nuclei [1], and are presently reaching the sensitivity required to detect the lightest neutralino (which in most supersymmetry models is the lightest supersymmetric particle and an excellent WIMP candidate). Since the expected event rates are very small ( counts ) distinguishing a putative WIMP signal from backgrounds due to, for instance, neutrons from cosmic-ray induced muons or natural radioactivity, is crucial. The Earth’s motion about the Sun provides two potential WIMP smoking guns: i) an annual modulation [2] and ii) a strong direction dependence [3] of the event rate. The dependence of the differential event rate on the atomic mass of the detector (see e.g. Refs. [4, 5, 6]) is a third possibility, however this would require good control of systematics for detectors composed of different materials.
The direction dependence of the WIMP scattering rate has several advantages over the annual modulation. Firstly, the amplitude of the annual modulation is typically of order a few per-cent [2, 5] while the event rate in the direction of solar motion is roughly an order of magnitude larger than that in the opposite direction [3, 5]. Secondly, it is difficult for the directional signal to be mimicked by backgrounds. In most cases (a point source in the lab is a possible exception) a background which is anisotropic in the laboratory frame will be isotropic in the Galactic rest frame as the time dependent conversion between the lab and Galactic co-ordinate frames will wash out any lab specific features. Low pressure gas time projection chambers (TPCs), such as DRIFT (Directional Recoil Identification From Tracks) [7, 8] and NEWAGE [9], see also Ref. [10], seem to offer the best prospects for a detector capable of measuring the directions of sub-100 keV nuclear recoils.
Early studies found that in principle as few as 30 events would be required to distinguish a WIMP induced signal from isotropic backgrounds [11, 12]. In reality the number of events, and more importantly the required exposure, will depend on the detector properties including the energy threshold, background event rate, whether the read-out measures the recoil momentum in 2 or 3 dimensions (and if 2-d in which plane) [13, 14, 15] and whether the sense (i.e. the absolute sign or ) of the recoil momentum vector can be measured [13, 14, 15]. In this paper we extend our previous work [13, 14] by considering the effects of non-zero background and varying energy threshold and also making a systematic comparison of the number of events, and hence the exposure, required to reject isotropy for benchmark detector configurations covering the range of possibilities. Our aim is to provide guidance for experimentalists wishing to optimize the detection potential of their experiment. The performance of a real detector will of course be more complex than our simulated detector and the cost (both financial and man-hours) of improvements to the detector performance will in reality have to be taken into account when formulating an optimization strategy. None the less we believe that our results will provide useful indications of which aspects of the detector performance have most effect on the ability to detect a WIMP directional signal.
2 Calculating the Nuclear Recoil Spectrum
We use the same method for calculating the directional nuclear recoil spectrum as in Refs. [13, 14]. In this section we explain the essential details, for further information see these references.
2.1 Modeling the Milky Way WIMP halo
We consider the simplest possible model of the Milky Way (MW) halo; an isotropic sphere with density distribution . The velocity distribution of WIMPs at all positions within the halo is Maxwellian:
| (1) |
where , the velocity dispersion, is related to the asymptotic circular velocity (which we take to be ) by .
This model is quite possibly not a good approximation to the real Milky Way, however in Refs. [13, 14] we found that the number of events required to reject isotropy and detect a WIMP signal changed only weakly for observationally and theoretically motivated smooth halo models. It is possible (see e.g. Refs. [16, 17]) that the WIMP distribution on the sub-milli-pc scales which are probed by direct detection is composed of streams. In this case the recoil momentum spectrum, and hence the detectability of WIMPs, would depend strongly on the number and directions of streams passing through the solar neighbourhood.
2.2 Modeling the Detector Response
In a TPC directional detector, the accuracy with which nuclear recoil directions can be reconstructed is limited by multiple scattering of the nucleus and diffusion of the ionisation generated along the recoil track. To estimate this angular resolution we model a TPC filled with 0.05bar CS2 gas, a 200m pitch micropixel readout plane, a 10cm drift length over which a uniform electric field of 1kV cm-1 is applied. This gas pressure, mixture and electric field are chosen to match the design of the DRIFT-I/II detector [8], and the micropixel readout is based on those described in [18]. Although our drift length is shorter than that in DRIFT-I/II, it is chosen so that the rms diffusion over the full 10cm drift length is approximately equal to the pixel pitch [19]. We also caution that micropixel readouts have not as yet been operated with CS2 gas. However, our aim is to model a detector based on an advanced but realistic high spatial resolution readout.
We use the SRIM2003 [20] package to generate sulfur recoil tracks. The drift and diffusion of the ionisation produced along the track is simulated using the data given in Ref. [19], with charge avalanches, simulated on pixels that collect drifted ionisation. We caution that SRIM2003 was not designed to model recoils in gaseous targets, although it predicts sulfur recoil ranges and quenching factors (fraction of recoil energy going into ionisation) in agreement with experimental data [21]. However, it is the only tool available at present for this task.
Recoil directions are reconstructed as the principal axis of the charge distributions recorded by the pixels. In 3-d the distribution of the difference between the primary recoil direction and the reconstructed track direction peaks at , decreasing weakly with increasing energy, and has a long large angle tail. We take this angular resolution function into account in our 3-d Monte Carlo simulations of the recoil angle distribution. Further details on the simulation and reconstruction process may be found in Ref. [22]
At present no simulations of the angular resolution function of a 2-d detector are available. A 2-d read-out projects the recoil track into a plane and the effects of this combined with multiple scattering and diffusion will make the angular resolution a function of both the energy and primary recoil direction. We therefore assume perfect resolution for 2-d read-out and hence provide lower limits on the numbers of events required for the detection of a WIMP signal with a 2-d detector.
2.2.1 Energy threshold
For primary recoil energies below 20 keV the short track length (3-4 pixels) and multiple scattering make it impossible to reconstruct the track direction in our simulated detector. We therefore define the energy threshold as the energy above which recoil directions can be reconstructed. It is important to note that this energy is higher than the energy threshold for simply detecting recoils. In addition, it may be lower than the energy above which recoils can be discriminated from electron backgrounds. These details will vary from detector to detector.
2.2.2 Measurability of sense
For sub-100keV energies, the dE/dx of nuclear recoils, and hence the ionisation density, is predicted to slowly decrease with decreasing recoil energy. Thus the sense of a recoil track is, in principle, measurable by determining the direction in which the ionisation density decreases along the track. However, the ionisation density distributions reconstructed from our simulated recoil tracks are close to uniform due to both fluctuations in the production of ionisation and diffusion during the drift of this ionisation to the readout plane. It is therefore not possible to determine the absolute signs of the simulated reconstructed recoil vectors (i.e or ).
With our earlier caveat regarding the use of SRIM2003 to model low energy recoils, whether or not the sense of the recoils can be measured in reality is a question that needs to be addressed with experimental measurements. In our Monte Carlo simulations we therefore consider both possibilities. For clarity we refer to read-outs where the sense is measurable as vectorial, and those where it is not as axial.
2.3 2-d read-out
A 2-d read-out measures the projection of the recoil momentum vector into a plane fixed on the Earth. Choosing an arbitrary vector fixed in allows (projected) recoil directions to be described via the angle between the projected recoil and . As well as this raw angle, it is useful to measure the reduced angle between the projected recoil direction and the direction of solar motion projected into the plane:
| (2) |
where is the angle between the (projected) solar motion direction and , and is the sidereal time at which the recoil occurred.
The degree of anisotropy in the distributions of and , and hence the detectability of a WIMP signal, is dependent on the orientation of , the direction in which the recoil rate peaks and the Earth’s spin axis . The anisotropy will be maximized if i) the distance between and , over one sidereal day, is minimized (this minimizes smearing caused by projection effects) and ii) the projection into has minimal motion relative to (minimizing the smearing caused by time-averaging) [14, 15]. These requirements are met, for any , if the normal to is at to the spin axis of the Earth (we refer to this plane as the meridian plane in Ref. [14]). We focus on this plane for all analyses, but comment on the qualitative effect of changing the orientation.
2.4 Background
Zero background is the goal of the next generation of experiments made from low activity materials with efficient gamma rejection and shielding, located deep underground [23]. We investigate the effect of non-zero isotropic background by varying the ratio of the background and signal event rates and also, independently, the background rate.
2.5 Summary
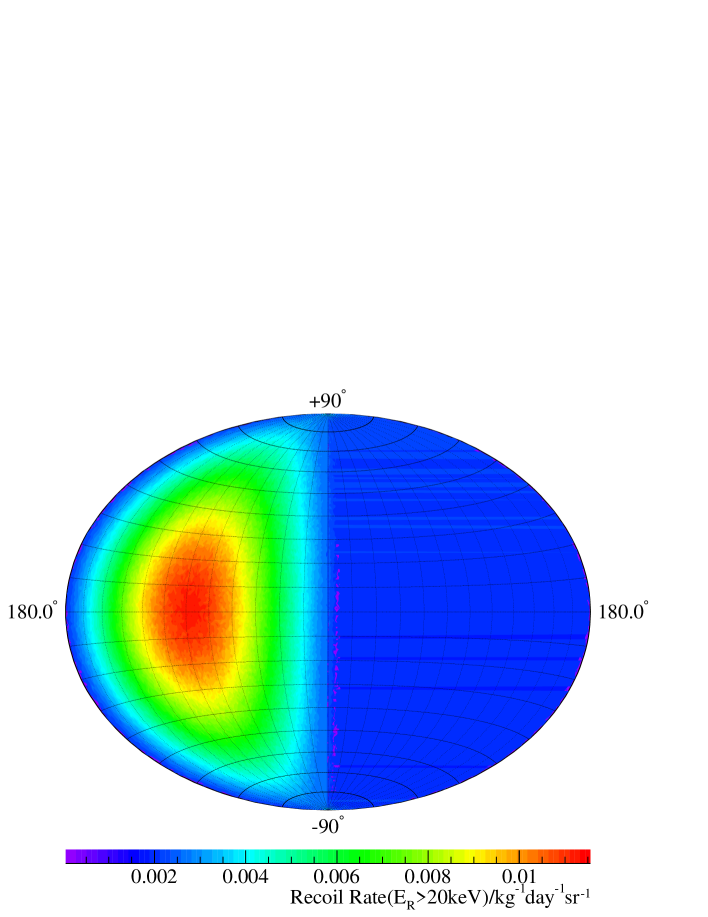
We calculate the directional recoil rate in the rest frame of the detector via Monte Carlo simulation of the spin-independent elastic scattering of nuclei by WIMPs generated from Eq. 1 with, for illustrative purposes, a mass of GeV. As appropriate, we include the detector angular resolution function and energy threshold as discussed above. For 3-d read-out we work in coordinates of Galactic longitude and latitude . The flux distribution for sulfur recoils is plotted in Fig. 1 for a WIMP-nucleon elastic scattering cross-section pb and local density .
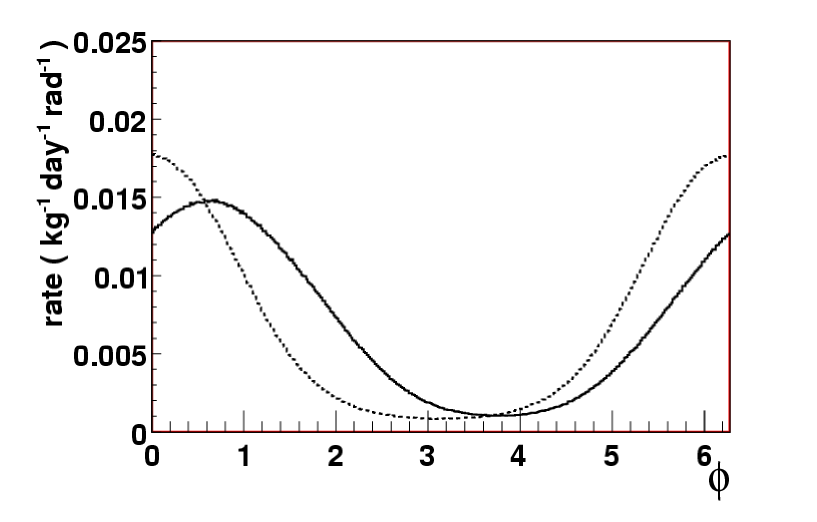
For 2-d read-out, the distribution of the angles is generated from the 3-d recoil distribution in the Galactic coordinate system by Monte Carlo simulation of the sidereal time dependent coordinate transformation to the detector frame, together with the 2-d projection effects described above. Further details of these procedures may be found in Refs [13, 14]. The raw and reduced 2-d angle distributions are plotted in Fig. 2.
3 Statistical Tests of Isotropy in 2-d and 3-d
Recoil directions in 3-d and 2-d constitute points on the unit sphere and circle respectively. As we showed in Refs [13, 14], experiments observing an anomalous recoil signal can confirm its Galactic nature by applying a range of simple non-parametric tests for anisotropy to the distribution of the observed recoil directions.
For 3-d data the most powerful test for rejecting isotropy uses the fact that, for smooth halo models, the WIMP recoil distribution is expected to be peaked about the direction of solar motion . It involves calculating the average of the cosine of the angle between the direction of solar motion and the recoil direction. For the case when the sense of the recoil vectors are known
| (3) |
where is the number of vectors (i.e. the number of events), and if the recoil sense is not known then
| (4) |
where is the 3-d angle between and the th vector/axis. For isotropic vectors ) can take values on the interval and, due to the central limit theorem, approaches a gaussian distribution with mean and variance [24] for large . The larger the concentration of recoil directions towards the larger these statistics will be. The probability distribution function of and as a function of for the null hypothesis of an isotropic recoil spectrum has to be calculated by Monte Carlo simulation for small values of .
For 2-d data we found in Ref. [14] that the most powerful test is the Rayleigh test which uses the mean resultant length of the projected recoil vectors which, modulo fluctuations, should be zero for data drawn from an isotropic distribution. For 2-d vectors, parameterized in terms of the angle (relative to some arbitrary fiducial direction), if we define
| (5) | |||||
| (6) |
then the resultant length of the sum of the vectors, , is given by and the mean resultant direction is . The modified Rayleigh [25] statistic , defined as [26, 27]
| (7) |
has the advantage of approaching its large asymptotic distribution for smaller values of than . Under the null hypothesis that the distribution from which the sample of angles is drawn is isotropic, is asymptotically distributed as with error of order [27]. With axial data (i.e. unsigned lines) the standard procedure [28, 29] is to double the axial angles, reduce them modulo and analyze the resulting vector data.
For each detector configuration we calculate the probability distribution of the relevant statistic, for a given number of events , by Monte Carlo generating experiments each observing recoils drawn from our simulated 3-d or 2-d distributions. We then compare this with the null distribution of the statistic, under the assumption of isotropy calculated using the analytic expression for the 2-d Rayleigh test and by Monte Carlo simulation for the 3-d test. Specifically we calculate the rejection and acceptance factors, and , at each value of the statistic. The rejection factor is the probability of measuring a value of the statistic less than if the null (isotropic) hypothesis is true or equivalently the confidence with which the null hypothesis can be rejected given that measured value of the statistic. The acceptance is the probability of measuring a value of the statistic larger than if the alternative hypothesis is true or equivalently the fraction of experiments in which the alternative hypothesis is true that measure a larger absolute value of the test statistic and hence reject the null hypothesis at confidence level . Clearly a high value of is required to reject the null hypothesis. A high is also required, otherwise any one experiment might not be able to reject the null hypothesis at the given or the null hypothesis might be erroneously rejected. We therefore find, using a search by bi-section, the number of events required for and . A single experiment could in reality be lucky/unlucky and need less/more events to detect a signal, but this procedure gives a well defined indication of the number of events which will be required. For further details see Appendix C of Ref. [13].
4 Results
As our baseline optimistic, but realistic, detector configuration we consider a detector with 3-d vector (i.e. with recoil sense measurable) read-out, energy threshold keV, no background () and with the uncertainty in reconstructing the recoil directions taken into account. One or two of these specifications are varied in each of the alternative configurations. We consider two improved (and unrealistic) configurations, one with keV and one with perfect recoil reconstruction (since the recoil reconstruction can not be taken into account for 2-d read-out, the number of events required for 2-d read-out should be compared with this later 3-d configuration). We also consider a number of ‘degraded’ configurations: 2-d read-out, axial read-out, a larger energy threshold and non-zero background. For the 2-d read-out we consider both the raw angles and the reduced angles (with the projected direction of solar motion subtracted). We parameterize non-zero background in two different ways: variable signal to noise and variable background rate. Throughout we assume, for illustrative purposes, a WIMP mass of .
| difference from baseline configuration | ||
|---|---|---|
| none | 7 | 11 |
| keV | 13 | 21 |
| no recoil reconstruction uncertainty | 5 | 9 |
| keV | 5 | 7 |
| keV | 3 | 5 |
| 8 | 14 | |
| 17 | 27 | |
| 99 | 170 | |
| 3-d axial read-out | 81 | 130 |
| 2-d vector read-out in optimal plane, raw angles | 18 | 26 |
| 2-d axial read-out in optimal plane, raw angles | 1100 | 1600 |
| 2-d vector read-out in optimal plane, reduced angles | 12 | 18 |
| 2-d axial read-out in optimal plane, reduced angles | 190 | 270 |
Table 1 gives the details of the configurations considered and the number of events above the energy threshold required to reject isotropy (and hence detect a WIMP signal) at 90 (95) confidence in 90 (95) of experiments. The variable background rate configurations are not included in this table as in this case the number of events depends on the signal rate, and hence the cross-section. For the non-zero background cases we use a slightly different procedure to that described above, since the background and signal are both Poisson processes. In these cases for each value of the cross-section, we search for the required exposure by using the exposure, cross-section and signal to noise ratio (or background rate) to calculate the mean number of signal and background events. We then draw the number of signal and isotropic background events for each of the experiments from Poisson distributions and calculate both the null and alternative distributions of the test statistic by Monte Carlo simulation. This procedure is not rigorously justified from a statistical point of view, but should not introduce significant bias/error.

In Figs. 3-7 we plot the exposure required to accumulate the required number of events for a 95 confidence detection in 95 of experiments as a function of of the WIMP-nucleon elastic scattering cross-section using the relationship
| (8) |
where is the total event rate above threshold energy, per unit cross-section, assuming a fiducial local WIMP density (the required exposure is inversely proportional to the local density). For the benchmark value , , while for and , and respectively 111The event rates, especially for large threshold energies, depend on the Galactic escape velocity which is not well known. This dependence is not particularly strong and does not effect the conclusions of this work significantly.. In each figure the solid line is the benchmark configuration (zero background, , 3-d vector read out), dashed lines are degraded configurations and dotted lines (where relevant) are unrealistic, optimistic configurations.

Figs. 3 and 4 show the effects of varying the energy threshold on the exposure required to reject isotropy. Fig. 3 shows the variation of the exposure with cross-section for four values of the energy threshold ( and ) while Fig. 4 shows the variation with threshold energy for cross-section . As was pointed out by Spergel in the first paper on WIMP directional detection [3] there are two competing effects. The anisotropy of the recoils increases with increasing energy, so that the number of events required decreases, however the recoil rate also decreases. We find that the net effect is that the required exposure is fairly constant for and then increases with increasing threshold energy. As the number of events required is an integer the detailed variation of the exposure, in particular at large threshold energies where there are step-like variations, is not particularly significant. As a rough indication, above a decrease in the energy threshold decreases the exposure required by roughly . The quantitative variation of the exposure will depend on the detector composition, however we expect that this qualitative behaviour is fairly generic. Note that we have assumed in Fig. 4 that the recoil directions can be reconstructed down to . In reality it will be difficult, if not impossible, to reconstruct the direction of low energy recoils due to their short path-lengths.

Fig. 5 shows the variation of the exposure with cross-section for background rates of and . In each case the exposure curve follows the zero-background exposure curve at large cross-sections (where the signal rate is much larger then the background rate) before rising above the zero background curve, at first (when the signal and background rates are comparable) gently and then (once the background rate is much greater than the signal rate) more rapidly. For fixed signal to noise ratio the number of events required is independent of cross-section and the corresponding exposure lines would lie parallel to the zero-background exposure line. When the background rate is the same as the signal rate the number of events, and hence the exposure, required is increased by a factor of . When the background is an order of magnitude bigger than the signal rate the increase is a factor of .

Fig. 6 shows the effects of the recoil reconstruction uncertainty and axial read-out in 3-d. The improvement which would come from perfect recoil reconstruction is relatively small, of order ten per-cent. If the read-out is axial rather than vectorial however, the exposure required is increased substantially, by more than an order of magnitude.

Fig. 7 compares 2-d read-out (vector and axial, and using raw and reduced angles) with 3-d read out. When the raw angles are used the exposure required is increased by a factor of for vectorial data, and by two orders of magnitude for axial data. Smaller exposures, in particular for axial data, can be achieved by using the reduced angles, which are measured relative to the (projected) direction of solar motion. Relative to 3-d vector read-out, the exposure using reduced angles is increased by a factor for 2-d vector/axial read-out. These numbers are for read-out in the optimum plane, and are independent of the detector’s geographical location. Read-out in other planes would lead to larger exposures by up to a factor of a few for vectorial raw and reduced angles and axial reduced angles and up to an order of magnitude for axial raw angles [14]. As the geographic location of the detector influences the orientation of these planes, the exposures for non-optimal planes vary by of order tens of per-cent between Boulby, Sudbury and Kamioka [14]. We should caution that the results for 2-d read-out assume a detector with perfect angular resolution. The projective effects of a 2-d read-out will make this a more significant factor than for 3-d read-out.
5 Conclusions
We have examined the effects of the detector properties on the number of events, and hence exposure, required to reject isotropy of recoil directions, and hence identify a putative WIMP signal as Galactic in origin. Specifically we have considered the nuclear recoil energy threshold, the background rate, 2-d and 3-d read-out and whether or not the sense of the recoils can be measured. Our simulations are for a TPC detector filled with . We expect that results for other directional detectors would be qualitatively similar.
We took a detector with 3-d vector read-out, energy threshold keV, no background (), with the uncertainty in reconstructing the recoil directions taken into account, as our baseline realistic detector configuration and then varied one or two of these properties at a time. The property which has the largest effect on the exposure required is whether or not the sense of the recoils can be measured. If the data is axial (i.e. the sense can not be measured) the exposure is increased by one order of magnitude for 3-d read-out and two orders of magnitude for 2-d read-out compared to the baseline detector. With 2-d read-out this can be improved to a factor if the reduced angles (with the direction of solar motion subtracted) are calculated and analyzed. If the read-out is 2-d, and the senses can be measured, the exposure is increased by a factor of over the baseline. Once more this can be reduced, to a factor of , by using the reduced angles. These figures are for 2-d read-out in the optimal plane, which has normal perpendicular to the Earth’s spin axis. For other read-out planes the required exposures are larger, and location dependent (see section 3 and Ref. [14] for further information). We also caution that the results for 2-d read-out assume perfect angular resolution, and projection effects will make this a more significant factor than for 3-d read-out. Estimates based on the projected length of recoil tracks in the planes indicate that the required exposure would increase by at least a factor 2 [14].
The effect of non-zero background depends on the underlying signal rate. If the signal and background rates are the same the exposure, relative to that for zero background, is increased by a factor of . If the background rate is an order of magnitude larger than the signal rate the increase is a factor of . As the signal to noise ratio is reduced below 0.1 the detection of the signal anisotropy becomes extremely challenging.
As the energy threshold is increased the WIMP recoil signal becomes increasingly anisotropic and the number of events required decreases. However the event rate decreases and the net effect is that the exposure required increases with increasing energy threshold above . The exposure increases by a factor for every increase in the energy threshold. Below the exposure is roughly independent of the threshold energy. In practice achieving such low energy thresholds is not possible; the path lengths of low energy recoils are too short for the directions to be measured. We also caution that the actual ‘energy threshold’ of a directional detector is the maximum of the detection, discrimination and direction reconstruction thresholds.
In summary the property with the biggest effect on the detector performance is whether or not the sense of the recoils can be measured. For 2-d read-out the performance, in particular if the senses can not be measured, can be significantly improved by recording and analyzing the reduced angles (with the projected direction of solar motion subtracted). The background rate effectively places a lower limit on the WIMP cross-section to which the detector is sensitive; it will be very difficult to detect a WIMP directional signal with a recoil rate more than an order of magnitude below the background rate. If the energy threshold is larger than about 20 keV significant improvements in the exposure required can be made by reducing the energy threshold (i.e. a factor of 2 if is reduced from to and a factor of 5 if it is reduced from to ).
References
- [1] M. W. Goodman and E. Witten, Phys. Rev. D 31, 3059 (1985).
- [2] A. K. Drukier, K. Freese and D. N. Spergel, Phys. Rev. D 33, 3495 (1986); K. Freese, J. Frieman and A. Gould, Phys. Rev. D 37, 3388 (1988).
- [3] D. N. Spergel, Phys. Rev. D 37, 1353 (1988).
- [4] G. Jungman, M. Kamionkowski and K. Griest, Phys. Rep. 267, 195 (1996).
- [5] J. D. Lewin and P. F. Smith, Astropart. Phys. 6, 87 (1996).
- [6] H. Kraus et al., Phys. Lett. B 610, 37 (2005).
- [7] D. P. Snowden-Ifft, C. J. Martoff, and J. M. Burwell, Phys. Rev. D 61, 1 (2000). Available from: astro-ph/9904064.
- [8] G. J. Alner et al., Nucl. Inst. and Meth. A. 535, 644 (2004).
- [9] T. Tanimori et al., Phys. Lett. B 578, 241 (2004). Available from: astro-ph/0310638.
- [10] C. J. Martoff, electronic proceedings of SNIC06 Symposium, California, 3-6 July 2006. Available from: http://www-conf.slac.stanford.edu/snic/papers/0188.PDF
- [11] C. J. Copi, J. Heo and L. M. Krauss, Phys. Lett. B 461, 43 (1999). Available from: astro-ph/990449; C. J. Copi and L. M. Krauss, Phys. Rev. D 63, 043507 (2001). Available from: astro-ph/0009467.
- [12] M. J. Lehner et al., Dark Matter in Astro and Particle Physics, Proceedings of the International Conference DARK2000, Heidelberg, Germany, 2000, p590 ed. H. V. Klapdor-Kleingrothaus, Springer-Verlag (2001).
- [13] B. Morgan, A. M. Green and N. J. C. Spooner, Phys. Rev. D 71 103507 (2005). Available from: astro-ph/0408047.
- [14] B. Morgan and A. M. Green, Phys. Rev. D 72, 123501 (2005). Available from: astro-ph/0508134.
- [15] C. J. Copi, L. M. Krauss, D. Simmons-Duffin and S. R. Stroiney, astro-ph/0508649.
- [16] D. Stiff and L. M. Widrow, Phys. Rev. Lett. 90, 211301 (2003). Available from: astro-ph/0301301.
- [17] B. Moore et al., Phys. Rev. D 64, 063508 (2002). Available from: astro-ph/010627.
- [18] R. Bellanzini and G. Spandre, Nucl. Inst. and Meth. A. 513, 231, (2003).
- [19] T. Ohnuki, D.P. Snowden-Ifft and C.J. Martoff, Nucl. Inst and Meth. A. 463, 142, (2001).
- [20] J. F. Ziegler, J. P. Biersack and U. Littmark, The stopping and range of ions in solids, Pergamon Press (1985), http://www.srim.org.
- [21] D.P. Snowden-Ifft, T. Ohnuki, E.S. Rykoff and C.J. Martoff, Nucl. Inst and Meth. A. 498, 155, (2003).
- [22] B. Morgan, Dark Matter Detection With Gas Time Projection Chambers, Ph.D. Thesis, University of Sheffield, 2004.
- [23] M. J. Carson et al., Nucl. Inst. and Meth. A. 546, 509 (2005). Available from: hep-ex/0503017; M. J. Carson et al., Astropart. Phys. 21, 667 (2004).
- [24] M. S. Briggs, Astrophys. J. 407, 125, (1993).
- [25] Lord Rayleigh, Phil. Mag. 10, 73 (1880); Nature 72, 318 (1905); Phil. Mag. 37, 321 (1918).
- [26] G. M. Cordeiro and S. Ferrari, Biometrika 78, 573 (1991).
- [27] K. V. Mardia and P. Jupp, Directional Statistics, Wiley, Chichester (2002).
- [28] W. C. Krumbein, J. Geology 47, 673 (1939)
- [29] N. I. Fisher, Statistical analysis of circular data, CUP, (1993). .