The detection of the ()=(18,18) line of NH3 ††thanks: Based on observations with the 100-m telescope of the MPIfR (Max-Planck-Institut für Radioastronomie) at Effelsberg.
Abstract
Aims. A study of the metastable ()=(18,18) line of ammonia (NH3) is presented aiming at better defining the physical properties of molecular gas in extreme environments.
Methods. The spectra were collected with the Effelsberg 100-m telescope and are analyzed in combination with other data using a rotation diagram (Boltzmann plot).
Results. The first astronomical detection of the metastable () = (18,18) line of NH3 is reported. This is the NH3 line with by far the highest energy, 3130 K above the ground state, detected in interstellar space. It is observed in absorption toward the galactic center star forming region Sgr B2. There is a clear detection toward Sgr B2 (M) and a likely one toward Sgr B2 (N). An upper limit for emission is determined for Orion KL. If we combine the (18,18) line results from Sgr B2 (M) with the previously measured (12,12) absorption line, we find a rotation temperature, , of 1300 K for the absorbing cloud. This is at least a factor of two higher than previously derived values from less highly excited ammonia lines. gives a lower limit to the kinetic temperature. There is a hot low density gas component in the envelope of Sgr B2. It is possible that the (18,18) line arises in this region. The radial velocity of the low density, hot envelope is the same as that of the dense hot cores, so the (18,18) line could also arise in the dense hot cores where non-metastable () absorption lines from energy levels of up to 1350 K above the ground state have been observed. A discussion of scenarios is presented.
Key Words.:
ISM: molecules – ISM: clouds – ISM: individual objects: Sgr B2, Orion-KL – Stars: formation – Galaxy: center – Radio lines: ISM1 Introduction
A number of vibrationally or torsionally excited molecules have been detected in the interstellar medium, among them H2, CS, HCN, NH3, SiO, HN, CH3CN, CH3OH, C2H3CN and CH3CH2CN (e.g. Menten et al. 1986; Ziurys & Turner 1986; Mauersberger et al. 1988; Hauschildt et al. 1993; Nummelin & Bergman 1999; Mehringer et al. 2004). These lines often trace the hottest gas, where molecules can still survive, and thus serve as useful probes of the physical conditions of star forming regions. Particularly attractive are ‘hot core’ environments, with temperatures and densities in excess of 100 K and 105 cm-3, respectively. Here young massive stars heat the surrounding dust and gas and modify the chemical composition of the latter.
There are, however, also lines in the vibrational ground state, matching or even surpassing the excitation requirements for some of the vibrationally excited transitions seen in hot cores. With the Kuiper Airborne Observatory, Watson et al. (1980) detected the CO =21–20 and 22–21 lines in Orion KL, corresponding to an energy of 1200 K. Observations of ammonia (NH3) with the Effelsberg 100-m radio telescope yielded detections to the ()=(14,14) inversion transition toward Orion KL and Sgr B2. These lines arise from energy levels 1950 K above the ground state (Hüttemeister et al. 1995).
Ammonia provides an excellent possibility to observe highly excited transitions since inversion transitions (=0, =0) across a () doublet are located in a band ranging from about 20 to 50 GHz. Ammonia is one of the most interesting tracers of the physical properties of dense interstellar gas. It is an excellent diagnostic of kinetic temperature, , over a wide range of densities. To a lesser extent, NH3 is a probe of H2 density, (H2). Inversion lines arise from either non-metastable () or metastable (=) levels. The non-metastable levels can decay via allowed rotational transitions in the infrared (IR) with (=1, =0) and have very short lifetimes. Thus, non-metastable lines require exceptional excitation conditions such as very large densities or intense IR radiation fields. In contrast, metastable (=) inversion lines arise from () doublet levels at the bottom of a ladder, so cannot rapidly decay to other levels. Radiative transitions between metastable levels are first order forbidden, so the populations of these levels are exchanged by collisions. By combining column densities of different metastable levels, one can obtain an estimate of , which is a lower limit to . The value of the excitation temperature, , across an inversion doublet will be one half of when (H2) 104 cm-3 (see e.g. Rohlfs & Wilson 2003 for details).
In this paper, we report the first detection of the (18,18) inversion line, toward Sgr B2 (M). We also present a likely detection toward Sgr B2 (N) and an upper limit for Orion KL. We interpret the data using comparisons with previous results involving lines of lower excitation.
2 Observations
All data were taken with the 100-m radio telescope of the MPIfR at Effelsberg on July 24 and 26, 1998. At the line frequency, = 46.123297 GHz, the Full Width to Half Power (FWHP) beamsize is (212)″, determined from observations toward PKS 1830–211 (typical elevations 15∘–18∘) and 3C 273 (30∘–35∘). A single polarisation HEMT receiver ( 70 K) at the primary focus provided system temperatures of 250–500 K on a scale with a characteristic sensitivity of 0.5 K/Jy and beam and aperture efficiencies of 33% and 16%, respectively. The backend was an autocorrelator (”AK90”) with eight spectrometers, each containing 512 channels and covering 40 MHz. The channel separation was 0.5 km s-1.
Spectral line measurements were interspersed with continuum measurements. The procedure was first to carry out a pointing cross scan on Sgr B2 (M), correct the telescope pointing, and then measure a number of spectra. Spectra were measured by first taking data at a position at an offset of –3m in Right Ascension for 3 minutes, then repeating this procedure toward the source. For each scan, the final spectrum is the difference between on- and off-source measurement divided by the off-source measurement. For a number of scans, we shifted the radial velocities to make certain that the lines found are not caused by instrumental effects.
Sgr B2 rises to a maximum elevation of 11∘, so for this source calibration of spectral line data was accomplished by measurements of its strongest continuum source, Sgr B2 (M). With an observed FWHP of (232)″ the source appears to be slightly resolved. Adopting a 46.12 GHz continuum flux density of 20 Jy, measured at 43 GHz with a FWHP of 39″ by Akabane et al. (1988), assuming that the entire flux density is within our beam, and accounting for the difference between beam size and FWHP of the source, the resulting peak continuum temperature becomes 25 K in units of main beam brightness temperature. This peak continuum temperature was used to determine the line brightness temperature for Sgr B2 (M) from our measured line-to-continuum ratios. For Sgr B2 (N), we have no reliable continuum measurement, so a continuum flux density ratio of Sgr B2 (M) to (N), 1.8 (e.g. Akabane et al. 1988; Hüttemeister et al. 1993), was used to determine its peak main beam brightness temperature. The absolute calibration uncertainty of the continuum data is about 20% for Sgr B2 (M) and 30% for Sgr B2 (N). For the line data, see Sect. 3.
Orion KL rises to a maximum elevation of 34∘ at Effelsberg. Pointing scans were made toward PKS 0420-01 and 3C 161, but there is no nearby calibrator. For calibration we have therefore used NGC 7027, assuming a flux density of 5 Jy (Ott et al. 1994), correcting for the source size of 7″10″(also Ott et al. 1994) and accounting for differences in elevation applying the formula111see www.mpifr-bonn.mpg.de/div/effelsberg/calibration/calib.html given by A. Kraus. For Orion KL, the calibration uncertainty is of order 15%.
A search of the JPL molecular line catalog showed that there were only very rare species within 10 MHz (=65 km s-1) of the (18,18) transition. Given the intensity of the lines (see Table 1), we conclude that there is no accidental line overlap.

3 Results
As already indicated (Sect. 1), the extensive NH3 data sets of Hüttemeister et al. (1993, 1995) show absorption in the metastable inversion lines of Sgr B2 up to the (14,14) line. Thus we would also expect absorption in the (18,18) metastable line. The profiles in Fig. 1 show good agreement with the line parameters and of previous data. We claim a definite detection toward Sgr B2 (M), where there is a good signal-to-noise ratio, and a likely detection toward Sgr B2 (N), while Orion KL remains undetected. At 3130 K above the ground state (the energy difference between the two states of the inversion doublet is only 2.2 K), the (18,18) transition is by far the highest excited ammonia line ever detected in the interstellar medium. The previously measured (14,14) lines in the vibrational ground state and the (2,1)–(1,1) transition in the vibrationally excited state (Wilson et al. 1993; Hüttemeister et al. 1995; Mauersberger et al. 1988) are, with 1945 and 1400 K, located far below the (18,18) inversion doublet reported here.
Only a small fraction of the continuum background is absorbed by the () = (18,18) lines so that, assuming a source covering factor of unity, the lines are optically thin and optical depths can be directly obtained from the line-to-continuum ratio, /. Sgr B2 (M) and (N) were observed twice (Sect. 2). Line intensity ratios between the two sources are 2.90.7 and 2.71.1 for the first and second measurement, respectively. The good agreement between these two ratios as well as a continuum flux density ratio of 1.8 (Sect. 2) then suggest that the optical depth of the (18,18) line is higher toward Sgr B2 (M). There is not only excellent agreement between Sgr B2 (M) to (N) line intensity ratios. Radial velocities and linewidths of Sgr B2 (M) and (N) are also almost identical for each observing epoch. Comparing, however, the spectra from the first with those of the second observing period, there are striking differences. The data taken on July 26, 1998, show amplitudes that are lower by factors of 2–3, velocities that are lower by 5 km s-1 and linewidths that are reduced by 40% (Table 1). While this is readily explained by pointing problems affecting the July 26 data (for a point source, this would correspond to an offset of 12″), we will nevertheless use both results, (1) to derive a definite lower limit of in Sect. 4 and (2) to more thoroughly discuss the nature of the source in Sect. 5. Fig. 1 shows the spectra obtained on July 24, 1998.
| (1) | (2) | (3) | (4) | (5) | (6) |
|---|---|---|---|---|---|
| Source | |||||
| (K) | (km s-1) | ||||
| Sgr B2 (M)b) | 25 | 2.00.4 | 0.0800.015 | 692 | 334 |
| 0.80.2 | 0.0310.007 | 642 | 193 | ||
| Sgr B2 (N)b) | 14 | 0.70.1 | 0.0500.009 | 712 | 334 |
| 0.30.1 | 0.0200.007 | 662 | 205 | ||
| Orion KLc) | 0.1 | — | — | — | |
Continuum () and line temperatures () are given on a main beam brightness temperature scale (; for details, see Sect. 2). denotes the apparent optical depth (for a definition, see the caption to Fig. 1), marks the Local Standard of Rest velocity and gives the Full Width to Half Power (FWHP) linewidth.
Data taken on July 24, 1998 (upper line), and July 26, 1998 (lower line). Among the two sets of gaussian parameters, we consider the second to be affected by pointing problems.
The 3 limit for a single 0.5 km s-1 wide channel is 0.2 K on a scale. The expected emission line at 5.5 km s-1 should have a width of 8 km s-1 (Wilson et al. 1993). Thus, after averaging several channels, our 3 sensitivity becomes 50–100 mK.
4 Determination of rotation temperatures
The NH3 populations are divided into ortho and para species. Only the levels with =0, 3, 6, 9, 12, 15, 18, etc., belong to ortho-NH3. While the total number of para levels is twice that of ortho levels, the total abundance of the ortho and para species is equal in Local Thermodynamical Equilibrium (LTE). A statistical weight of = 2 for the ortho- and 1 for the para-levels accounts for this. A special case is the (3,3) doublet inversion line. One half of the levels in the = ladder are missing. As a consequence, in some cases, the (3,3) doublet populations are inverted. In a few sources, masers have been found in the transition connecting the two states of the (3,3) inversion doublet (for Sgr B2, see Martin-Pintado et al. 1999). In the following we assume that the high lying ortho-NH3 doublet populations (,12) do not deviate from LTE.
Since ortho and para populations cannot be interchanged by collisions with H2, there can be deviations from their LTE abundance ratio of unity. Thus we compare the (18,18) column densities with those of the (12,12) line, the previously observed metastable ortho-NH3 transition nearest in energy, 1450 K above the ground state. For our measurements, the relevant equation relating apparent optical depth to column density of the doublet is
Here is in cm-2, and in K, in GHz and in km s-1. Using the (12,12) and (18,18) lines to estimate in a Boltzmann relation
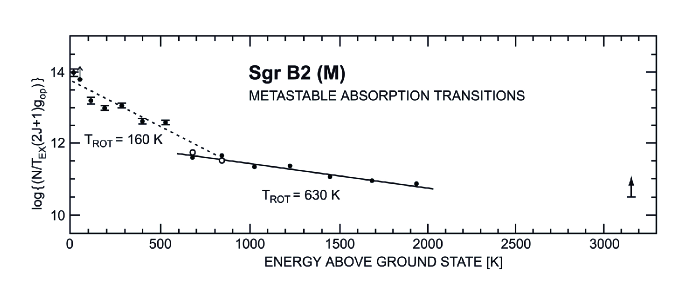
does not require any assumptions about ortho/para ratios. In Table 2 we list the column densities, the normalized column densities (i.e. column densities divided by the statistical weights, (2+1)), and the resulting rotation temperatures. In Fig. 2 we show for Sgr B2 (M) a plot of normalized column densities per excitation temperature versus energy of the level above the ground state. Implicit in this fit is the assumption that is the same for all metastable transitions. This will be discussed in Sect. 5.2.
5 Discussion
5.1 The Sgr B2 cloud
The Sagittarius B2 molecular cloud is one of the most active regions of star formation in our Galaxy. It is located about 40′ from the galactic center, at a projected distance of 100 pc for a Sun-galactic center distance of 8.5 kpc. Sgr B2 hosts three prominent cores of ionized gas, Sgr B2 (M), (N) and (S) (see e.g. Martin-Pintado et al. 1999). These are associated with molecular clouds which are in turn embedded in a much more extended, lower density envelope.
| (1) | (2) | (3) | (4) | (5) | (6) |
| Source | Column | Normalized | |||
| density | column | ||||
| density | |||||
| (12,12) | (18,18) | (12,12) | (18,18) | ||
| (cm-2/K) | (K) | ||||
| Sgr B2 (M) | 5.6(12) | 1.0(13) | 1.1(11) | 1.3(11) | 1300 |
| 2.2(12) | 3.0(10) | 1300 | |||
| Sgr B2 (N) | 1.5(13) | 6.2(12) | 2.9(11) | 8.4(10) | 1350 |
| 1.5(12) | 2.0(10) | 600 | |||
| Orion KL | 2.6(13) | 3.0(12) | 5.2(11) | 4.1(10) | 500 |
The (12,12) data for Sgr B2 were taken from Table 2 of Hüttemeister et al. (1995). As in Table 1 of this paper, the higher and lower (18,18) column densities refer to the data taken on July 24 and 26, 1998, respectively (see also Sect. 3). Errors are not given, because a comparison between the two epochs provides a good measure of the extremes involved. For Orion KL, the (12,12) column density was taken from Wilson et al. (1993). For the (18,18) column density optically thin emission, =0.1 K and a FWHP linewidth of = 8 km s-1 was assumed. The given rotation temperature also accounts for the fact, that Wilson at al. calculated column densities averaged over a 29″ beam, while the (18,18) upper limit is an average over a 21″ beam.
For Sgr B2, the geometry of the molecular clouds and continuum sources is important. There are compact radio continuum sources absorbed by NH3 inversion lines. The telescope beam of the Effelsberg 100-m dish is larger than these continuum sources and the associated hot cores, but smaller than the NH3 containing cloud in the molecular envelope of Sgr B2 (see e.g. H93 for details of this geometry and 40″ images of NH3 lines).
For the NH3 () = (1,1), (2,2), (3,3), (4,4), (5,5), (6,6) and (7,7) metastable inversion lines, there is absorption toward Sgr B2 (M) and (N), and emission one full beamwidth, 40″, off the continuum sources. H93 assumed that this is due to a uniform extended layer of NH3. In this case, the main beam brightness temperature of the continuum source, , is larger than the excitation temperature, , of the line. Given a uniform NH3 cloud, more extended than the radio telescope beam and calculated collision rates (Danby et al. 1988), one can determine values for (H2). From such models, H93 had estimated (H2)3 103 cm-3. Since radiative transitions across ladders are forbidden, the relation of is close to but less than ; this is not strongly dependent on H2 densities. Thus, from measurements of a number of metastable NH3 absorption lines, one estimates that = 160 K in the envelope of Sgr B2 (Fig. 2). Hüttemeister et al. (1995) carried out measurements of the (8,8), (9,9), (10,10), (11,11), (12,12), (13,13), and (14,14) metastable inversion lines toward Sgr B2 (M) and (N). For SgrB2(M), 600 K (Fig. 2). Toward the continuum sources these lines were found in absorption. Because of the weakness of the lines, there were no measurements of off-source positions, where emission corresponding to the absorption would be expected as with the (1,1) to (7,7) lines.
The rotational transitions of NH3 produce lines in the far infrared (FIR). An extensive study of these FIR lines has been carried out using the ISO (Infrared Space Observatory) LWS (Long Wavelength Spectrometer) with / 8000 and a beam size of 80″ (Ceccarelli et al. 2002). Twenty-one NH3 lines in the wavelength range between 47 and 196m were detected, all of them in absorption. Of these, 13 lines involve metastable levels, while 8 connect non-metastable levels. As Ceccarelli et al. (2002) point out, their lines absorb the spatially extended FIR dust continuum rather than the more compact free-free continuum absorbed by the centimeter wavelength inversion lines. This may account for some of the differences between inversion line results and the FIR line data. Ceccarelli et al. (2002) have presented a model for their data. This involves an absorbing layer 1.150.15 pc in front of the FIR continuum source. This layer has a kinetic temperature of 700100 K and an H2 density of 105 cm-3. From the non-detection of FIR CO lines, Ceccarelli et al. (2002) surmise that (H2) 104 cm-3. Oka et al. (2005) deduce H2 densities of order 102 cm-3 in the galactic center region, so the envelope of SgrB2 may have even lower densities.
As with the other extended molecular clouds in the galactic center region, dust in the envelope of Sgr B2 is comparatively cold, with dust temperatures, , of order 70 K. Thus in the envelope of Sgr B2, non-metastable levels of NH3 cannot be populated by collisions or IR fields. In addition to the envelope, however, there are a number of hot, dense, compact cores. For SgrB2(M), these have the same radial velocities as the envelope. In the cores, the populations of non-metastable levels can be significant. From maps of the (2,1), (3,2), (4,3), (5,4) and (4,2) non-metastable inversion emission lines, H93 found that the warm envelope has a FWHP size of 1′. These lines arise from energy levels up to 300 K above the ground state. Measurements of non-metastable lines from energy levels between 400 and 700 K above the ground state show a mixture of absorption and emission. Above 700 K, there is only absorption.
H93, de Vicente et al. (1997), Ceccarelli et al. (2002) and Comito et al. (2003) proposed scenarios for Sgr B2 including (1) compact hot cores with 200 K and (H2)3 107 cm-3, (2) a more extended warm envelope with 40 K and (H2)3 105 cm-3, and (3) a very extended hot envelope with 200 K and (H2)104 cm-3. In view of the metastable NH3 inversion line data of Hüttemeister et al. (1995) and the FIR line data of Ceccarelli et al. (2002), the of at least a part of the hot envelope should be raised to 600–700 K.
5.2 Relevance of the ()=(18,18) line
The most definite new result is the detection of the ()=(18,18) line in absorption toward Sgr B2 (M). There are two possible interpretations:
(1) As with the (1,1) to (7,7) lines, the (18,18) line arises in the extended envelope and is sub-thermally excited, or
(2) the (18, 18) line is thermalized and arises in a region close to the Hii regions in Sgr B2. After discussing the assumption of LTE used in Table 2 and Fig. 3, these scenarios will be analyzed in more detail.
With 1300 K (Table 2), the () = (18,18) line reveals a molecular gas component with a kinetic temperature clearly exceeding the 600–700 K estimated by Hüttemeister et al. (1995) and Ceccarelli et al. (2002). Before reaching a conclusion, however, we should ask whether the values of the various metastable inversion lines are really the same. Does the assumption of LTE hold? One can use the off-peak line and continuum results to show that the value of for the (1,1) line is 6 K. A calculation using a two level model for metastable levels with a constant collision rate and the Einstein A coefficients shows that the excitation temperatures across metastable levels decrease from 6 K for the (1,1) levels to slightly more than 3 K for the (18,18) levels. Our fit to the normalized column densities in Fig. 2 is based on the assumption that the value of is the same for each line. If the value of does follow the simple relation discussed previously, the normalized column densities will decrease more steeply than shown in Fig. 3 with increasing value. This will lead to a lowering of the values obtained (Table 2; Fig. 3) by about 20%; however will still be 1000 K.
In Fig. 2, there is a clear gradient in the values of . Wilson et al. (1993) found a similar effect for the high density region Orion KL. This was interpreted as a gradient in . We note, however, that in a warm enviroment radiative transfer simulations predict higher values, gradually approaching , for higher metastable levels even if the gas is characterized by a single kinetic temperature (see Walmsley & Ungerechts 1983; Danby et al. 1988; Flower et al. 1995). The situation for SgrB2 (M) may be more complex than that for Orion KL. The lower energy (7) metastable absorption lines shown in Fig. 2 definitely arise from the envelope, but the higher lying lines might arise in hot cores.
There are several arguments suggesting that the ()=(18,18) emission arises in a warm, extended low density envelope:
(1) Absorption with similar apparent optical depths is seen from the lowest to the highest metastable inversion lines toward both Sgr B2 (M) and (N). This includes the (18,18) line. Not a single other galactic star formation region shows a similarly excited NH3 absorption component so that statistically it appears unlikely that Sgr B2 hosts two such clouds. With Sgr B2 (M) and (N) being separated by only 47″ (2 pc), it is not farfetched to assume that the absorption is caused by a single cloud with an extent of at least an arcminute.
(2) Maps made in the lower () transitions up to the (7,7) line (see Sect. 5.1) reveal emission surrounding the radio continuum sources that appears to arise from the same low density gas component as the gas measured in absorption. Lack of evidence for such emission in 7 metastable lines does not argue against this scenario, since such emission is weak and would be difficult to detect.
(3) Galactic disk molecular clouds extending over 2 pc are commonly characterized by a low density. The cloud size-density relation of Larson (1981; his eq. 5) suggests (H2)103 cm-3. Although an extension of this relation for the galactic disk to galactic center clouds with their larger linewidths may not be justified, this is exactly the density that is required for absorption to dominate in a 30″ – 40″ beam (see Sect. 5.1) that characterizes most ammonia measurements obtained at Effelsberg.
These arguments lead one to associate the (18,18) line with warm, extended, low density gas. However a scenario favoring a hot core origin cannot be excluded:
(1) , averaged over a few arcseconds only, is of order 1000 K (for detailed continuum maps, see e.g. Gaume & Claussen 1990; De Pree et al. 1998). Thus the absorption may arise from compact hot regions of high density (100 K) directly associated with the hot cores.
(2) Radial velocities of the dense, compact hot cores and less compact lower density envelope are nearly the same and it is not possible to separate their contributions kinematically.
(3) While it is sometimes argued that the lack of absorption in the () = (3,2), (4,3) and (7,6) VLA data of Vogel et al. (1987) excludes any compact high density absorbing cloud, the single-dish data of H93 show that absorption dominates the highly excited non-metastable transitions including the (7,6) line toward Sgr B2 (M). These lines must arise (see Sect. 5.1) from small regions that can only be slightly more extended than the radio continuum emission.
(4) A comparison of our data from July 24 and 26 shows systematic differences in the Sgr B2 (M) and (N) absorption profiles (Sect. 3), affecting more the high than the low velocity part of the spectra. This suggests that lower (65 km s-1) and higher (80 km s-1) velocity components are not smoothly distributed.
A number of heating sources have been proposed for the galactic center region. These include PDRs (Photon Dominated or Photo Dissociation Regions; e.g. Goicochea et al. 2004), shocks (e.g. Flower et al. 1995; Ceccarelli et al. 2002), XDRs (X-ray Dominated Regions; e.g. Martín-Pintado et al. 2000), cosmic rays (e.g. Güsten at al. 1981) and the dissipation of supersonic cloud motions (e.g. Wilson et al. 1982; Hasegawa et al. 1994). In Sgr B2, several of these mechanisms are at work. Since kinetic temperatures in excess of 1000 K are not widespread (2 pc), the latter two mechanisms will not be dominant for the gas traced by the NH3 () = (18,18) line. Due to its low threshhold for photoionization (4.1 eV; Suto & Lee 1983) NH3 is rapidly destroyed by UV radiation and PDRs can also be excluded (for NH3 in the ‘PDR galaxy’ M 82, see Weiß et al. 2001; Mauersberger et al. 2003). While detailed models for NH3 being exposed to a strong X-ray radiation field have yet to be reported, shocks are widespread in the galactic center region (e.g. Hüttemeister et al. 1998), can release NH3 from grain mantles and can heat the gas to 1000 K and more (see Rizzo et al. 2001 for NH3 in a cloud apparently being shocked by the wind of a Wolf-Rayet star). Martín-Pintado et al. (1999) have found evidence for ring like structures in NH3 in the envelope of Sgr B2. It may be that the (18,18) emission could arise from such structures, although the values obtained from lines with 4 are less than 200 K.
Shocks imply that large amounts of water vapor should also be produced. Simulations using shock models can reproduce the observed NH3 column densities up to the (14,14) line (Flower et al. 1995; their Table 4). These models also predict water vapor column densities of (H2O) 1018 cm-2 for the envelope. From HO absorption line measurements and radiative transfer calculations, Comito et al. (2003) derive (H2O) = 3.5 1016 cm-2 in their Hot Layer, which they identify with a part of the Sgr B2 envelope (for earlier measurements, see Neufeld et al. 2000; Ceccarelli et a. 2002). This is 30 times less than the theoretical prediction. Removing the gas seen in the (18,18) absorption line and a part of the gas giving rise to the lower metastable inversion lines from the envelope and associating it instead with the hot cores would reduce the required H2O column density in the envelope and thus might provide a better agreement between theory and observations. Whether associated with the envelope or the hot cores, our data make larger demands on the shock heating model, since the gas temperatures must be considerably higher. An open question is whether larger temperatures alone could reconcile the difference between the model predictions and measurements for the water vapor abundances in the Sgr B2 envelope.
5.3 Orion KL
Wilson et al. (1993) identified two NH3 components toward Orion KL, one with 165 K, the other with 400 K. Our upper line intensity limit to the ()=(18,18) transition is consistent with 500 K (Table 2). Thus our data agree with previous results. We conclude that, unlike Sgr B2, Orion KL does not host a detectable extremely hot NH3 component.
6 Outlook
We have observed the () = (18,18) absorption line of ammonia (NH3), arising from levels 3130 K above the ground state, definitely toward the compact Hii region Sgr B2 (M) and very likely toward Sgr B2 (N). There was no detection toward Orion KL. For the hot gas component observed in Sgr B2 there are two equally plausible scenarios, namely: (1) an extended low density envelope surrounding Sgr B2 (M) and (N) or (2) much more compact dense clouds associated with the hot cores of the star forming region. To discriminate between these possibilities, VLA observations at =7 mm are desirable.
From the point of view of excitation, the () = (18,18) line of ammonia is at the same level as the lines of the fundamental (4.7m) vibration-rotation band of CO. Both appear to trace average gas temperatures 1000 K (for CO, see e.g. Geballe & Garden 1987, 1990). Such temperatures are likely to originate in shocked gas. However, the fundamental CO band is seen in Orion but not in Sgr B2, which is opposite to what we obtained with the (18,18) line. This may be the case since the (18,18) line is only visible in absorption against the radio continuum of Sgr B2, while the geometry of the Orion molecular cloud with its foreground radio continuum source is less favorable. Also, the hot gas in Sgr B2 may be much more compact than that in the nearby Orion cloud, thus making the detection of the CO emission more difficult. Required shock velocities may also differ for NH3 and CO (for CO, see Draine & Roberge 1984). To further investigate a potential correlation between the two tracers of the hot molecular medium, a dedicated study of the =1–0 transitions of CO in Sgr B2 would be worthwhile.
The existence of an extended hot molecular envelope with more than several 100 K around Sgr B2 is unique among the star forming regions in the Galaxy. Is the presence of this envelope related to the exceptional conditions in the galactic center region? The molecular gas near the galactic center is characterized by comparatively warm temperatures and high pressures. Stellar densities tend to surpass those of the giant molecular clouds, and cloud-cloud collisions also having the potential to produce molecular debris may be more common than in other parts of the Galaxy. It is most likely that such gas is to be found in the centers of galaxies, but similar conditions in the disks of spiral galaxies cannot be excluded. Observing gravitational lenses amplifying a highly redshifted radio nucleus and jet may be the best method to find more such regions.
References
- (1) Akabane K., Sofue, Y., Hirabayashi, H., Morimoto, M., & Inoue, M. 1988, PASP, 40, 459
- (2) Ceccarelli, C., Baluteau, J.-P., Walmsley, C. M., et al. 2002, A&A, 383, 603
- (3) Comito, C., Schilke, P., Gerin, M., et al. 2003, A&A, 402, 635
- (4) Danby, G., Flower, D. R., Valiron, P., Schilke, P., & Walmsley, C. M. 1988, MNRAS, 235, 229
- (5) De Pree, C. G., Goss, W. M., & Gaume, R. A. 1998, ApJ, 500, 847
- (6) De Vicente, P., Martín-Pintado, J., & Wilson, T. L. 1997, A&A, 320, 957
- (7) Draine, B., & Roberge, W. G. 1984, ApJ, 282, 491
- (8) Flower, D. R., Pineau des Forêts, G., & Walmsley, C. M. 1995, A&A, 294, 815
- (9) Gaume, R. A., & Claussen, M. J. 1990, ApJ, 351, 538
- (10) Geballe, T. R., & Garden, R. P. 1987, ApJ 317, L107
- (11) Geballe, T. R., & Garden, R. P. 1990, ApJ 365, 602
- (12) Goicoechea, J. R., Rodríguez-Fernández, N. J., & Cernicharo, J. 2004, ApJ, 600, 214
- (13) Güsten, R., Walmsley, C. M., & Pauls, T. 1981, A&A, 103, 197
- (14) Hasegawa, T., Sato, F. Whiteoak, J. B., & Miyawaki, R. 1994, ApJ, 429, L77
- (15) Hauschildt, H., Güsten, R., & Schilke, P. 1993, in The Physics and Chemistry of Interstellar Clouds, eds. G. Winnewisser & G. C. Pelz (Springer, Berlin), p52
- (16) Hüttemeister, S., Wilson, T. L., Henkel, C., & Mauersberger, R. 1993, A&A, 276, 445 (H93)
- (17) Hüttemeister, S., Wilson, T. L., Mauersberger, R., et al. 1995, A&A, 294, 667
- (18) Hüttemeister, S., Dahmen, G., Mauersberger, R., et al. 1998, A&A, 334, 646
- (19) Larson, R. B. 1981, MNRAS, 194, 809
- (20) Martín-Pintado, J., Gaume, R., Rodríguez-Fernández, N., de Vicente, P., & Wilson, T. L. 1999, ApJ, 519, 667
- (21) Martín-Pintado, J., de Vicente, P., Rodríguez-Fernández, N. J., Fuente, A., & Planesas, P. 2000, A&A, 356, L5
- (22) Mauersberger, R., Henkel, C., & Wilson, T. L. 1988, A&A, 205, 235
- (23) Mauersberger, R., Henkel, C., Weiß, A., Peck, A. B., & Hagiwara, Y. 2003, A&A, 403, 561
- (24) Mehringer, D. M., Pearson, J. C., Keene, J., & Phillips, T. G. 2004, ApJ, 608, 306
- (25) Menten, K. M., Walmsley, C. M., Henkel, C., et al. 1986, A&A, 169, 271
- (26) Neufeld, D. A., Ashby, M. L. N., Bergin, E. A., et al. 2000, ApJ, 539, L111
- (27) Nummelin, A., & Bergman, P. 1999, A&A, 341, L59
- (28) Oka, T., Geballe, T. R., Goto, M., Usida, T., McCall, B. J. 2005, ApJ, 632, 882
- (29) Ott, M., Witzel, A., Quirrenbach, A., et al. 1994, A&A, 284, 331
- (30) Rizzo, J. R., Martín-Pintado, J., & Henkel, C. 2001, ApJ, 553, L181
- (31) Rohlfs, K., & Wilson, T. L. 2003, in Tools of Radio Astronomy, 4th edition (Springer-Verlag, Heidelberg)
- (32) Suto, M., & Lee, L. C. 1983, J. Chem. Phys., 78, 4515
- (33) Vogel, S. N., Genzel, R., & Palmer, P. 1987, ApJ, 316, 243
- (34) Walmsley, C. M., Ungerechts, H. 1983, A&A, 122, 164
- (35) Watson, D. M., Storey, J. W. V., Townes, C. H., Haller, E. E., & Hansen, W. L. 1980, ApJ, 239, L129
- (36) Weiß, A., Neininger, N., Henkel, C., Stutzki, J., & Klein, U. 2001, ApJ, 554, L143
- (37) Wilson, T. L., Ruf, K., Walmsley, C. M., et al. 1982, A&A, 115, 185
- (38) Wilson, T. L., Henkel, C., Hüttemeister, S., et al. 1993, A&A, 276, L29
- (39) Ziurys, L. M., & Turner, B. E. 1986, ApJ, 300, L19