22institutetext: Università degli Studi di Roma ”Tor Vergata” - Dipartimento di Fisica, via della Ricerca Scientifica 1, 00133 Roma, Italy
33institutetext: Université Paris-Sud, 91405 Orsay, France
Accretion Rates in Herbig Ae stars
Accretion rates from disks around pre-main sequence stars are of importance for our understanding of planetary formation and disk evolution. We provide in this paper estimates of the mass accretion rates in the disks around a large sample of Herbig Ae stars. We obtained medium resolution 2 m spectra and used the results to compute values of from the measured luminosity of the Brγ emission line, using a well established correlation between L(Brγ) and the accretion luminosity Lacc. We find that 80% of the stars, all of which have evidence of an associated circumstellar disk, are accreting matter, with rates M⊙/yr; for 7 objects, 6 of which are located on the ZAMS in the HR diagram, we do not detect any line emission. Few HAe stars (25%) have M⊙/yr. In most HAe stars the accretion rate is sufficiently low that the gas in the inner disk, inside the dust evaporation radius, is optically thin and does not prevent the formation of a puffed-up rim, where dust is directly exposed to the stellar radiation. When compared to the values found for lower-mass stars in the star forming regions Taurus and Ophiuchus, HAe stars have on average higher accretion rates than solar-mass stars; however, there is a lack of very strong accretors among them, probably due to the fact that they are on average older.
1 Introduction
Pre-main sequence stars accrete matter from their circumstellar disks for a large fraction of their life, until the disk is accreted entirely onto the star or is dissipated by a number of potentially competing processes, such as dynamical perturbations by close companions, photoevaporation by the host or nearby stars, or planet formation. Although the amount of matter accreted is small compared to the mass of the central object, accretion of matter through the disk has important consequences on the physics of the disk itself and on the properties of the planetary systems that the disk may form.
The mass accretion rate through the disk is reasonably well known for pre-mains sequence stars with masses from about one solar mass (T Tauri stars or TTS), down to brown dwarfs (BDs). Results can be found, e.g., in Gullbring et al. Gea98 (1998), Muzerolle et al. (Mea98 (1998), Mea03 (2003), Mea05 (2005)), White and Ghez (WG01 (2001)), Natta et al. (Nea04 (2004), Nea06 (2006)), Mohanty et al. (Subu05 (2005)).
It has been much more difficult to determine in stars more massive than about 1 M⊙. Recently Calvet et al. (Cea04 (2004)) obtained the accretion rate in nine young pre-main sequence stars with masses in the interval 1.5–3.7 M⊙ (intermediate mass TTS or IMTTS) using HST and optical spectra. They found an average accretion rate of M⊙/yr, with a spread of an order of magnitude at least. Muzerolle et al. (Mea04 (2004)) derived a similar value of for the M⊙ star UX Ori by fitting its Hα profile with magnetospheric accretion models.
We report in this paper measurements of the accretion rate in a large sample of Herbig AeBe objects (intermediate mass pre-main sequence stars), mostly of spectral type A (HAe). We derive the accretion rate from the luminosity of the Brγ line seen in emission in pre-main sequence accreting objects. Calvet et al. (Cea04 (2004)) have shown that the correlation between the hydrogen IR line luminosity and the accretion luminosity found in TTS and BDs (Muzerolle et al. Mea98 (1998); Natta et al. Nea04 (2004)) extends to their sample of IMTTS (see also van den Ancker vda04 (2004)). Establishing the luminosity of the hydrogen near-IR recombination lines as proxy of the accretion luminosity has been extremely important, since it has made possible to derive accretion rates with reasonably good accuracy in objects where measuring the UV veiling is challenging. This is the case, for example, of very young star-forming regions, such as Ophiuchus, where the high extinction is the limiting factor (e.g., Natta et al. Nea06 (2006)), but also of the Herbig AeBe stars, where it is difficult to separate the UV excess emission from the hot photospheric continuum.
The main purpose of this work is to estimate in objects with disks for which we are currently obtaining near-IR interferometric data with the ESO VLTI (AMBER GTO111 http://www.eso.org/observing/proposals/gto/amber/; see also Malbet et al. Malb06 (2006), Tatulli et al. Tea06 (2006)). Knowledge of is crucial for understanding the disk geometry, in particular the nature of the disk inner rim (e.g., Natta et al. Nea01 (2001); Dullemond et al. DDN01 (2001); Isella & Natta IA05 (2005)), which can only form if the accretion rate is lower than a critical value of the order of M⊙/yr (Muzerolle et al. Mea04 (2004)). For low , the inner gaseous disk is optically thin and does not prevent the direct stellar irradiation of the inner dust edge of the disk, thus giving raise to the puffed-up rim. Secondly, we are interested in comparing the results to the accretion properties of the lower-mass objects studied in Taurus and Ophiuchus. In both regions it has been found that the mass accretion rate is a strong function of the mass of the central object, increasing roughly as M⋆1.8-2.0 (e.g., Natta et al. Nea06 (2006) and references therein; but see also Clarke & Pringle CP06 (2006)). The causes of this behaviour are not understood, and are matter of debate (Muzerolle et al. Mea05 (2005); Natta et al. Nea06 (2006); Alexander & Armitage AA06 (2006); Dullemond et al. Dea06 (2006)). The HAe stars are scattered in different regions of the sky and are, on average, older than objects in Ophiuchus and Taurus; they may provide interesting information on the dependence of the disk accretion on age and environment.
The outline of this paper is as follows. The observations and data reduction are described in §2; method and results are presented in §3 and discussed in §4. Conclusions follow in §5.
2 Observations and data reduction
Medium resolution (R9000) spectra of all stars in our sample were obtained with the ISAAC spectrograph at the Antu 8.2m VLT unit telescope in service mode in spring 2004. The spectral region covered by our spectra included the Br and the H2 (1–0)S(1) lines, which was not detected in any of the objects of the sample. All spectra were obtained in moderately poor conditions (seeing 1.5 arcsec and non photometric transparency), as these were adequate for the scope of the project. As a consequence, we did not attempt to obtain an accurate flux calibration of the spectra.
The raw data were wavelength calibrated using daytime arcs and rectified using data from the ISAAC calibration plan. After aligning and coadding the dithered integrations on each target, the spectra were extracted and telluric absorption and instrumental throughput were corrected using observations of telluric standards obtained by the observatory staff during the same nights as the science observations. The details of the ISAAC calibration plan, the reduction process and the instrument characteristics can be found on the ESO web pages222http://www.eso.org/instruments/isaac.
The portion of the spectra around Brγ are shown and briefly discussed in the appendix. In each spectrum we measured the equivalent width of the Br line; the measurements are given in Tables 1 and 2, together with the 1 uncertainties.
Tables 1 and 2 report also the star name and properties. Spectral type and distance are compiled from the literature (e.g., van den Ancker et al. vda97 (1997), vda98 (1998); Testi et al. Tea98 (1998); Meeus et al. Meeus01 (2001); Rodgers Rod01 (2001); Hernandez et al. Hea05 (2005), and references therein). Extinction and luminosity are computed from the V, (B-V) magnitudes as described in Testi et al. (Tea98 (1998)); stellar masses are derived by comparing the location of each star on the HR diagram to the evolutionary tracks of Palla and Stahler (PS93 (1993)).
3 Method and results
We derive the accretion luminosity Lacc of each star from the luminosity of Brγ, following the relation derived by Calvet et al. (Cea04 (2004)) for a sample of objects ranging in mass from about 4 M⊙ to BDs:
| (1) |
where L() is the luminosity of the Brγ line emitted by the circumstellar gas. Note that Eq.(1) is an empirical relation, where Lacc is measured from the observed veiling, i.e., independently of any assumption on the origin of the Brγ emission. It has been derived from objects with L(Brγ) between and L⊙; the scatter of Lacc for any given L(Brγ) is typically a factor 3 (see also van den Ancker vda04 (2004)).
In order to compute L(), we need to extract the equivalent width of the circumstellar component of the line from the observed one. In HAe stars, the observed flux is the sum of the stellar photospheric emission, which for A stars shows broad and rather strong absorption in the hydrogen lines, of the emission of the circumstellar gas and of the emission of the disk. Following Rodgers (Rod01 (2001)), we assume that the star dominates the observed V emission. The equivalent width of the photospheric component, corrected for the K-band veiling, is computed for each object with spectral type earlier than A8 using the template spectra of Rodgers (Rod01 (2001)). For objects of later spectral type, for which we did not have spectra of template stars of suitable resolution, we compute W(Brγ)circ from the expression:
| (2) |
where W(Brγ)obs is the observed equivalent width, W(Brγ)phot the equivalent width of the photospheric Brγ line of a template with the same spectral type (see Table 3; values from Rodgers Rod01 (2001) and Wallace & Hinkle WH97 (1997)) and the disk continuum emission, computed subtracting from the observed K magnitude the photospheric one. All the relevant parameters used in the derivation are given in Table 1. K magnitudes are from 2MASS 333This publication makes use of data products from the Two Micron All Sky Survey, which is a joint project of the University of Massachusetts and the Infrared Processing and Analysis Center/California Institute of Technology, funded by the National Aeronautics and Space Administration and the National Science Foundation. ; note that none of the quantities used in eq.(2) has been measured simultaneously.
Of the 32 targets, 4 are very luminous objects of spectral type early B. Three of them have Brγ in emission, one in absorption. Table 2 refers in Column 3 a lower limit to the line luminosity, derived from the observed Brγ equivalent width, i.e., without correcting for the photospheric absorption. For the three stars where it is seen in emission L(Brγ) L⊙. The validity of Eq.(1) for these very luminous objects is very doubtful, and we will not consider them further in the following of this paper.
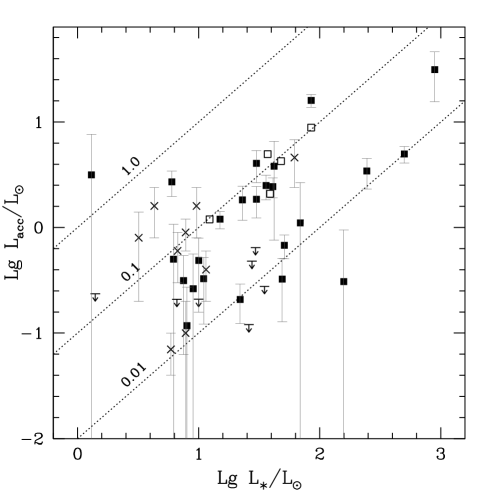
After subtraction of the photospheric component, 24 of the 28 HAe stars have circumstellar Brγ emission; for these, we compute L() from W(Brγ)circ, the continuum flux derived from the extinction-corrected K magnitude and the distance of the star. Lacc is then obtained from Eq.(1). For the remaining 4, where no circumstellar emission is detected, we estimate that W(Brγ)circ 2 Å, and compute upper limits to Lacc accordingly. For HD 98922 and HD 144432, Lacc refers to the quoted distance lower limit, and is therefore also a lower limit to the true value. The results are given in Table 1 and shown in Fig. 1 as a function of the stellar luminosity. Note that Eq.(1) has been derived for objects with L(Brγ) L⊙; 2 objects (HD 98922 and VV Ser) have larger L(Brγ), and the use of Eq.(1) should be viewed with some caution.
The mass accretion rate follows from the relation , and is shown in Table 1, Column (13).
The uncertainties on Lacc and are dominated in most cases by the uncertainties deriving from the subtraction of the veiled photospheric absorption component from the observed spectrum. The error bars shown in Fig. 1 correspond to an uncertainty on the resulting W(Brγ)circ of 2 Å, which we consider realistic in the majority of cases.
For any given object, variability of lines and continuum can also be large. There are no systematic studies of time variability of the Brγ equivalent width in our sample stars, but one can compare our measurements with the Rodgers (Rod01 (2001)) results from lower resolution spectra (R) for the 7 stars we have in common. The differences are within the errors for 3 of them, but larger than 2 Å in 2, one being R CrA. This confirms the well known fact that the accretion rate in pre-main sequence stars varies and that one can only estimate the “typical” value of any individual object if the results of long term time monitoring are available. However, if one is interested in the properties of a large sample of stars, as in this work, one can safely assume that their time variability will increase the spread of the determinations, but not bias the average values.
The dashed line shows the best-fit to the Ophiuchus data ( M⋆1.8); the dotted lines are 1 dex.
| (1) | (2) | (3) | (4) | (5) | (6) | (7) | (8) | (9) | (10) | (11) | (12) | (13) |
|---|---|---|---|---|---|---|---|---|---|---|---|---|
| name | ST | V | K | AV | D | Teff | L⋆ | M⋆ | Brγ(obs) | Brγ(circ) | Log Lacc | Log |
| (mag) | (mag) | (mag) | (pc) | (K) | (L⊙) | (M⊙) | (Å) | (Å) | (L⊙) | (M⊙/yr) | ||
| HD 149914 | B9 | 6.75 | 5.69 | 0.9 | 165 | 10600 | 158 | 3.5 | 6.90.2 | -0.8 | -0.51 | -7.99 |
| HD 179218 | B9 | 7.2 | 5.99 | 1.8 | 240 | 10600 | 500 | 4 | 1.30.2 | -10.1 | 0.70 | -6.59 |
| HD 176386 | B9 | 7.30 | 6.69 | 0.5 | 140 | 10600 | 49 | 2.7 | 6.20.2 | -3.1 | -0.49 | -8.11 |
| HD 97300 | B9 | 9.00 | 7.15 | 1.2 | 190 | 10600 | 35 | 2.5 | 9.10.2 | – | -0.5 | -8.18 |
| HD 98922 | B9 | 6.77 | 4.28 | 0.3 | 540 | 10600 | 890 | 5: | -2.40.2 | -3.7 | 1.50 | -5.76 |
| VV Ser | B9 | 11.92 | 6.32 | 3.1 | 260 | 10600 | 85 | 3.1 | -9.00.2 | -13.0 | 1.20 | -6.34 |
| 51 Oph | B9.5 | 4.81 | 4.29 | 0.1 | 131 | 10200 | 245 | 4 | 1.30.3 | -5.6 | 0.54 | -6.87 |
| HD 141569 | B9.5 | 7.00 | 6.82 | 0. | 99 | 10200 | 22 | 2.3 | 6.00.1 | -4.5 | -0.68 | -8.37 |
| NX Pup | A0 | 9.96 | 6.08 | 1.4 | 450 | 9840 | 42 | 2.5 | -1.90.2 | -2.4 | 0.58 | -6.97 |
| HR 4796 | A0 | 5.78 | 5.77 | 0.1 | 67 | 9840 | 26 | 2.4 | 9.40.2 | – | -0.9 | -8.53 |
| HD 97048 | A0 | 8.46 | 5.94 | 1.0 | 180 | 9840 | 41 | 2.5 | -6.30.15 | -8.4 | 0.39 | -7.17 |
| HD 104237 | A0 | 6.59 | 4.58 | 0.7 | 116 | 9840 | 6 | 2.0 | -4.70.2 | -6.7 | 0.43 | -7.45 |
| HD 95881 | A1 | 8.25 | 5.73 | 0.3 | 120 | 9450 | 10 | 2 | -1.60.2 | -2.8 | -0.31 | -8.04 |
| HD 150193 | A1 | 8.88 | 5.48 | 1.5 | 150 | 9450 | 30 | 2.3 | -3.50.15 | -5.5 | 0.27 | -7.29 |
| HD 163296 | A1 | 6.87 | 4.78 | 0.3 | 122 | 9450 | 36 | 2.3 | -4.70.1 | -6.9 | 0.40 | -7.12 |
| HD 144667 | A1.5 | 6.63 | 6.67 | 0.1 | 140 | 9300 | 51 | 2.5 | 5.80.15 | -7.2 | -0.17 | -7.63 |
| TY Cra | A2 | 9.42 | 6.67 | 1.3 | 130 | 9120 | 8 | 1.8 | 4.70.2 | – | -0.6 | -8.31 |
| WW Vul | A3 | 10.51 | 7.28 | 1.0 | 550 | 8670 | 30 | 2.4 | -3.60.2 | -5.4 | 0.60 | -6.89 |
| HD 169142 | A5 | 8.15 | 6.41 | 0.3 | 145 | 8260 | 15 | 1.8 | -5.00.1 | -9.7 | 0.08 | -7.40 |
| KK Oph | A6 | 10.57 | 5.79 | 0.44 | 160 | 8100 | 6.2 | 1.6 | -1.20.15 | -1.5 | -0.30 | -7.91 |
| HD 139614 | A7 | 8.25 | 6.75 | 0.1 | 150 | 7900 | 11 | 1.8 | 2.20.2 | -3.0 | -0.48 | -7.99 |
| HD 142666 | A8 | 8.81 | 6.08 | 0.8 | 116 | 7580 | 8 | 1.6 | 1.00.2 | -2.4 | -0.50 | -8.00 |
| HD 100453 | A9 | 7.79 | 5.6 | 0.0 | 111 | 7300 | 9 | 1.7 | 1.60.2 | -1.5 | -0.58 | -8.04 |
| HD 144432 | A9 | 8.16 | 5.89 | 0.2 | 200 | 7300 | 23 | 2 | -2.10.2 | -5.1 | 0.26 | -7.07 |
| HD 135344 | F3 | 8.61 | 5.84 | 0.3 | 84 | 6590 | 8 | 1.5 | 0.30.2 | -1.3 | -0.93 | -8.27 |
| T CrA | F5: | 12.04 | 6.60 | 1.9 | 130 | 6400 | 1.4 | 1.2 | 9.60.2 | – | -0.6 | -8.20 |
| R CrA | F5: | 11.50 | 2.86 | 1.4 | 130 | 6400 | 1.3 | 1.2 | -1.20.3 | -1.2 | 0.50 | -7.12 |
| HD 142527 | F6 | 8.33 | 4.98 | 0.7 | 200 | 6270 | 69 | 3.5 | 0.30.2 | -1.2 | 0.04 | -7.16 |
| AB Aur | A0 | 7.05 | 4.2 | 0.5 | 140 | 9840 | 48 | 2.4 | -4.40.15 | -5.5 | 0.63 | -6.85 |
| HD 34282 | A0 | 9.85 | 7.68 | 0.6 | 400 | 9840 | 30 | 2.2 | 2.70.17 | – | -0.20 | -7.71 |
| RR Tau | A0 | 11.0 | 7.39 | 1.1 | 800 | 9840 | 37 | 2.5 | -2.560.05 | -3.5 | 0.70 | -6.86 |
| HD 35187 | A2 | 7.78 | 5.91 | 0.65 | 150 | 9120 | 27 | 2.3 | 7.130.27 | – | -0.3 | -7.81 |
| UX Ori | A3 | 10.0 | 7.21 | 0.3 | 450 | 8670 | 39 | 2.3 | -2.40.02 | -3.9 | 0.32 | -7.19 |
| HK Ori | A5 | 11.66 | 7.34 | 1.2 | 450 | 8260 | 12 | 2.0 | -1.440.08 | -2.2 | 0.08 | -7.50 |
| HR 5999 | A6 | 7.04 | 4.39 | 0.5 | 210 | 8100 | 85 | 3.2 | -1.740.01 | -6.5 | 0.95 | -6.37 |
| CQ Tau | F2 | 9.42 | 6.17 | 1.9 | 130 | 6.6 | 1.5 | 3.170.18 | – | -0.6 | -8.08 |
| (1) | (2) | (3) | (4) |
|---|---|---|---|
| name | ST | Brγ(obs) | Log L(Brγ) |
| (Å) | (L⊙) | ||
| V921 Sco | B0 | -17.30.25 | -0.7 |
| MWC 300 | B0-B1 | -10.90.25 | -0.8 |
| MWC 166 | B0 IV | 2.50.2 | – |
| MWC 297 | B1.5 | -16.00.2 | -0.6 |
| (1) | (2) |
|---|---|
| ST | W(Brγ) |
| (Å) | |
| B8 | 11.4 |
| A0 | 9.7 |
| A2 | 13.4 |
| A8 | 12.0 |
| F3 | 6.6 |
| F6 | 5.5 |
4 Discussion
Fig. 1 plots Lacc as a function of L⋆ for the HAe observed in this paper. We have added six HAe stars (listed at the bottom of Table 1) taken from the Rodgers (Rod01 (2001)) thesis, for a total of 36 objects. Typically, the HAe stars have Lacc roughly between 10% and 1% L⋆. There are very few objects with Lacc0.1 L⋆, contrary to what happens for lower mass objects in Taurus and Ophiuchus (see Natta et al. Nea06 (2006), Calvet et al. Cea04 (2004)).
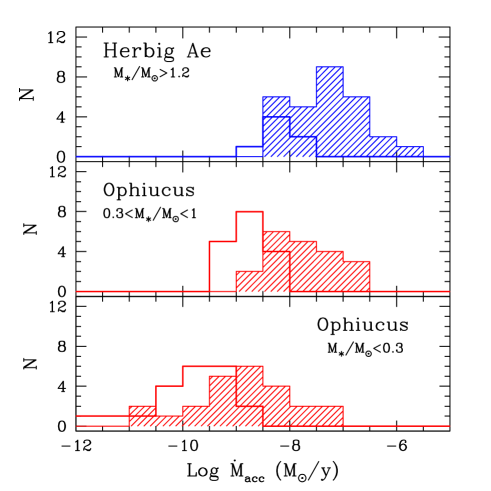
Fig. 2, top Panel, shows the distribution of the HAe stars; the values of cover the interval – M⊙/yr, but few stars (25%) have M⊙/yr; 36% have M⊙/yr. The median value is M⊙/yr. These results agree with those obtained by Muzerolle et al. (Mea04 (2004)), who found that intermediate-mass objects have typical Hα profiles and/or Balmer discontinuity roughly consistent with the predictions of magnetospheric accretion models with accretion rates M⊙/yr. They studied in detail only one object, UX Ori, for which they found a value M⊙/yr, comparable with the value ( M⊙/yr) we derive from the low resolution spectrum of Rodgers (Rod01 (2001)).
Our results support the conclusion of Muzerolle et al. (Mea04 (2004)) that in most HAe stars the accretion rate is sufficiently low that the gas in the inner disk, inside the dust evaporation radius, is optically thin, allowing the direct irradiation of the inner dust edge (the rim) by the star. One of the conditions for the formation of a puffed-up rim (Natta et al. Nea01 (2001)) seems therefore generally verified.
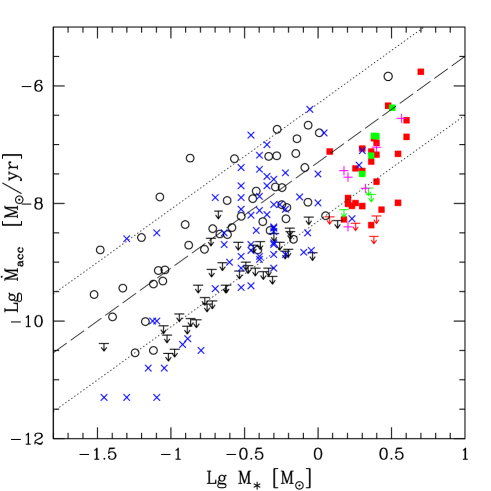
Fig. 3 plots as a function of M⋆ for the HAe stars, together with objects in Ophiuchus (Natta et al. Nea06 (2006)), Taurus (Muzerolle et al. Mea05 (2005) and references therein; Mohanty et al. Subu05 (2005)) and IMTTS in Orion and Taurus (Calvet et al. Cea04 (2004)). Fig. 2 compares the distribution of the HAe stars to that of objects in Ophiuchus in two mass ranges, as labelled. One can see that the median for the HAe stars ( M⊙/yr) is about a factor ten higher than for Ophiuchus stars with M⊙, and a factor 100 larger than in the very low mass objects with M⋆ M⊙. This is roughly consistent with the predictions of the M⋆1.8 relation derived for sub-solar mass objects. A close inspection of Fig. 3, however, shows that the HAe stars lack very strong accretors, as already noted in discussing Fig. 1. If the upper envelope of the distributions observed in Taurus and Ophiuchus extended to HAe stars, we would expect a much larger fraction of objects accreting at rates higher than M⊙/yr.
It is not easy, at this stage, to understand why this happens. The HAe stars form a sample which is not complete nor homogeneous. The objects are located in a variety of star forming regions, and, in some cases, are isolated in the sky. We think that the most likely interpretation of their behaviour is “aging”, since the accretion rate in viscous disks with constant parameter is expected to deacrease with time roughly as (Hartmann et al. Hea98 (1998)). HAe stars are, on average, older than Ophiuchus objects, which cluster at ages Myr, respectively (Palla & Stahler PS00 (2000)). Their nominal ages, obtained by comparing their location on the HR diagram with Palla & Stahler (PS99 (1999)) evolutionary tracks, range from to Myr; several stars are close to the ZAMS, and it is in fact interesting that 6/7 stars with non-detected Brγ emission are ZAMS objects, the exception being HD 35187, with an estimated age Myr. However, one should not overinterpret these findings, as ages of intermediate-mass stars derived from their location on the HR diagram are very uncertain.
It is possible that the steep dependence of on M⋆ does not extend to objects more massive than, say, M⊙, reflecting a change in the physical processes that control disk evolution and/or formation, and which have been discussed in a number of recent papers (e.g., Muzerolle et al. Mea03 (2003), Natta et al. Nea06 (2006), Padoan et al. Pea04 (2004), Alexander & Armitage AA06 (2006), Dullemond et al. Dea06 (2006)). Unfortunately, given the lack of completeness and the selection biases that affect it, it is difficult to establish the relevance of the HAe sample for this ungoing discussion. It is worth to remind, in this context, the well known bias due to the spectral type selection, which introduces an age-mass correlation in the sample (e.g., van Boekel et al. vBea05 (2005)) and automatically excludes young, relatively low mass ( 2.5 M⊙) objects.
5 Conclusions
We have reported in this paper measurements of the disk mass accretion rates in a sample of 36 Herbig Ae stars. The values of are derived from the measured luminosity of the Brγ emission line, using the correlation between L(Brγ) and the accretion luminosity Lacc, established by Muzerolle et al. (Mea98 (1998)) and Calvet et al. (Cea04 (2004)). Note that it is an empirical correlation, which makes no assumptions on the origin of Brγ.
We find that 80% of the stars, all of which have evidence of an associated circumstellar disk, are accreting matter, with rates M⊙/yr; for 7 objects, 6 of which are located on the ZAMS in the HR diagram, we do not detect any line emission. Few HAe stars (25%) have M⊙/yr. These results support the conclusion of Muzerolle et al. (Mea04 (2004)) that in most HAe stars the accretion rate is sufficiently low that the gas in the inner disk, inside the dust evaporation radius, does not prevent the formation of the puffed-up rim, proposed by Natta et al. (Nea01 (2001)) and Dullemond et al. (DDN01 (2001)).
When compared to the values found for lower-mass stars in the star forming regions Taurus and Ophiuchus, HAe stars have on average higher accretion rates; however, there is a lack of very strong accretors among them, as shown by the very few objects with Lacc 10% L⋆. It seems likely that this is because on average HAe stars are older than TTS in Ophiuchus or Taurus. However, ages of intermediate-mass stars derived from the HR diagram location are very uncertain; this, and the various selection biases which plague the HAe sample, make the comparison very difficult.
When we consider individual stars, the largest uncertainties on come from line variability, as in TTS, but also from the presence of a photospheric absorption component of Brγ in early-type stars, which needs to be subtracted from the observed one, and from the K-band excess emission. A better characterization of the photospheric profiles of template stars would be very valuable.
Acknowledgements.
We thank the ESO staff for competent and efficient support during the preparation of the observing blocks and for the excellent data delivered for this service observing programme. The spectroscopic observations of template stars were kindly provided by Bernadette Rodgers. This publication makes use of data products from the Two Micron All Sky Survey, which is a joint project of the University of Massachusetts and the Infrared Processing and Analysis Center/California Institute of Technology, funded by the National Aeronautics and Space Administration and the National Science Foundation. This project was partially supported by MIUR grant 2004025227/2004.Appendix A Brγ Spectra
The observed spectra, normalized to the continuum level and shifted for an easier display, are shown in Fig. 4. They are ordered roughly according to the observed W(Brγ)obs, from strong emission to strong absorption. In HAe, the strongest peak emission (HD 97048) is about 44% of the continuum; the deepest absorption (HR 4796) is 15% of the continuum.
The resolution of the spectra ( 30 km s-1) allows us to resolve the lines in all objects. The observed line shape results from the superposition of the circumstellar emission, the photospheric absorption and the veiling K-band continuum, very likely from the disk itself. One can see the signature of the broad photospheric absorption component in several objects, where the K-band veiling is moderate or absent (e.g., HD 149914, HD 97300, HR 4796). In some objects both the circumstellar emission and the photospheric absorption are clearly visible (e.g., HD 141569 and 51 Oph); in both objects the emission has a double-peaked profile with peak-to-peak separation km s-1.
In general, the emission lines are very broad, with half width at 10% of peak intensity (10%HW) of 200–300 km s-1. VV Ser has very broad wings, which extends to 450 km s-1 from the line center. As a reference, the escape velocity of a typical A0 star (M⋆=2.3 M⊙, R=4 R⊙) is 330 km s-1; the 10%HW of Brγ is often close to this value.
In comparison, the three early B objects with emission have very strong lines. They are relatively narrow (10%HW km s-1) when compared to the estimated escape velocity, which are of 200 km s-1.
Clearly, the study of the profiles of the near-IR hydrogen emission lines in these intermediate-mass objects promises very interesting results, and should be pursued further, possibly with even higher resolution spectrometers.

References
- (1) Alexander R.D., Armitage Ph.J. 2006, ApJ 639, L83
- (2) Calvet N., Muzerolle J., Briceño C., Hernàndez J., Hartmann L., Saucedo J.L., Gordon K.D. 2004, ApJ 128, 1294
- (3) Clarke C. J., Pringle J. E. 2006, MNRAS, 370, L10
- (4) Dullemond C., Dominik C., Natta A. 2001, ApJ 560, 957
- (5) Dullemond C., Natta A., Testi L. 2006, A&A645, L69
- (6) Gullbring E., Hartmann L., Briceño C., Calvet N. 1998, ApJ 492, 323
- (7) Hartmann, L., Calvet, N., Gullbring E., D’Alessio P., 1998, ApJ, 495, 385
- (8) Hernández J., Calvet N., Hartmann L., Briceño C., Sicilia-Aguilar A., Berlond P. 2005, AJ129, 856
- (9) Isella A., Natta A. 2005, A&A 438, 899
- (10) Malbet F., Benisty M., De Wit W.J., Kraus S., Meilland A. and the AMBER Collaboration 2006, A&A, accepted (astro-ph/0510350)
- (11) Meeus G., Waters L.B.F.M., Bouwman J., van den Ancker M.E., Waelkens C., Malfait K. 2001, å356, 476
- (12) Mohanty, S., Jayawardhana, R., Basri, G. 2005, ApJ, 626, 498
- (13) Muzerolle J., Hartmann L., Calvet N. 1998, AJ 116, 2965
- (14) Muzerolle J., Hillenbrand L., Calvet N., Briceño C., Hartmann L. 2003, ApJ, 592, 266
- (15) Muzerolle J., D’Alessio P., Calvet N., Hartmann L. 2004, ApJ 617, 406
- (16) Muzerolle J., Luhman K.L., Briceño C., Hartmann L., Calvet N. 2005, ApJ, 625, 906
- (17) Natta A., Prusti T., Neri R., Grinin V. P., Mannings V. 2001, A&A, 371, 186
- (18) Natta A., Testi L., Muzerolle J., Randich S., Comerón F., Persi P. 2004, A&A424, 603
- (19) Natta A., Testi L., Randich S. 2006, A&A452, 245
- (20) Padoan P., Kritsuk A., Norman M. L., Nordlund, Å 2004, ApJL, 622, L61
- (21) Palla F., Stahler S. W. 1993, ApJ 418, 414
- (22) Palla F., Stahler S. W. 1999, ApJ 525, 772
- (23) Palla F., Stahler S. W. 2000, ApJ 540, 255
- (24) Rodgers B. 2001, PhD thesis, University of Washington
- (25) Tatulli E., Isella A., Natta A., Testi L., Marconi A. and the AMBER Collaboration 2006, A&A, submitted
- (26) Testi L., Palla F., Natta A. 1998, A&AS 133, 81
- (27) van den Ancker M.E., The P.S., Tjin A Djie H.R.E., Catala C., de Winter D., Blondel P.F.C., Waters L.B.F.M. 1997, å324, L33
- (28) van den Ancker M.E., de Winter D., Tjin A Djie H.R.E. 1998, å330, 145
- (29) van den Ancker M. 2004, in ”High Resolution Infrared Spectroscopy in Astronomy”, eds. H.-U. Käufl, R. Siebenmorgen & A. Moorwood.
- (30) van Boekel R., Min M., Waters L.B.F.M., de Koter A., Dominik C., van den Ancker M.E., Bouwman J. A&A437, 189
- (31) Wallace L., Hinkle K. 1997, ApJS 111, 445
- (32) White R.J., Ghez A. 2001, ApJ 556, 265