The fate of spiral galaxies in clusters: the star formation history of the anemic Virgo cluster galaxy NGC 4569.
Abstract
We present a new method for studying the star formation history of late-type, cluster galaxies undergoing gas starvation or a ram-pressure stripping event by combining bidimensional multifrequency observations with multi-zones models of galactic chemical and spectrophotometric evolution. This method is applied to the Virgo cluster anemic galaxy NGC 4569. We extract radial profiles from recently obtained UV GALEX images at 1530 and 2310 Å, from visible and near-IR narrow (H) and broad band images at different wavelengths (, B, , V, , J, H, K), from Spitzer IRAC and MIPS images and from atomic and molecular gas maps. The model in the absence of interaction (characterized by its rotation velocity and spin parameter) is constrained by the unperturbed H band light profile and by the H rotation curve. We can reconstruct the observed total-gas radial-density profile and the light surface-brightness profiles at all wavelengths in a ram-pressure stripping scenario by making simple assumptions about the gas removal process and the orbit of NGC 4569 inside the cluster. The observed profiles cannot be reproduced by simply stopping gas infall, thus mimicing starvation. Gas removal is required, which is more efficient in the outer disk, inducing a radial quenching in the star formation activity, as observed and reproduced by the model. This observational result, consistent with theoretical predictions that a galaxy-cluster IGM interaction is able to modify structural disk parameters without gravitational perturbations, is discussed in the framework of the origin of lenticulars in clusters.
Subject headings:
Galaxies: individual: (NGC 4569-M90) – Galaxies: interactions – Ultraviolet: galaxies – Galaxies: clusters: individual: Virgo1. Introduction
Perturbations induced by the harsh cluster
environment makes the evolution of cluster galaxies different than
that of their counterparts in the field. Besides the well known
morphology segregation effect (Dressler 1980; Whitmore et al. 1993),
there is also evidence clearly indicating that the cluster late-type
galaxy population is systematically different from the field: cluster
spirals are generally depleted in their total HI content and are less
active in forming stars than their isolated counterparts. This is most
recently and extensively reviewed in Boselli & Gavazzi (2006). The
nature of the perturbing phenomenon has not yet been unambiguously
identified. Several physical processes have been proposed to explain
gas removal in clusters. Some of them are related to the dynamical
interactions of cluster galaxies with the hot (
107 K) and dense ( 10-3 atom cm-3)
intergalactic medium (IGM) (ram-pressure, Gunn & Gott 1972; viscous
stripping, Nulsen 1982; thermal evaporation, Cowie & Songaila
1977). Others are due to the gravitational interactions with nearby
companions (Merritt 1983) or with the wider potential of the cluster (Byrd
& Valtonen 1990).
The detailed analysis of several well known resolved galaxies in the
Virgo and in the Coma clusters, generally favor a galaxy-IGM
interaction scenario (Vollmer et al. 1999, 2000, 2001a, 2004b; Kenney et al. 2004;
Yoshida et al. 2004) in these instance. Using complete, multifrequency datasets combined
with model predictions several studies have unambigously shown that
ram-pressure stripping occurs even at the periphery of
clusters (e.g. CGCG 97-73 and 97-79 in A1367, Gavazzi et al. 2001),
and that galaxies recently ( 500 Myr) stripped by
ram-pressure populate nearby clusters well outside the cluster core
(Boselli & Gavazzi 2006).
Ram-pressure stripping has also been
invoked to explain the origin of the lenticular
galaxy population inhabiting rich clusters.
One early suggestion was
that, as a consequence of gas removal through ram-pressure stripping, cluster
galaxies first become “anemic” and then passively evolved into
lenticulars (van den Bergh 1976). Statistical considerations, as well
as structural, kinematical and spectroscopic properties of
lenticulars, however, do not appear to confirm this simple scenario. As
discussed in Dressler (1980, 2004) the morphological type variation in clusters is
too weak a function of the local galaxy density. Furthermore, the disks of
lenticulars have, on average, surface brightnesses and bulge-to-disk
ratios that are significantly higher than early-type spirals (Dressler 1980;
Christlein & Zabuldoff 2004; Boselli & Gavazzi 2006) making the
formation of lenticulars through gas sweeping in spirals very
unlikely. The larger scatter and a small zero-point offset in the
Tully-Fisher relation observed in the Virgo and Coma cluster lenticulars
also indicate that S0s can hardly be formed by simple gas removal from
healthy spirals (Hinz et al. 2003). Furthermore cluster lenticulars
generally have spectroscopic signatures of recent, post-starburst
activity (Poggianti et al. 2004) difficult to trigger in a simple
ram-pressure stripping scenario.
The origin of lenticulars is still an open problem and
limit our understanding of the evolution of galaxies in
different environments. This riddle can be solved only by first realistically
quantifying the physical
effects of ram-pressure stripping by combining model predictions with
multifrequency observations of representative samples.
We have been collecting multi-frequency data for a large sample of
late-type galaxies in nearby clusters and in the field in order to
undertake the comparative statistical analysis of any systematic
differences between cluster and field objects. The most important results obtained from
the analysis done so far are reported in Boselli & Gavazzi (2006).
Combined with multi-zone models for the chemical and spectrophotometic evolution of
galaxies (Boissier & Prantzos 2000), this unique database is helping us
to understand the evolution of cluster spirals.
The aim of the present paper is to give a complete description of the
multi-zone spectrophotometric models of galaxy evolution used to study
the effects of the environment on cluster galaxies.
As a first application we present a
detailed study of the radial profiles of the Virgo cluster galaxy
NGC 4569 (M90). NGC 4569, the prototype anemic galaxy as defined by
van den Bergh (1976), is extremely deficient in HI, having only about
one tenth of the atomic gas of a comparable field galaxy of similar
type and dimensions. This galaxy has a truncated H and HI
radial-density profile (at a radius of 5 kpc; see Fig. 1 and 3) as firstly
noticed by Koopmann & Kenney (2004a,b) and Cayatte et al. (1994),
bearing witness to a recent interaction with the cluster environment. NGC 4569
is located close ( 2 degrees, 240 kpc for a virial radius of 1.7 Mpc) to the cluster center. Being one of
the largest galaxies ( 10 arcmin, 50 kpc) in the Virgo cluster, NGC 4569
is the ideal candidate for our study since it is spatially
resolved at all the wavelengths considered here. NGC 4569 has also been
selected because it has been previously studied using dynamical models by Vollmer et
al. (2004a). A direct comparison of the results obtained using totally
independent techniques (in particular, dating the interaction) is
thus possible.
We just remind that multifrequency and kinematical
observation of the inner part of NGC 4569 done by Jogee et al. (2005)
seem to indicate that the nucleus and the inner stellar bar of the
galaxy might have been triggered by a recent tidal interaction. There are however no observational evidences
indicating that the HI disk has been truncated by any gravitational interaction with nearby companions.
Since our models are adapted for disk galaxies, we will however limit our study to the disk component
excluding the central nucleus.
The combination of the
multi-frequency 2-D data with our spectrophotometric models allow us
to study, for the first time, the radial evolution of the different
stellar populations in this prototype, gas-stripped cluster galaxy
with the aim of understanding whether its structural properties can
evolve, even in principle, into those of a typical cluster lenticular (S0) galaxy. A more
complete analysis of a statistically significant sample of cluster
galaxies will be presented in a future communication.
2. Data
The large amount of spectrophotometric data available for NGC 4569,
collected in the GOLDMine database (Gavazzi et al. 2003), allow us
to reconstruct its radial profile at 22 different wavelengths: from the
new GALEX UV bands (at FUV=1530 and NUV=2310 Å, IR1.0 data release recently
published in Gil de Paz et al. 2006),
to the visible B and V (Boselli et al. 2003), Sloan
(Abazajian et al. 2005), near-IR J, H
and K bands (Boselli et al. 1997; 2MASS Jarrett et al.
2003), mid-IR 3.6, 4.5, 5.8 and 8 m IRAC and
far-IR 24, 70 and 160 m MIPS bands recently obtained by
Spitzer in the framework of the SINGS project (Kennicutt et al. 2003).
An accurate description of the IRAC and MIPS Spitzer data reduction procedures
is given in Dale et al. (2005).
H+[NII] narrow band imaging, used to trace the recent
star formation activity (e.g. Boselli et al. 2001), is available
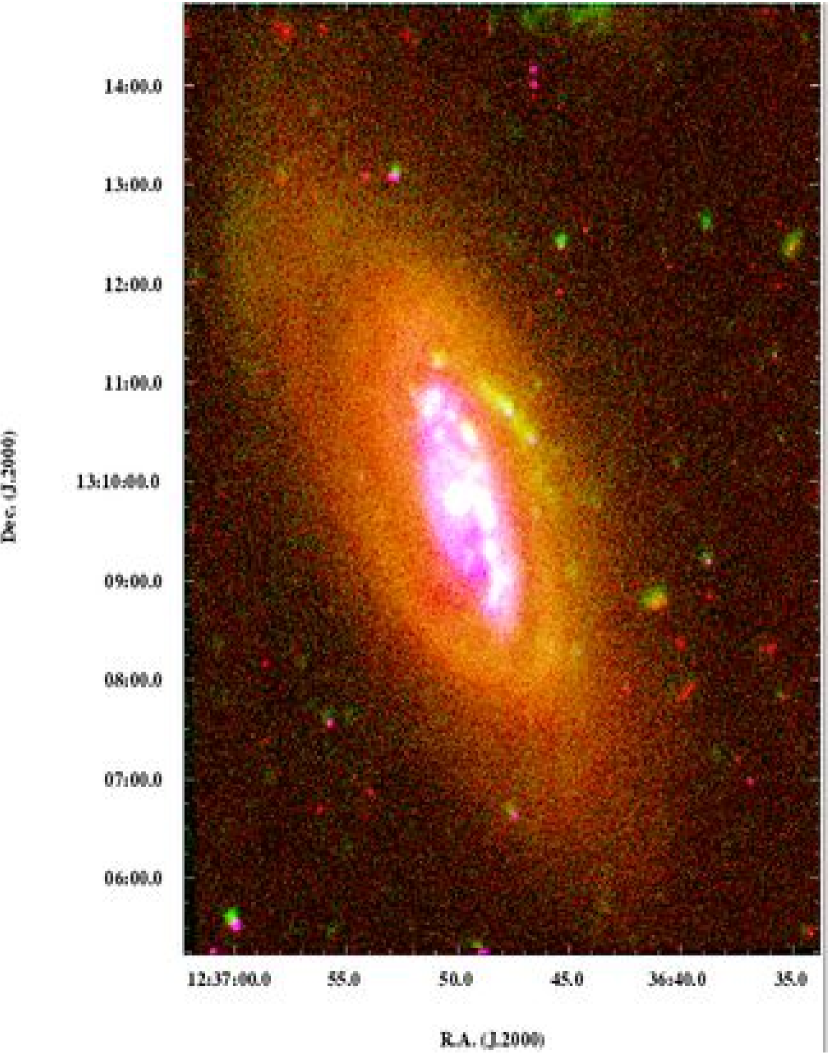
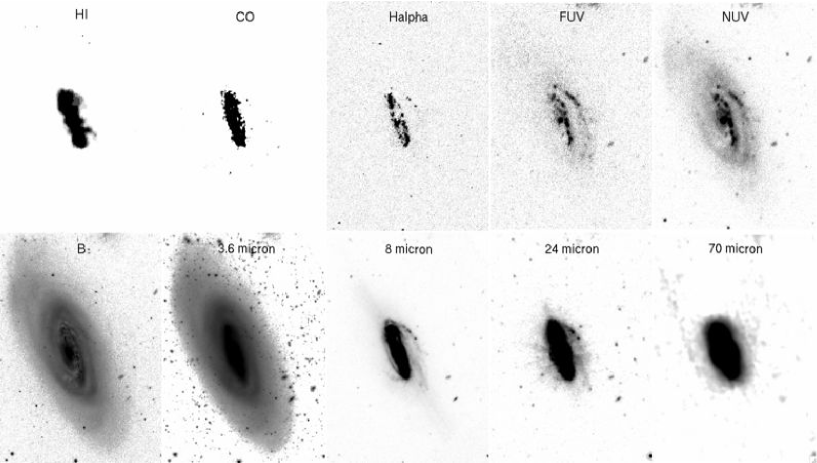
from Boselli & Gavazzi (2002). Some of the multifrequency images of NGC 4569
are shown in Fig. 1. The accuracy of photometry from the
imaging data is, on average about 10%. HI profiles are from
Cayatte et al. (1994), while H2 profiles, determined from CO data
using a luminosity-dependent CO-to-H2 conversion factor (from
Boselli et al. 2002, applied to the whole profile with no radial
variation as unfortunately no metallicity gradient information is
available for NGC 4569)
are taken from the BIMA survey of Helfer et al. (2003) for the inner
disk, and from Kenney & Young (1988) for the outer disk. The total
gas profile is the sum of the HI and H2 gas profiles multiplied by
a factor of 1.4 to take into account the He contribution. The galaxy
rotation curve has been taken from Rubin et al.
(1999).
The radial surface-density profiles have been constructed by integrating the available
images within elliptical, concentric annuli. The ellipticity and
position angles have been determined and then fixed using the deepest
B-band image following the procedure of Gavazzi et al. (2000)111
To avoid any possible contamination by the NW arm, whose
kinematical properties indicate that it is not assoicated to the
stellar disk but rather formed during the galaxy-cluster IGM
interaction, the arm was masked in the construction of the radial
profiles. If included, its contribution would be perceptible only in
the FUV filter at radii 8 kpc, increasing the surface brightness
by 0.5 mag..
All the observed profiles have been smoothed to the same angular resolution
as the models (which is 1 kpc, see next section).
The UV to near-IR broadband radial profiles of the galaxy
have been corrected for internal extinction using the recipe of
Boissier et al. (2004) based on the radial variation of the far-IR to FUV flux ratio.
After masking the contribution of the nucleus, whose emission is contaminated by
AGN activity (NGC 4569 is classified as a Seyfert in NED), we combined the 24, 70 and 160 m
profiles, smoothed to the 160 m resolution, using the receipe of Dale et al.
(2001) to estimate the total 1-1000 m dust emission (TIR) as extensively discussed in Cortese et al. (2006a).
The total far-IR to FUV flux ratio radial variation is then transformed into a
FUV extinction gradient (in magnitudes) using the appropriate calibration given in Cortese et al.
(in preparation) for a galaxy with spectral properties similar to those of NGC 4569.
We stress that, given its quiescent nature, the contribution of far-UV photons to the
dust heating of NGC 4569 is only marginal: the calibration of the far-IR to FUV flux ratio into a
FUV extinction is thus more indirect than in star forming galaxies,
where dust is mostly heated by UV photons, making the correction highly uncertain.
The adopted far-IR to FUV flux ratio vs. A(FUV) relation calibrated on the spectral energy
distribution of NGC 4569 allow us to take into account also the contribution to dust heating from the general
interstellar radiation field not necessarily associated to star forming regions.
Indeed we predict less extinction for the same TIR/FUV ratio than for star forming galaxies (Buat et al. 2005).
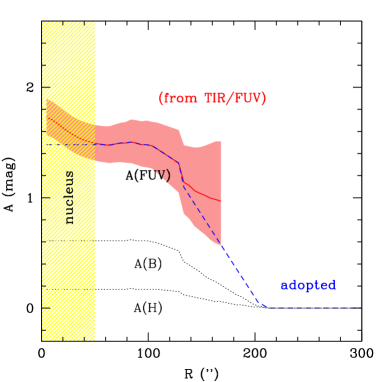
The extinction in the other visible and near-IR
bands has been determined using the prescription of Boselli et al.
(2003). The resulting A(FUV) extinction profile, along with A(B) and A(H),
are shown in Fig. 2: given the lack of gas and dust in the outer disk,
extinctions are extrapolated to zero at large radii. As extensively discussed in the next sections, the
determination of the radially-dependent extinction corrections,
that can be quite large (i.e., more than 1 mag) in the UV bands, is thus the major source
of systematic uncertainty in the reconstruction of the corrected radial
profiles.
H+[NII] narrow-band imaging has been corrected
for [NII] contamination and dust extinction (Balmer decrement) using
the integrated spectroscopy of Gavazzi et al. (2004). Given the
nature of the integrated spectrum, these corrections are fixed and
do not change with radius. We believe that such a constant
correction does not introduce systematic errors in the H profile
determination given the strongly truncated morphology of the
galaxy. It is generally considered that radial effects are small for
these corrections (e.g., Martin & Kennicutt 2001). On the other hand,
the integrated spectrum might be partly contaminated by the nuclear
emission (the galaxy is classified as a Seyfert in NED). In any case [NII]
contamination and extinction are the two major sources of
uncertainty in the determination of the H radial profile.
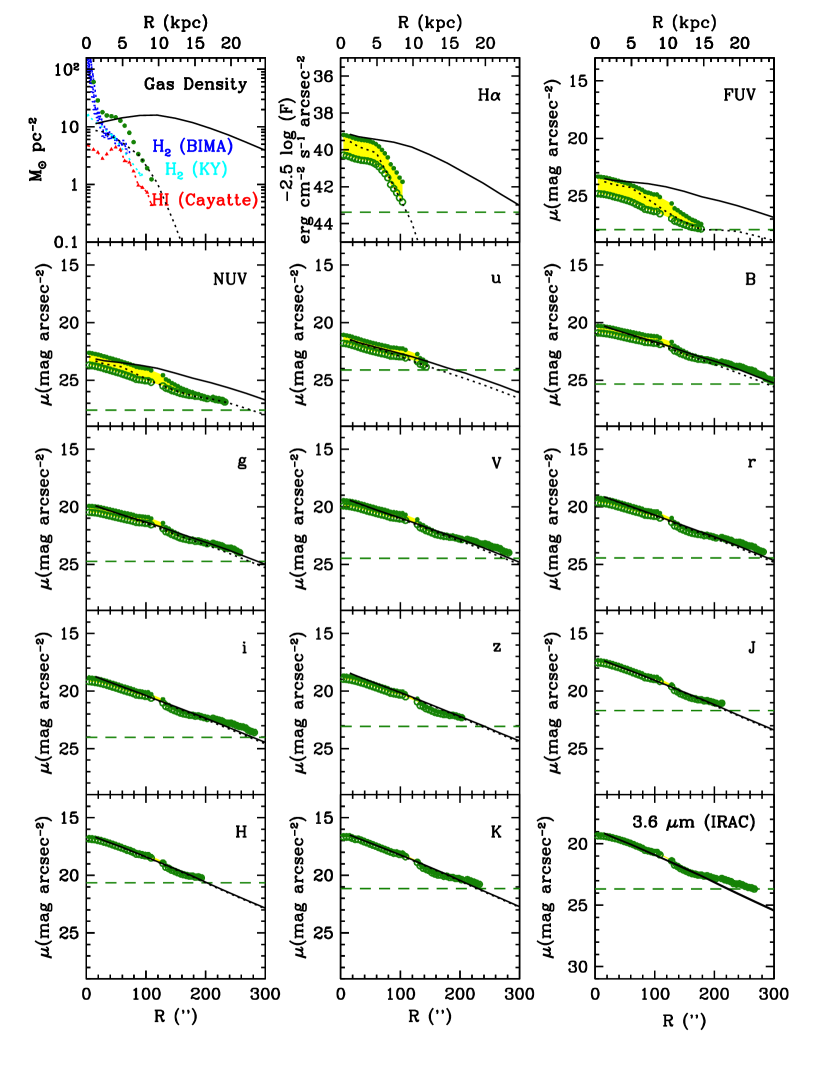
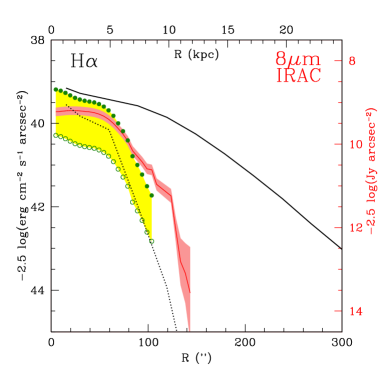
In Fig. 3, we show all the gas and stellar profiles described above,
at 1 kpc resolution. For the surface photometry, open
symbols correspond to observed values, and filled symbols to
extinction-corrected values. The shaded area in between the two profiles
graphically illustrates the magnitude of the uncertain extinction correction.
We notice that, although not univocally related to star formation (Boselli et al. 2004), the unestinguished
8 m image (Fig. 1) and radial profile (Fig. 4) of
NGC 4569 confirm the truncated nature of the star forming disk.
3. Models
3.1. The multi-zone models for the chemical and spectro-photometric unperturbed disk evolution
To study the evolution of the disk of NGC 4569 at various radii, we have used the multi-zone (typical resolution 1 kpc) chemo-spectrophotometric models of Boissier & Prantzos (2000), updated with an empirically-determined star formation law (Boissier et al. 2003) relating the star formation rate to the total-gas surface densities (, ):
| (1) |
where is the rotation velocity at radius . The resulting models are extremely similar to those in Boissier & Prantzos (2000) and show the same global trends. Not only do we consider the star formation law as fixed but we also keep the same mass accretion (infall) histories as in Boissier & Prantzos (2000), based on the assumption that before the interaction with the cluster, NGC4569 was a “normal” spiral. The only remaining free parameters in this grid of models are the spin parameter, and rotational velocity, . The spin parameter is a dimensionless measure of the angular momentum (defined in e.g. Mo, Mao & White 1998). Its value in spirals ranges typically between 0.02 for relatively compact galaxies to 0.09 for low surface brightness galaxies (Boissier & Prantzos 2000). The models of Boissier & Prantzos (2000) contains scaling relationships (the total mass varies as , the scale-length as ). Star formation histories depend on the infall timescales, which are a function of in these models, so that roughly speaking, controls the stellar mass accumulated during the history of the galaxy, and its radial distribution.
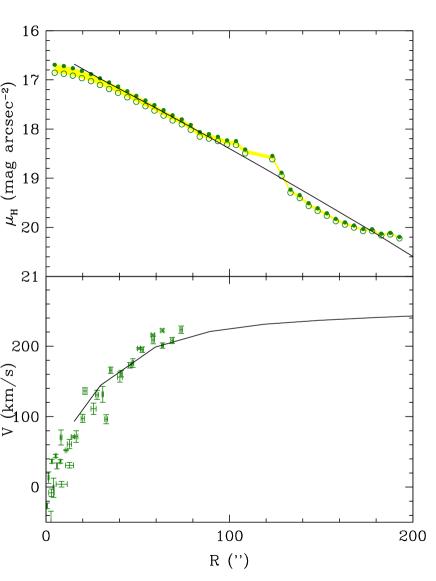
To constrain these two parameters, we use the H-band luminosity profile (determined assuming a distance of 17 Mpc) and the rotation curve of the galaxy, making the reasonable assumption that both of these observables are unperturbed during the interaction222The H-band luminosity, proportional to the total dynamical mass of the galaxy (Gavazzi et al. 1996) and tracer of the old stellar population, and the rotational velocity of galaxies are generally not affected by the interaction with the harsh cluster environment (Boselli & Gavazzi 2006).. Since the model does not include any bulge or nuclear component, throughout the paper the comparison between models and observed profiles is limited to the disk component, excluding the inner 40” (3 kpc). In order to fix the two parameters, we proceeded as follow: for each spin considered (0.01 to 0.09 in 0.01 steps), we computed models with various rotational velocities (80 to 360, in steps of 70 km s-1) and interpolated the models for each spin in order to find the velocity for which the integrated H band magnitude is equal to the observed one, after 13.5 Gyr of evolution (considered as the present epoch). We then compared the model profile in the H band for each spin (with the velocity determined as described above) to the observed profile. The best agreement was clearly obtained with =0.04 and the associated =270 km s-1. The disk is more concentrated (extended) than observed for smaller (larger) spin parameters. The resulting rise of the rotation curve for this model is consistent with the observed one (see Fig. 5 for a comparison of this model and the constraints mentioned above). The model does not reproduce small scales variations probably due to structures such as spiral arms. Given the agreement, this model will now be considered as the reference model for the unperturbed case. The models of Boissier & Prantzos (2000) provide the luminosity profiles in all bands as well as the total gas profile. They do not compute the nebular emission, but we estimated the H emission here by using the number of ionizing photons predicted by Version 5 of STARBURST 99 (Vazquez & Leitherer 2005) for a single generation of stars distributed on the Kroupa et al. (1993) initial mass function (as used in our models), convolving it with our star formation history, and converting the result into our H flux following Appendix A of Gavazzi et al. (2002b). All the profiles predicted for the reference model (without any interaction, solid line) are compared to the observed one in Fig. 3. The profiles at long wavelengths are in agreement with the model, while short-wavelength observations, the star formation tracers (UV, H), and the gas profiles present truncations and/or shorter scale-lengths with respect to the expectations of the unperturbed model.
3.2. The starvation scenario
In the starvation scenario (Larson et al. 1980, Balogh et al. 2000, Treu et al. 2003), the cluster acts on large scales by removing any extended gaseous halo surrouding the galaxy, preventing further infall of such gas onto the disk. The galaxy then become anemic simply because it exhausts the gas reservoir through on-going star formation.
Infall is a necessary assumption in models of the chemical evolution of the Milky Way to account for the G-dwarf metallicity distribution (Tinsley 1980) and is supported by some chemo-dynamical models (Samland et al. 1997). As the disk galaxy models were obtained through a generalisation of the Milky Way model, infall is present in all our models. It is a schematic but simple way to describe the growth of any galaxy from a proto-galactic clump in the distant past to a massive present-day galaxy. Infall time scales in the models were chosen to reproduce the properties of present day normal galaxies (Boissier & Prantzos 2000, Boissier et al. 2001). A radial variation of infall time-scales is suggested by dynamical models (Larson 1976). A prescription for this variation was implemented in our models of the Milky Way and of spirals, allowing to reproduce many profiles and abundance gradients in our Galaxy (Boissier & Prantzos 1999, Hou et al. 2000), as well as colour and abundance gradients in external galaxies (Prantzos & Boissier 2000).
Stopping infall (in order to mimic starvation) at a given time is straightforward to include in the model. We shall call the elapsed time since the infall termination (look back time). In order to affect the evolution of the galaxy, starvation must have occured before most of the gas had been accreted onto the disk. Regions where infall occurs early-on with respect to the starvation epoch will barely be affected, while those where infall occurs late in the history of the galaxy will never be built up. Starvation is a global effect ( has no dependence on radius); however, the infall time-scale increases with radius (inside-out formation of the galaxy). We can therefore expect an effect on the gas and stellar profiles since starvation will affect the outer regions (since these form late in an isolated galaxy model) more than inner regions (which have already formed at earlier times).
3.3. The ram pressure stripping scenario
In addition to the starvation scenario we can also study the effect of ram-pressure gas stripping. For simplicity, we adopt the plausible scenario of Vollmer et al. (2001b) explicitly tailored to Virgo: i.e., the galaxy being modelled has crossed the dense IGM only once, on an elliptical orbit. The ram pressure exerted by the IGM on the galaxy ISM varies in time following a gaussian profile, whose peak at (=) is when the galaxy is crossing the dense cluster core at high velocity ( and are look-back times, where the present epoch corresponds to =0). The gaussian has a width = 9 107 years (see Fig. 3 of Vollmer et al. 2001b). We make the hypothesis that the gas is removed at a rate that is directly proportional to the galaxy gas column density and inversely proportional to the potential of the galaxy, measured by the total (baryonic) local density (provided by the model). The gas-loss rate adopted is then equal to , with the efficiency following a gaussian having a maximum at the time , chosen to mimic the variation of the ram pressure suggested by Vollmer et al. (2001b). This very simple, but physically-motivated prescription should allow us to model the gas removal from the galaxy using only two free parameters ( and ) to age-date and measure the magnitude of this effect. We make the further assumption that no extra star formation is induced during the interaction. This assumption is reasonable since both models (Fujita 1998, Fujita & Nagashima 1999) and observations (Iglesias-Paramo et al. 2004) do not show any significant increase of the star formation activity in galaxies thought to be currently undergoing a ram-pressure stripping event.
4. The star formation history of NGC 4569: model predictions
4.1. The starvation scenario
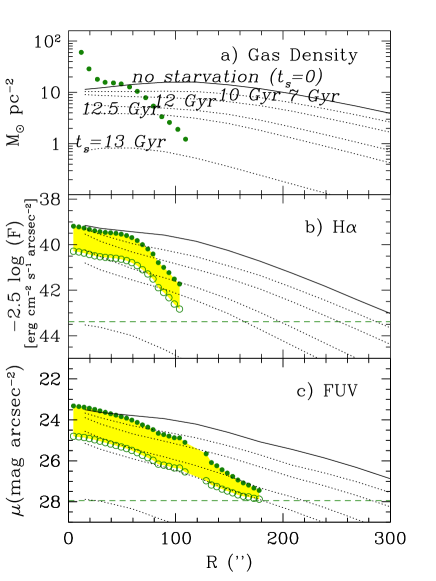
The result of starvation on the gas and star forming (H and FUV) profiles,
once gas infall on the galaxy has been stopped at different epochs
(), is shown in Fig. 6.
First, we note that in order to remove significant amounts of gas in
N4569, infall must have been stopped for many Gyr. This is consistent with Balogh et al. (2000).
The reason for this is that with =270 km s-1, the reference model has a higher mass
than the Milky Way. Since infall timescales in the models of Boissier
& Prantzos (2000) are shorter for more massive galaxies, NGC4569
should have accreted most of its material early-on in its history,
thus stopping infall at a later time has no effect, as most of the gas is
already in the disk, and the galaxy is barely affected by the
starvation process. Given the strong relationship between gas and star formation,
the same conclusion applies to the H radial profile.
Secondly, the resulting profiles never have the right shape, and never predict
a sharp truncation, as is observed in all the short time-scale indicators (gas, H, 8 m).
While the models include a radial variation of
infall time-scales (inside-out formation), this trend with galactocentric distance
is not strong enough for the gas, H and FUV profiles to be truncated when infall
is globally stopped at a given time.
The dependence of the infall time scale on the mass of the galaxy and on the radius are the ones encoded in the models. They would need to be dramatically changed in order to match the gas profile observed in NGC4569 in a starvation scenario. However, if the mass-dependence was extremely different, the models of Boissier & Prantzos (2000) would fail to reproduce other relations (e.g., the observed color magnitude relationship of nearby galaxies). The radial dependence of infall time-scales in these models is such that it provides a good match to the color and abundance gradients of spirals (Prantzos & Boissier 2000). This agreement would also be broken if we drastically changed this radial trend, as it would be needed to obtain a truncated profile, similar to the one observed in NGC4569.
4.2. The ram pressure stripping scenario
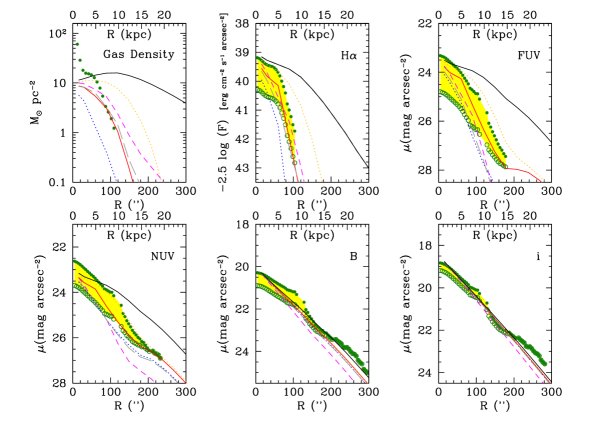
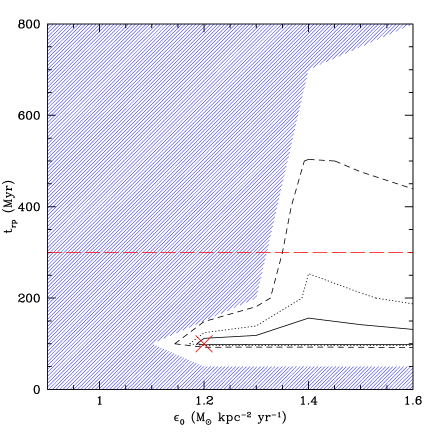
Having such a simple prescription with only two free parameters (as explained in section 3.3), it is possible to choose simultaneously and because the amount of gas left and its radial distribution depend strongly on while the resulting stellar light profiles depend mainly on (see Fig.7 for some examples).
If the time of cluster-core crossing is recent only the youngest stellar populations (emitting in H, whose age is 4 106 yrs, or far-UV, 108 yrs) have had time to feel the progressive radial suppression of the star formation activity and we can date the suppression of gas with our model predictions. We stress that this model is principally constrained by the radial variation of the surface brightness and color profiles and only in a minor way by their absolute values which can be affected by zero-point uncertainties.
Among the uncertainties, the extinction corrections are certainly the largest because the A(FUV) vs. TIR/FUV calibration is highly uncertain in such evolved galaxies where dust is not only heated by UV photons but also by the general interstellar radiation field produced by more evolved stars. Geometry and attenuation laws can vary from one galaxy to another; and without a complete radiative transfer model, it is impossible to apply “perfect” extinction corrections. We present in Figures 3 to 7 the data “as observed” (open symbols) and “extinction corrected”(filled symbols) in order to illustrate the sense and magnitude of the correction, and in doing so, illustrate just how much the uncertainty affects our results. It is obvious that allowing ourselves to change only two parameters ( and ) and considering the constraint of 16 profiles (total gas+photometry+rotation curve) does not result in a perfect match for all of them, especially taking into account the above-mentioned uncertainties. Models were computed each 100 Myr for 0 500 Myr, 200 Myr for 0.5 1.5 Gyr and 1 Gyr for 1.5 6.5 Gyr; and in steps of 0.2 M⊙ kpc-2 yr-1 efficiencies between 0.4 and 1.6. Computing the for various values of and (see Fig. 8), we found that the model best matching the profiles of NGC 4569 is characterized by = 1.2 M⊙ kpc-2 yr-1 and = 100 Myr. The for models with 400 Myr are still acceptable with lower than 5 times the of the best model (=3.4). The for models in disagreement with observational limits at large radii (e.g. predicting too much gas or light in the outer disk where none is observed) are artificially set to large values to reject these solutions that cannot reproduce the observed truncations (shaded area in Fig. 8). Note that although the reduced was computed, with 2 free parameters, the usual idea of a good fit ( 1) cannot be achieved since we know that our models will not reproduce the small scale variations of the profiles (as mentioned above) and the introduction of observational limits makes any statistical analysis harder. In our study, the is only used to pick out the best among the models, and see which parameters give similar results ( 400 Myr), and which parameters produce very unrealistic models (large and low ). For a few profiles Fig. 7 shows the observations contrasted with models of various ages () and of various efficiencies, showing that low and/or high efficiencies do not reproduce properly the gas and H truncation. In this figure, we also show a model with = 300 Myr, the time indicated by the dynamical model of Vollmer et al. (2004a). It is interesting to note that although earlier cluster-core-crossing epochs give more truncated disk profiles in the old stellar populations (B and bands, blue dashed line), this is not the case in the gas profile which is modified by contributions from the recycled gas. Models with 500 Myr are quickly rejected because recycled gas from evolving stars would be present at large radii, thereby allowing some low levels of star formation. The model relative to the oldest interaction, =1.5 Gyr given in Fig. 7 (dashed magenta line), predicts in fact a factor of two higher total gas surface density outside the 80 arcsec radius than that observed.
This is largely consistent with the dynamical models of Vollmer et al. (2004a), who obtained 300 Myr, but do not reject shorter (100 Myr) timescales (Vollmer, private communication). Although not reproducing perfectly the surface brightness profiles, the best-fitting model is able to qualitatively reproduce the truncation of the total gas disk profile and that of the H and UV radial profiles, as well as the milder truncation observed at longer wavelengths (see Fig. 3). The comparison with the unperturbed model (assumed to represent an isolated spiral) clearly shows the effect of a ram-pressure-stripping event.
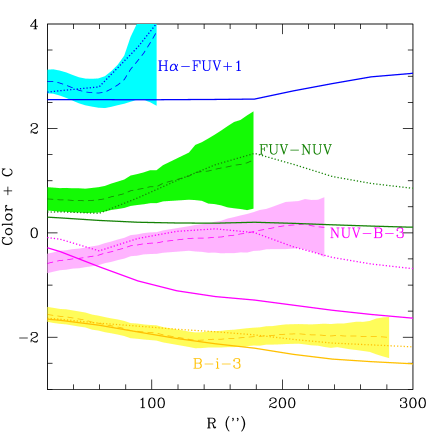
The ram-pressure model also reproduce (within the uncertainties) the radial trends of colors which are also clearly different from the unperturbed reference model. This is especially visible in Fig. 9 where we have compiled a few color profiles: the observed data (smoothed to match the model resolution), the unperturbed reference model, and the model including the perturbation. Color gradients at short wavelengths are inverted (redder colors outward) with respect to normal galaxies when gas removal is introduced into the model, as observed.
The adopted model does not take into account possible effects complicating the interaction. The most obvious one is the possibility for some of the gas to be re-accreted onto the galaxy following the stripping episode. This happens in several of the dynamical models run by Vollmer et al. (2001b). The effect is strongly dependent on the inclination angle of the galaxy with respect to its orbital plane, as well as the maximum ram pressure. In all of their models having a significant inclination (i.e., larger than 20 degrees), the re-accreted gas mass is lower than 10% of the stripped gas. If 10% of the stripped gas in our model was re-accreted (and distributed in a similar way to the gas profile we obtained), the gas profile would increase only by 0.4 dex, which would not be very different from the observed profiles. If we assume in the models that a much larger fraction of the gas (about 50%) is re-accreated, we would obtain HI column densities exeeding the observed ones. Another reason why we don’t expect much re-accretion to have taken place is that this phenomenon takes time: several 100 Myr years after the closest passage of the galaxy to the cluster center, a time similar to the look-back time we expect for this passage.
To conclude we can confidently say that the starvation scenario is very unlikely to have shaped the NGC4569 profiles, while the ram-pressure scenario is much more in agreement with the observations. With this scenario, we can exclude solutions older than 500 Myr, in agreement with the dynamical models of Vollmer et al.
5. Discussion and conclusion
The present work gives the first quantitative estimate of the
structural evolution of stellar disks in cluster galaxies due to gas
removal caused by a dynamical interaction of the galaxy with the
IGM, delivering a strong message concerning the passive
stellar evolution of stripped disks.
First of all it is clear that the truncation of the
total gas disk profile is soon reflected on the young population
stellar disk, confirming the predictions of Larson et al. (1980). As
a consequence gas-stripped galaxies have color gradients opposite to
that of normal, isolated spirals, which generally have bluer colors in
their outer disks. NGC 4569 is bluest towards the center (see
Fig. 9 and 11). The trend is especially
true for colors tracing the relatively young populations (
108 yr); colors tracing populations older than the interaction
event show the usual gradient (i.e., redder towards the
center, as the B- color index). The inversion of the color gradient, here observed for the
first time in a cluster galaxy, is well reproduced by our model.
The second major conclusion of the present analysis is that the
perturbation which induced the truncation of the stellar disk of NGC 4569 is
relatively recent event (100 Myr, in any case 500
Myr). Ram-pressure is favored with respect to starvation since the
latter is simply not able to reproduce the observed truncation of the
gas and star forming (H, 8 m, FUV) disk.
Since NGC 4569 seems to be typical of the HI-deficient galaxy population
inhabiting nearby clusters, characterized by truncated HI and
star forming disks (Cayatte et al. 1994; Koopmann et al. 2006), with largely
unperturbed older stellar populations333We remind that there is a
strong relationship between the ratio of the optical to H radii and
the HI deficiency parameter in cluster galaxies (see Fig. 11 of Boselli & Gavazzi 2006)., we
generalize this statement by saying that gas stripping in cluster galaxies is
due to relatively recent perturbations.
This result is thus a major constraint on the evolution of cluster
galaxies since it rejects long time-scale phenomena such as
harassment and starvation.
The ram-pressure stripping scenario has recently been
criticized as unable to reproduce the radial decrease with the
cluster-centric distance of the star formation activity of galaxies in
the nearby Universe. Recent, complete spectroscopic surveys of the
nearby universe such as the SDSS or the 2dF have shown that the
activity of late-type galaxies begins to decrease at 1-2 virial radii
from the cluster center (Gomez et al. 2003; Lewis et al. 2002, Tanaka
et al. 2004, Nichol 2004), scale-lengths comparable to those observed
in the HI (Gavazzi et al. 2005, 2006a) and/or H (Gavazzi et
al. 2002a, 2006b) in nearby clusters. Since these distances (1-2
virial radii) are significantly larger (a factor of 5-10) than those
where galaxy-IGM interactions are expected to be more efficient
( inside a core radius), other processes already active at the
periphery of clusters [such as galaxy harassment (Moore et al. 1996),
starvation (Balogh et al. 2000) or pre-processing (Fujita 2004; Cortese et al. 2006b)] have
been proposed to explain the radial decrease of the star formation
activity with the cluster-centric distance.
As extensively discussed
in Boselli & Gavazzi (2006), however, the presence of galaxies with
clear signs of ongoing ram-pressure stripping at the periphery of
nearby clusters and the large velocity dispersion, combined with the
radial orbits (Dressler 1986; Solanes et al. 2001) of the late-type
galaxy population can explain the observed decrease of the star
forming activity at large cluster-centric radii in a ram-pressure
stripping scenario. NGC 4569, for instance, might have travelled
0.6 Mpc (1/3 of the virial radius) since it was stripped, a
distance significantly larger than the core radius of the cluster (130
kpc). We recall that in Virgo the drop of the star formation in bright
galaxies is observed at 0.7 virial radii (Gavazzi et al. 2006b),
while the increase of the HI-deficiency parameter occurs at about 1 virial
radius (Gavazzi et al. 2005). The higher velocity dispersion and IGM
gas density of rich, evolved clusters, as well as a clumpy IGM
distribution, might thus be at the origin of ram-pressure stripped
galaxies up to one virial radius.
One of the most intriguing (and still open)
questions regarding the effects of the environment on the evolution of
galaxies is that of the origin of lenticulars, and their overabundance
in the centers of rich clusters. Are lenticulars an independent
population of galaxies formed in the primordial high-density
environments, or were they spiral disks whose star formation activity
had been quenched once their gas reservoir was removed by the
unfavorable cluster environment?
The present work has shown for the first time how a
galaxy-cluster IGM interaction is able to remove most of the gas
reservoir, inducing important structural modifications in the
stellar disk properties. We have in fact shown that, because of the
differential radial stellar evolution of spiral disks, we can expect that
cluster spirals have (at least at short wavelengths) more truncated disk
profiles, inverting the outer color gradient with respect to similar
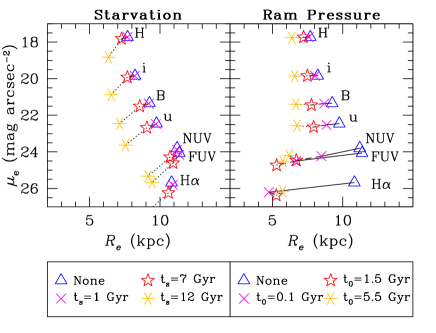
but unperturbed objects. The surface
brightness of the disk, however, mildly decreases in H and in
the UV bands while remaining mostly constant at longer wavelengths,
even 5 Gyr after the interaction
(Fig. 10) 44440% of S0 galaxies in the Coma cluster underwent
a star formation event in their centers in the last 5 Gyr, Poggianti et al. (2001)..
The differential evolution of the stellar disk due to gas
stripping alone is thus not able to reproduce the 0.65 mag increased
central surface brightness of present-day lenticulars (Dressler 1980; Boselli & Gavazzi
2006). In the case of starvation stellar disks are not truncated ( just slightly decreases)
while surface brightnesses significantly decrease on long time scales.
Gravitational perturbations, such as tidal
interactions with other galaxies (Merritt 1983), interactions with the
cluster potential well (Byrd & Valtonen 1990) or a mixture of both
must be invoked to reproduce the observed properties of nearby
lenticulars. As described in the introduction, similar conclusions
have been obtained from the analysis of statistical, kinematical,
structural and spectro-photometrical properties of nearby clusters.
This new study is consistent with the idea that the present evolution
of late-type galaxies in clusters differs from that at earlier epochs,
where late-type galaxies were mostly perturbed by dynamical
interactions (pre-processing and/or galaxy harassment; Dressler 2004,
Moore et al. 1996) which were able to thicken the stellar disks
thereby producing the present-day cluster lenticulars.
To conclude
we can say that the combination of multifrequency observations of
spatially resolved cluster galaxies combined with multi-zone
spectro-photometric models of galaxy evolution provides an extremely useful
tool to study the evolution of cluster galaxies. The results here
presented for a typical HI-deficient, anemic Virgo cluster galaxy and
extrapolated to the whole cluster galaxy population indicate that:
1) The gas removal due to a ram-pressure stripping event can reproduce
the observed radial truncation of the stellar disk stronger at shorter
wavelengths. On the other hand, starvation is not able to truncate gas or
stellar disks.
2) As a consequence, color gradients make cluster
objects redder in the outer disk than in the inner regions, and are thus
inverted with respect to normal, isolated late-type galaxies.
3) This technique is useful to age-date the interaction. If NGC 4569
represents the
typical HI-deficient cluster galaxy with truncated H and HI
disk and normal intermediate age stellar disk, then our modeling suggests that gas
stripping is a relatively recent event since it probably took place 500 Myr ago in these systems.
4) The effective surface brightness of the stripped galaxies
remains constant or even mildly
decreases after the interaction.
We hope to confirm this original
result in the near future once multi-frequency data come available for
a statistical significant sample of late-type cluster galaxies.
References
- (1)
- (2) Abazajian, K., et al., 2005, 129, 1755
- (3)
- (4) Balogh, M.L., Navarro, J.F., & Morris, S.L., 2000, ApJ, 540, 113
- (5)
- (6) Boissier, S., & Prantzos, N. 1999, MNRAS, 307, 857
- (7)
- (8) Boissier, S. & Prantzos, N., 2000, MNRAS, 312, 398
- (9)
- (10) Boissier, S., Boselli, A., Prantzos, N., & Gavazzi, G. 2001, MNRAS, 321, 733
- (11)
- (12) Boissier, S., Prantzos, N., Boselli, A. & Gavazzi, G., 2003, MNRAS, 346, 1215
- (13)
- (14) Boissier, S., Boselli, A., Buat, V., Donas, J. & Milliard, B., 2004, A&A, 424, 465
- (15)
- (16) Boselli, A. & Gavazzi, G., 2002, A&A, 386, 124
- (17)
- (18) Boselli, A. & Gavazzi, G., 2006, PASP, 118, 517
- (19)
- (20) Boselli, A., Tuffs, R., Gavazzi, G., Hippelein, H. & Pierini, D., 1997, A&AS, 121, 507
- (21)
- (22) Boselli, A., Gavazzi, G., Donas, J. & Scodeggio, M., 2001, AJ, 121, 753
- (23)
- (24) Boselli, A., Lequeux, J. & Gavazzi, G., 2002, A&A, 384, 33
- (25)
- (26) Boselli, A., Gavazzi, G. & Sanvito, G., 2003, A&A, 402, 37
- (27)
- (28) Boselli, A., Lequeux, J., Gavazzi, G., 2004, A&A, 428, 409
- (29)
- (30) Buat, V., Iglesias-Paramo, J., Seibert, M., et al., 2005, ApJ, 619, L51
- (31)
- (32) Byrd, G. & Valtonen, M., 1990, ApJ, 350, 89
- (33)
- (34) Cayatte, V., van Gorkom, J., Balkowski, C., & Kotanyi, C., 1990, AJ, 100, 604
- (35)
- (36) Cayatte, V., Kotanyi, C., Balkowski, C.& van Gorkom, J., 1994, AJ, 107, 1003
- (37)
- (38) Christlein, D., Zabuldoff, A.I., 2004, ApJ, 616, 192
- (39)
- (40) Cortese, L., Boselli, A., Buat, V., et al., 2006a, ApJ, 637, 242
- (41)
- (42) Cortese, L., Gavazzi, G., Boselli, A., Franzetti, P., Kennicutt, R., O’Neil, K., Sakai, S., 2006b, A&A, in press (astro-ph/0603826)
- (43)
- (44) Cowie, L.L., & Songaila, A., 1977, Nat., 266, 501
- (45)
- (46) Dale, D., Helou, G., Contursi, A., Silbermann, N., Kolhatkar, S., 2001, ApJ, 549, 215
- (47)
- (48) Dale, D., Bendo, G., Engelbracht, C., et al., 2005, ApJ, 633, 857
- (49)
- (50) Dressler, A., 1980, ApJ, 236, 351
- (51)
- (52) Dressler, A., 1986, ApJ, 301, 85
- (53)
- (54) Dressler, A., in ”Clusters of Galaxies: Probes of Cosmological Structure and Galaxy Evolution”, Cambridge University Press, ed. by Mulchaey et al., 2004, p. 207
- (55)
- (56) Fujita, Y., 1998, ApJ, 509, 587
- (57)
- (58) Fujita, Y., 2004, PASJ, 56, 29
- (59)
- (60) Fujita, Y., Nagashima, M., 1999, ApJ, 516, 619
- (61)
- (62) Gavazzi, G., Pierini, D. & Boselli, A., 1996, A&A, 312, 397
- (63)
- (64) Gavazzi, G., Franzetti, P., Scodeggio, M., Boselli, A. & Pierini, D., 2000, A&A, 361, 863
- (65)
- (66) Gavazzi, G., Boselli, A., Mayer, L., Iglesias-Paramo, J., Vilchez, J.M., Carrasco, L., 2001, ApJ, 563, L23
- (67)
- (68) Gavazzi, G., Boselli, A., Pedotti, P., Gallazzi, A. & Carrasco, L., 2002a, A&A, 396, 449
- (69)
- (70) Gavazzi, G., Bonfanti, C., Sanvito, G., Boselli, A., & Scodeggio, M., 2002b, ApJ, 576, 135
- (71)
- (72) Gavazzi, G., Boselli, A., Donati, A., Franzetti, P. & Scodeggio, M., 2003, A&A, 400, 451
- (73)
- (74) Gavazzi, G., Zaccardo, A., Sanvito, G., Boselli, A. & Bonfanti, C., 2004, A&A, 417, 499
- (75)
- (76) Gavazzi, G., Boselli, A., van Driel, W., O’Neil, K., 2005, A&A, 429, 439
- (77)
- (78) Gavazzi, G., O’Neil, K., Boselli, A., van Driel, W., 2006a, A&A, 449, 929
- (79)
- (80) Gavazzi, G., Boselli, A., Cortese, L., Arosio, I., Gallazzi, A., Pedotti, P., Carrasco, L., 2006b, A&A, 443, 839
- (81)
- (82) Gil de Paz, A. & Madore, B., 2005, ApJS, 156, 345
- (83)
- (84) Gil de Paz, A., Boissier, S., Madore, B., et al., 2006, ApJS, in press
- (85)
- (86) Gomez, P.L., Nichol, R.C., Miller, C.J., et al., 2003, ApJ, 584, 210
- (87)
- (88) Gunn, J.E., & Gott, J.R.I., 1972, ApJ, 176, 1
- (89)
- (90) Jarrett, T., Chester, T., Cutri, R., Schneider, S. & Huchra, J., 2003, AJ, 125, 525
- (91)
- (92) Jogee, S., Scoville, N., Kenney, J., 2005, ApJ, 630, 837
- (93)
- (94) Helfer, T., Thornley, M., Regan, M., et al, 2003, ApJS, 145, 259
- (95)
- (96) Hinz, J.L., Rieke, G.H., & Caldwell, N., 2003, AJ, 126, 2622
- (97)
- (98) Hou, J. L., Prantzos, N., & Boissier, S. 2000, A&A, 362, 921
- (99)
- (100) Iglesias-Paramo, J., Boselli, A., Gavazzi, G., Zaccardo, A., 2004, A&A, 421, 887
- (101)
- (102) Kenney, J. & Young, J., 1988, ApJS, 66, 261
- (103)
- (104) Kenney, J., van Gorkom, J. & Vollmer, B., 2004, ApJ, AJ, 127, 3361
- (105)
- (106) Kennicutt, R., Armus, L., Bendo, G., et al., 2003, PASP, 115, 928
- (107)
- (108) Koopmann, R. & Kenney, J., 2004a, ApJ, 613, 851
- (109)
- (110) Koopmann, R. & Kenney, J., 2004b, ApJ, 613, 866
- (111)
- (112) Koopmann, R., Haynes, M., Catinella, B., 2006, AJ, 131, 716
- (113)
- (114) Kroupa, P., Tout, C. A., & Gilmore, G. 1993, MNRAS, 262, 545
- (115)
- (116) Larson, R. B. 1976, MNRAS, 176, 31
- (117)
- (118) Larson, R., Tinsley, B. & Caldwell, N., 1980, ApJ, 237, 692
- (119)
- (120) Lewis, I., Balogh, M., De Prorpis, R., et al., 2002, MNRAS, 334, 673
- (121)
- (122) Martin, C. L., & Kennicutt, R. C. 2001, ApJ, 555, 301
- (123)
- (124) Merritt, D., 1983, ApJ, 264, 24
- (125)
- (126) Mo, H. J., Mao, S., & White, S. D. M. 1998, MNRAS, 295, 319
- (127)
- (128) Moore, B., Katz, N., Lake, G., Dressler, A. & Oemler, A., 1996, Nat., 379, 613
- (129)
- (130) Nichol, R.C., 2004, in Clusters of Galaxies: Probes of Cosmological Structure and Galaxy Evolution, p24
- (131)
- (132) Nulsen, P.E.J., 1982, MNRAS, 198, 1007
- (133)
- (134) Poggianti, B.M., Bridges, T.J., Carter, D., et al., 2001, ApJ, 563, 118
- (135)
- (136) Poggianti, B.M., Bridges, T.J., Komiyama, Y., et al., 2004, ApJ, 601, 197
- (137)
- (138) Prantzos, N., & Boissier, S. 2000, MNRAS, 313, 338
- (139)
- (140) Rubin, V., Waterman, A. & Kenney, J., 1999, AJ, 118, 236
- (141)
- (142) Samland, M., Hensler, G., & Theis, C. 1997, ApJ, 476, 544
- (143)
- (144) Solanes, J.M., Marrique, A., Garcia-Gomez, C., Gonzales-Casado, G., Giovanelli, R., Haynes, M., 2001, ApJ, 548, 97
- (145)
- (146) Tanaka, M., Goto, T., Okamura, S., Shimasaku, K., & Brinkmann, J., 2004, AJ, 128, 2677
- (147)
- (148) Tinsley, B. M. 1980, Fundamentals of Cosmic Physics, 5, 287
- (149)
- (150) Treu, T., Ellis, R. S., Kneib, J.-P., Dressler, A., Smail, I., Czoske, O., Oemler, A., & Natarajan, P. 2003, ApJ, 591, 53
- (151)
- (152) van den Bergh, S., 1976, ApJ, 206, 883
- (153)
- (154) Vázquez, G. A., & Leitherer, C. 2005, ApJ, 621, 695
- (155)
- (156) Vollmer, B., Cayatte, V., Boselli, A., Balkowski, C. & Duschl, W., 1999, A&A, 349, 411
- (157)
- (158) Vollmer, B., Marcelin M., Amram, P., Balkowski, C., Cayatte, Garrido, O., 2000, A&A, 365, 532
- (159)
- (160) Vollmer, B., Braine, J., Balkowski, C., Cayatte, V. & Duschl, W., 2001a, A&A, 374, 824
- (161)
- (162) Vollmer, B., Cayatte, V., Balkowski, C. & Duschl, W., 2001b, ApJ, 561, 708
- (163)
- (164) Vollmer, B., Balkowski, C., Cayatte, V., van Driel, W. & Huchtmeier, W., 2004a, A&A, 419, 35
- (165)
- (166) Vollmer, B., Beck, R., Kenney, J., van Gorkom, J., 2004b, AJ, 127, 3375
- (167)
- (168) Vollmer, B., Braine, J., Combes, F., Sofue, Y., 2005, A&A, 441, 473
- (169)
- (170) Whitmore, B.C., Gilmore, D.M., & Jones, C., 1993, ApJ, 407, 489
- (171)
- (172) Yoshida, M., Ohyama, Y., Iye, M., et al., 2004, AJ, 127, 90
- (173)