A Search for Molecular Gas
in Low Luminosity Radio Galaxies
Abstract
We discuss CO spectral line data of a volume-limited sample of 23 nearby
() low luminosity radio galaxies, selected from the B2 catalogue.
Most of such objects (16/23) have HST imaging.
Our aim is to establish the
distribution of molecular gas masses in low luminosity radio galaxies, in
comparison with other radio source samples,
confirm the suggestion that the CO is in
ordered rotation, determine its relation to the dust disks observed
in these objects with HST and establish targets for future interferometric
imaging.
1INAF - Istituto di Radioastronomia, Via P. Gobetti 101, I-40129
Bologna, Italy
2European Southern Observatory, Karl-Schwarzschild-Str. 2, D-85748 Garching
b. Munchën, Germany
3INAF - Osservatorio Astronomico di Bologna, Via Ranzani 1, I-40127
Bologna, Italy
1. Background
The fuelling of relativistic jets in radio-loud active galactic nuclei is still
not fully understood. It is clear that energy is released in the vicinity of a
supermassive black hole, but whether the mechanism is direct electromagnetic
extraction of rotational kinetic energy (e.g. Blandford & Znajek 1977;
Koide et al. 2002) or more closely related to the process of accretion
(e.g. Blandford & Payne 1982; Hujeirat et al. 2003) remains a matter of
debate. The ratio of energy
flux in jets to that radiated by an accretion disk varies by orders of
magnitude between different classes of AGN. Here, we are concerned
with low-luminosity (FRI) radio galaxies (Fanaroff & Riley 1974).
These are known to contain very massive black holes, but show very little
evidence for emission from accretion disks, their nuclear luminosities
being a small fraction of that expected from accretion at the Eddington rate,
(Marchesini, Celotti, & Ferrarese 2004).
They form the parent population for nearby BL Lac objects and must
therefore produce highly relativistic jets on sub-pc scales. There is direct
evidence for relativistic motion on parsec scales in FR I jets (Giovannini et
al., 2001) and for smooth deceleration from relativistic to sub-relativistic
speeds on scales of 1 – 10 kpc (Laing et al., 1999).
FR I radio sources are located in fairly normal elliptical galaxies,
invariably containing hot, X-ray emitting plasma
(thought to confine the jets on large scales), but little ionized,
line-emitting material at K. It has recently become clear that
they may also contain substantial amounts of cool gas and dust
(e.g. de Ruiter et al. 2002; Verdoes Kleijn & de Zeeuw 2005; Lim et
al. 2000, 2003).
Dust is observed in 53% of the B2 sample of nearby radio galaxies
(mostly FRI; see below) and the dust mass is correlated with radio power
(de Ruiter et al., 2002). There is also a connection between the dust-lane
morphology (disk/irregular) and the presence of jets, and some tendency for
dust lanes and jets to be orthogonal (de Ruiter et al. 2002;
Verdoes Kleijn & de Zeeuw 2005).
These associations argue that accretion of cool gas may indeed power the
radio jets.
The next step is to understand the dynamics of the cool gas. Lim et al. (2000)
detected 12CO (1 0) and (2 1) emission from
the FR I radio galaxies 3C 31 and 264 with the IRAM 30m Telescope and
established that the line profiles indicate disk rotation.
Interferometric observations of 3C 31 by Okuda et al. (2005) showed
that the CO coincides spatially with the dust disk observed by HST (Martel et
al., 1999) and is in ordered rotation. These authors suggest that the cool gas
is in stable orbits.
In order to increase the number of FR I radio galaxies with CO
observations and so to improve our knowledge of their molecular gas properties,
we are studying a volume-limited sample of 23 nearby
() low luminosity radio galaxies, selected from the B2
catalogue (Colla et al., 1975). We notice that for 16 of such objects HST
imaging is available (Capetti et al., 2000).
The CO properties of this sample are compared to the 23
3C radio galaxies studied by
Lim et al. (2003) and to the 18 (or km/s)
UGC galaxies with radio jets, studied by Leon et al. (2003).
We notice that the three samples are partially overlapping.
| Source | 12CO(10) | 12CO(21) | |||||
| K km/s | km/s | K km/s | km/s | M | |||
| - | - | - | - | ||||
| 545 | 5.4 | 551 | 7.7 | ||||
| 382 | 6.6 | 127 | 2.4 | ||||
| - | - | 171 | 1.9 | ||||
| 807 | 3.6 | 679 | 3.4 | ||||
| 670 | 23.0 | 672 | 16.7 | ||||
| 346 | 3.3 | 335 | 3.1 | ||||
| - | - | 297 | 2.7 | ||||
| - | - | 129 | 4.1 | ||||
| derived from CO(10) measures and assuming km/s/Mpc | |||||||
2. Line Observations and Measurements
We used the IRAM 30m telescope to search for emission in the (10) and (21) transitions of 12CO in 9 B2 radio galaxies of the volume-limited sample, described above. We used receivers A100 and B100 connected to the 1 MHz filter bank in MHz blocks together with receivers A230 and B230 with the 4 MHz filter bank in GHz blocks. After averaging the outputs of the two pairs of receivers we got noise levels of mK and mK respectively (, km/s). The data were reduced with the CLASS package and line fluxes were measured by numerically integrating over the channels in the line profile. Line widths were measured as full widths at 50% of the peak. A source was considered detected when both (10) and (21) emission lines have , with at least one having . In case of non detections, upper limits were calculated (see Evans et al., 2005). A summary of our CO line measurements is given in Table 1. Line widths of the 5 detected sources are of the order of 500 km/s, and in a few cases lines show a double-horn structure, indicating rotating CO disks. molecular masses were derived as in Lim et al. (2000).
3. Molecular gas properties of the B2 sample

In Fig. 1 we compare the molecular mass content, ,
to the content in dust, , as derived from both IRAS
far-infrared (empty symbols) and HST optical (filled symbols)
observations for the B2 radio galaxies.
To our measurements (see Table 1) we have added
CO line measurements for other 7 galaxies which were observed as part of
the UGC and 3C samples (Leon et al. 2003; Lim et al. 2003, see Sect. 1).
This means that our analysis is based on 16 of the 23 galaxies
(i.e. of the whole sample).
We notice that
. The fact that
probably just reflects the
different scales probed in the two cases:
the whole galaxy for IRAS FIR observations and the
inner galaxy core for HST high resolution observations. On the other
hand, the CO observations are approximately sensitive to the same scale
as HST ( kpc at the 12CO(10) observing frequency), and
a comparison is more meaningful.
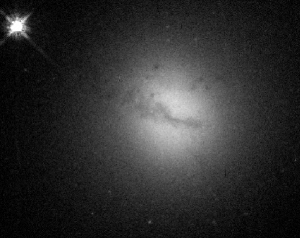
Our observations show several hints for a physical link between the
dust component probed by HST and the molecular gas
probed by CO: CO was detected only in those galaxies showing dust
in HST images and double-horn CO lines were found in two galaxies, both
showing HST rotating dusty disks (see example in Fig. 2).
Such evidences reinforce previous indications by Lim et al. (2000) and
Okuda et al. (2005). For further confirmation on the gas dynamics, the most
suitable B2 radio sources will be proposed for interferometry at Plateau de
Bure.

4. Comparison with other samples
We compared the B2 radio galaxy sample to the 3C and the UGC radio samples (Lim et al. 2003; Leon et al. 2003). To take into account the differences in volume, we limited the comparison to all objects with . In such range we found no significant difference: molecular gas masses are very similar, approximately spanning the range M⊙, with upper limits varying from M⊙ to M⊙, depending on distance. Also CO detection rates do not differ significantly in the three samples: , , and , for the UGC, 3C and B2 samples respectively. We notice however that the statistics is poor and larger samples are needed to better constrain the molecular gas properties of such objects.
References
- (1) Blandford, R.D., & Payne, D,G. 1982, MNRAS, 199, 883
- (2) Blandford, R.D., & Znajek, R.L. 1977, MNRAS, 179, 433
- (3) Capetti, A., de Ruiter, H.R., Fanti, R., et al., 2000, A&A, 362, 871
- (4) Colla, G., Fanti C., Fanti R., et al., 1975, A&A, 38, 209
- (5) de Ruiter, H.R., Parma, P., Capetti, A., Fanti R., Morganti R. 2002, A&A, 396, 857
- (6) Evans A.S., Mazzarella J.M., Surace J.A., et al., 2005, ApJS, 159, 197
- (7) Fanaroff, B.L., & Riley, J.M. 1974, MNRAS, 167, 31P
- (8) Giovannini, G., Cotton, W.D., Feretti, L., Lara, L., Venturi, T. 2001, ApJ, 552, 508
- (9) Hujeirat, A., Livio, M., Camenzind, M., Burkert, A. 2003, A&A, 408, 415
- (10) Koide, S., Shibata, K., Kudoh, T., Meier, D.L. 2002, Sci, 295, 1688
- (11) Laing, R.A., Parma, P., de Ruiter, H.R., Fanti, R. 1999, MNRAS, 306, 513
- (12) Leon, S., Lim, J., Combes, F., van-Trung, D. 2003, ASP Conf. Series, 290, 525
- (13) Lim, J., Leon, S., Combes, F., van-Trung, D. 2000, ApJ, 545, L93
- (14) Lim, J., Leon, S., Combes, F., van-Trung, D. 2003, ASP Conf. Series, 290, 529
- (15) Marchesini, D., Celotti, A., & Ferrarese, L. 2004, MNRAS, 351, 733
- (16) Martel, A.R., Baum S.A., Sparks W.B., et al., 1999, ApJS, 122, 81
- (17) Okuda, T., Kohno, K., Iguchi, S., Nakanisji, K. 2005, ApJ, 620, 673
- (18) Verdoes Kleijn, G., & de Zeeuw, T. 2005, A&A, in press (astro-ph/0502075)