Puzzled by GRB 060218
Abstract
We study the optical–UV/X–ray spectral energy distribution of GRB 060218 during the prompt phase and during what seems to be the afterglow phase. The results are puzzling, since if the opt–UV and the X–ray emission belong to a single black–body, then its luminosity is too large, and this black–body cannot be interpreted as the signature of the shock breakout of the supernova. There are also serious problems in associating the emission expected by the supernova shock breakout with either the opt–UV or the X–ray emission. In the former case we derive too small ejecta velocities; in the latter case, on the contrary, the required velocity is too large, corresponding to the large radius of a black–body required to peak close to the UV band. We then present what we think is the most conservative alternative explanation, namely a synchrotron spectrum, self–absorbed in the opt–UV and extending up to the X–ray band, where we observe the emission of the most energetic electrons, which are responsible for the exponential roll–over of the spectrum. The obtained fit can explain the entire spectrum except the black–body observed in the X–rays, which must be a separate component. The puzzling feature of this interpretation is that the same model is required to explain the spectrum also at later times, up to s, because the opt–UV emission remains constant in shape and also (approximately) in normalisation. In this case the observed X–ray flux is produced by self–Compton emission. Thus the prompt emission phase should last for s or more. Finally, we show that the black–body observed in X–rays, up to 7000 seconds, can be photospheric emission from the cocoon or stellar material, energized by the GRB jet at radii comparable to the stellar radius (i.e. – cm), not very far from where this material becomes transparent (e.g. cm).
keywords:
gamma rays: bursts; radiation mechanisms: thermal, non–thermal.1 Introduction
The burst exploded February 18, 2006 is a low redshift burst (, Mirabal et al. 2004), associated to the Type Ibc supernova SN2006aj (e.g. Modjaz et al. 2006, Mazzali et al. 2006). Due to its long duration (more than 3000 s) GRB 060218 could be followed simultaneously with the BAT, XRT and UVOT instruments onboard the SWIFT satellite (Gehrels et al. 2004). The 0.3–10 keV X–ray light curve (followed by XRT starting 157 s after the BAT trigger) presents three main phases (Campana et al. 2006, hereafter C06): phase X1: a smooth/long ( s) bump peaking at s whose time–integrated spectrum shows a non–thermal component (power-law with an exponential cutoff) peaking (in ) in the X-ray band ( keV) and a black–body which comprises about 20% of the total 0.3–10 keV flux and dominates the soft X-ray energy band ( keV); X2: a steep power–law (or exponential) time–decay up to 104 s still showing a slightly softer ( keV) black–body component (comprising about 50% of the total flux) together with a softer non–thermal component; X3: a shallower flux decay () starting at 104 s, and lasting up to several days, with a very soft (energy spectral index ; Cusumano et al. 2006) non–thermal component. The optical–UV light curve presents 2 phases: in phase UV1 there is a slow increase of the flux, peaking at s, followed by a fast decay up to s; in phase UV2 there is a second bump peaking at 10 days showing the typical spectral signatures of the underlying supernova (Ferrero et al. 2006; Mirabal et al. 2006; Modjaz et al. 2006; Sollerman et al. 2006) and suggesting photospheric expansion velocities of 2 km s-1 (e.g. Pian et al. 2006). Finally, in the radio band, the flux between 2 and 22 days shows a typical power law decay (, Soderberg et al. 2006).
Despite the available wealth of information, some of the observed properties of GRB 060218 are not yet understood. In fact, although the radio flux could be due to external shocks, the radio spectrum at 5 days is inconsistent with the strong X–ray emission at the same epoch (Soderberg et al. 2006). Moreover, the typical late time X–ray light curve decay (phase X3) is hardly reconcilable with the extremely soft spectrum in the framework of the external shock model for GRB afterglows. This suggests that the late time X–ray emission might be produced by a continued activity of the central engine (i.e. “central engine afterglow” – Fan, Piran & Xu 2006).
2 The spectral energy distribution of GRB 060218
The most striking characteristic of GRB 060218 is perhaps the observation, in the XRT 0.2–10 keV band, of a quasi–steady black–body component at a temperature of 0.18–0.1 keV, observed up to 7000 s (i.e. phases X1 and X2) and with a total energy of erg. At opt–UV frequency as well, the emission is well described by the Rayleigh–Jeans tail of a black–body spectrum up to s after trigger (phase UV1). It has been proposed (C06) that the opt–UV (UV1) and the X–ray (X1 and X2) emission are produced by the same process: the shock breakout of the supernova.
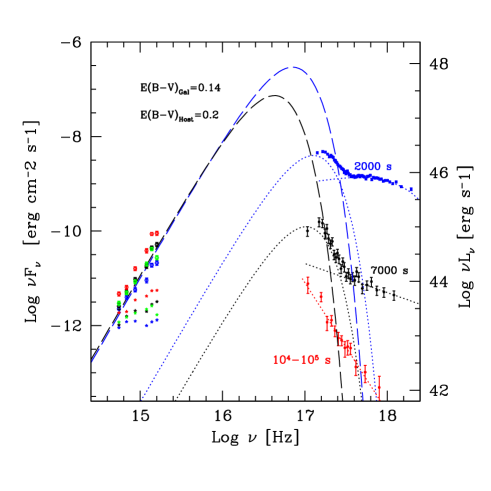
In Fig. 1 we show the optical 111 The opt–UV data shown in C06 are not de–absorbed, and are in the form of specific fluxes multiplied by the FWHM widths of the different UVOT filters [i.e. what is plotted is ]. To convert in fluxes, we have used . to X–ray SED of GRB 060218 roughly corresponding to the same three epochs (X1, X2 and X3) described in the introduction. Both the UVOT and the XRT data have been de–absorbed, using the same and values given in C06. However, one can see that the optical–UV data, independently of the assumed extinction, are above the extrapolation of the black–body emission observed in XRT. Furthermore, the opt-UV data de–reddened using the values in C06 describe, at early times, a Rayleigh–Jeans tail of a black–body.
If the X–ray emission and the opt–UV flux belong to the same black–body component, then the derived black–body luminosity is huge, exceeding erg s-1. This luminosity, if produced by the subrelativistic SN shock breakout, should not be boosted by relativistic effects. Since this luminosity would last for s, we would then infer a total radiated energy exceeding erg. This energy is close to (or above) the total kinetic energy of the supernova ejecta erg (Mazzali et al. 2006). Furthermore, trying to model the X–ray data with a cut–off power law plus a black–body equal to the one joining the opt–UV and the X–rays (long-dashed lines in Fig. 1) produces an unacceptable fit. We therefore consider this possibility as highly unlikely.
Consider now the case of a multi–color black–body, joining the opt–UV and X–ray band. In this case the opt–UV emission, belonging to the Rayleigh–Jeans tail of the coldest black–body, is characterised by a very large radius (of order of cm). This radius cannot correspond to the radius at which the supernova ejecta have arrived after 2000 seconds from the trigger, if we maintain the hypothesis that the supernova and the GRB exploded nearly simultaneously (Mirabal et al. 2006).
The total energetics of a black–body joining the opt–UV and X–ray data is so large to be problematic even if it is beamed radiation produced by a relativistically moving cocoon, since it would exceed by orders of magnitude the energetics produced by the jet which is supposed to energize it, and whose emission should be observed, if the bursts is not misaligned.
3 X–ray or opt–UV black–body as supernova shock breakout?
Since we have discarded the possibility of a single (or a multi–color) black–body joining the opt–UV and the X–ray emission, let us discuss the case of a supernova shock breakout associated with either the opt–UV emission or the X–ray black–body.
Assume first that the association is with the X–ray black–body. Detailed modelling of the shock breakout (Li 2006) flashes in SN explosions predicts a temperature of 1.8 keV (0.2 keV), a duration of 20 s and an emission in the X–ray band amounting to a radiated energy of erg for a typical hypernova, and erg for “normal” SNe Ibc. These values are inconsistent with the temperature, duration and energetics of the observed X–ray black–body component of GRB 060218. In addition to this, the radii derived from the black–body fit to the X–ray data (C06) are increasing in time, but at a rate corresponding to a very small velocity: 3000 km s-1, in contrast with the (decreasing) velocities derived by the optical spectroscopy by Pian et al. (2006), which shows velocities of 20,000 km s-1 at one day from the trigger.
Consider now the association with the opt–UV. In this case one can assume that the flux in this band belongs to a black–body peaking at (or not too above) the largest observed frequency (to limit the implied energetics), but in this case the corresponding black–body radius is around cm. Then, if the supernova exploded around the same time of the GRB, the implied velocity of the ejecta exceeds .
In summary: a single black–body joining the opt–UV and the X–ray fluxes is too energetic; the black–body emission expected from a SN shock breakout cannot be associated with the black–body observed in the X–rays (too small inferred velocities of the ejecta), nor with a black–body peaking in the UV (too large ejecta velocities).
We are then forced to explore alternative possibilities to explain the SED of this burst. One possibility is that the entire SED (except the X–ray black–body component) is produced by the synchrotron process, which can account for the optical–UV very hard spectrum if it self–absorbs at or above the UV band. This model will be discussed in the next section.
4 A synchrotron self–Compton model
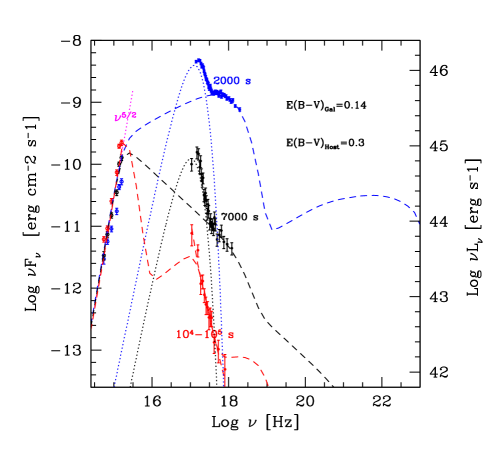
Assume that the overall opt–UV to X–ray SED, excluding the X–ray black–body, belongs to the same synchrotron spectrum. For simplicity assume that this radiation is produced in a jet, with cross sectional radius , width (as measured in the comoving frame), semi–aperture angle , embedded in a tangled magnetic field , moving with a bulk Lorentz factor . We assume that the radiation we observe is produced at a fixed distance form the jet apex. In other words, the conversion of bulk kinetic into random energy occurs at the same location along the jet, for the entire duration of the burst. The viewing angle is supposed to be smaller than . Assume also that the emitting particles are distributed in energy according to a simple power law between and . We require that the synchrotron spectrum self–absorbs at a frequency close to Hz. If is small (around unity), then the self absorbed spectrum should be . Note that the opt–UV spectrum shown in Fig. 1 assumed a spectral slope to derive the extinction in the host frame (C06). A spectrum requires a small increase in the host extinction: increases from 0.2 to 0.3.
This is shown in Fig. 2, together with the results of the synchrotron self–Compton model (dashed lines), at 2000 s, s and at a time between and s.
For the 2000 s spectrum, we have used cm, cm, , a semi–aperture angle of the jet , G, and , between and . We assumed a Doppler factor , appropriate for on–axis observers (but the results are nearly the same for observers within the jet opening angle). For the comoving intrinsic luminosity we set erg s-1. To obtain the isotropically equivalent luminosity we used , while the monochromatic luminosities have been boosted by . The self–Compton luminosity is a factor less then the synchrotron one.
For the 7000 s spectrum we can describe the spectrum by changing only the slope of the electron distribution from 2.3 to 4.2, and mantaining constant all other parameters. The choice of is not free, since it is dictated by the measured slope of the X–ray continuum. This “drastic” change of on such a short timescale may appear odd, but it is not unprecedented: in fact blazars show such a behavior quite often (see e.g. Mkn 501 in Sambruna et al. 2000).
For the late SED (at – s), we again changed only the electron distribution function, introducing a break at . Below this break , above it , a value so large to mimic an exponential roll–off. The observed radiation in the X–rays corresponds to the first order self–Compton scattering. Within this scheme, since the opt–UV flux remains almost the same, and is described by an absorbed spectrum, we have that must be the same as before. Therefore this radiation is not afterglow, but late prompt emission (as also proposed by Fan et al. 2006). Since the slope of the electron distribution is much steeper, what we see in the X–rays at such late times is the first order self–Compton spectrum. This explains why we observe an uncommonly soft X-ray spectrum at times s.
Using the chosen parameters, the value of the corresponding Poynting flux erg s-1. If this corresponds to a conserved quantity, then the value of at a distance of cm (where cm) from the central power–house is G. The value of is much greater than the kinetic power carried by the protons associated with the emitting electrons (assuming one proton per electron), but there is the possibility that only a fraction of leptons are accelerated. In this case the kinetic energy of protons would increase.
The self absorbed synchrotron luminosity , while for the optically thin part where is the energy spectral index. Including , we then have 5 unknowns () and only two observables (the optically thick and thin part of the spectrum). The cut–off energy fixes directly once and are given, and the observed slope directly fixes .
The found solution therefore is not unique, but we were guided in the choice of the parameters by some additional constraints: i) the Comptonization parameter should not be greater than unity, to not produce too much self–Compton emission; ii) the needed self–absorption frequency is rather large, and requires a large value of the magnetic field, suggesting a small size of the source. However, a lower limit to the size of the emission region can be obtained by requiring that it is transparent to Thomson scattering; iii) in strong magnetic fields, the radiative cooling times are much shorter than the dynamical times, and all electrons can cool down to . These additional constraints, however, are not enough to single out a unique solution, and the models shown in Fig. 2 should be considered as illustrative examples only. This SSC model, on the other hand, can explain in a simple way why the optical UV flux changes much less than the X–ray flux, since it is due to the self–absorbed flux, much less sensitive to changes in the electron distribution.
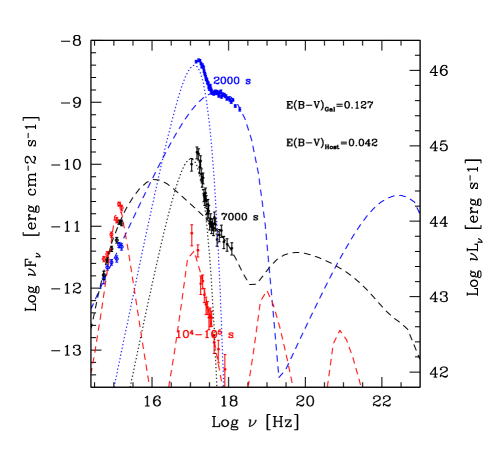
Another concern is the adopted value of the optical extinction, which is uncertain. Sollerman et al. (2006) proposed a significant lower value: and . In this case the de–reddened opt–UV flux does not describe a law, being approximately intermediate between and . In Fig. 3 we show our SSC model in this case: the parameters are similar to the ones used for Fig. 2, the differences being in the chosen values of (now equal to 100 for the 2000 s spectrum, 35 for the 7000 s spectrum and 7.1 for the – s spectrum). We had to change the size and the magnetic field value from cm and G for the 2000 s spectrum to cm and G for the other two spectra. The other parameters are the same as for the model in Fig. 2.
Within this SSC scenario the “afterglow” of GRB 060218 is instead late prompt emission. The quasi–exponential decline in the X–ray light curve after roughly 3000 seconds is produced by the synchrotron tail going out from the observed 0.2-10 keV X–ray energy window, while the subsequent power law decay is produced by the first order self Compton emission entering (and remaining) in this energy band. Since the electron distribution becomes steeper and steeper in time, this may explain why the temporal decay of the X–ray “afterglow” seems normal, while the spectral slope is much steeper than in the majority of GRBs: being prompt emission, no closure relation can be applied to the light curve and spectrum of GRB 060218.
5 The X–ray Black–body
Here we try to explain the nature of the soft black–body (0.1–0.18 keV) component observed in the X–ray band up to 7000 s. It has been proposed that this soft X–ray thermal component corresponds to the shock breakout in a dense wind–like circumburst environment222 Note that if instead the shock breakout happens in a normal stellar envelope the required progenitor’s radius is cm which is much larger than what expected for an H–He envelope–stripped progenitor as suggested from spectroscopy (Pian et al. 2006) (C06) although theoretical modelling seems to rule out this possibility (Li 2006). Alternative explanations (Fan, Piran & Xu 2006) invoke the thermal emission from a hot cocoon (e.g. Ramirez–Ruiz, Celotti & Rees 2002) surrounding the jet. It was also proposed that the non–thermal prompt component observed in GRB 060218 might result from the bulk Comptonization of the soft X–ray thermal photons by a mildly relativistic jet (Wang, Li, Waxman & Meszaros 2006).
Here we investigate if the observed soft X–ray black–body component might be interpreted within the classical GRB fireball model. We consider two possible scenarios, namely the black–body we see in the X–rays is the leftover from the initial acceleration, or it is the result of some dissipation (Rees & Meszaros 2005; Peér, Meszaros & Rees, 2006; Thompson 2006) occurring later, inside the star or in the vicinity of its surface. In the former case we expect that the initial black–body has a large temperature and luminosity, while in the latter the black–body “degrades” much less, and the observed temperature and luminosity are not vastly different from their initial values.
In the case of an adiabatic expansion, due to the conversion of internal energy into bulk motion, the dynamics is controlled by four parameters: the initial radius , the initial luminosity of the radiation assumed to be responsible for the expansion, the initial bulk Lorentz factor and the outflow mass rate , assumed to be constant during the expansion. The initial kinetic power of the material is . We then follow the usual prescription of an adiabatic expanding fireball.
According to this scenario, the temperature of the internal radiation is observed to be constant as long as we are in the acceleration phase, while it decreases as between (the radius where the acceleration ends) and , where the fireball becomes transparent (if ). The value of is (Daigne & Mochkovitch 2002; Meszaros 2006)
| (1) |
where is the number of electrons per barion and is the kinetic power of the fireball (i.e. ) in units of erg s-1. At the observed black–body temperature is
| (2) |
where is the initial temperature. The photon number is conserved, hence
| (3) |
For any assumed value of , from Eq. 2 and Eq. 3 one obtains and as a function of the observables and . If we fix only , then and are functions of .
Furthermore, if the power of the fireball is the sum of its initial kinetic plus radiation powers, we can derive and by knowing and we can derive the final value of as a function of , again for a specific value of . Finally, knowing and , we can derive .
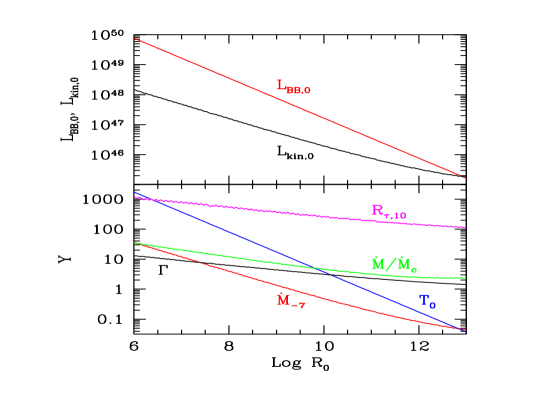
All these quantities are shown in Fig. 4 (as a function of ) for the specific choice of , corresponding to an initial bulk velocity equal to the sound speed of a relativistic plasma. We can see that if we assume that the observed X–ray black–body is the leftover of the initial radiation, injected at cm, then the required initial luminosity is very large, and since this power should last for an unusually long time (for this burst), the isotropically equivalent total energetics becomes huge. Consider instead values of around cm: in this case the black–body is the result of some later dissipation, either in the fireball itself or resulting from the interaction of the fireball with the material forming the cocoon or at the surface of the star.
Since the dissipation occurs in this case much closer to the transparency radius, the black–body does not “degrade” much, being consistent with what we see without implying very large initial luminosities. For we have , s-1, around 1 keV and cm.
6 Summary and conclusions
We have studied the broad band opt–UV to X–ray SED at three epochs which characterise different flux evolution phases observed (C06) both in the X–ray and opt–UV light curves up to s. The spectrum shows a soft ( 0.1–0.18 keV) X–ray black–body component (coupled with a typical non–thermal component) together with a Rayleigh–Jeans tail in the opt–UV band. Both these components are almost steady in flux and slope, while the X–ray black–body is undetected at late times (104–105 s). They have been interpreted (e.g. C06) as the shock breakout of the accompanying (nearly simultaneous) SN2006aj. However, if the X–ray and opt–UV emission belong to the same black–body emission (which we also exclude by direct spectral fitting) its energetics is even larger than the total kinetic energy of the SN ejecta as derived from its late time spectroscopy (e.g. Mazzali et al. 2006; Pian et al. 2006), and cannot be cured by relativistic beaming, since the SN shock is not relativistic. Alternatively, only the X–ray or the opt–UV thermal component might be the shock breakout signal. The former possibility seems to be excluded both by detailed simulations (Li 2006) and because the SN expansion velocity, derived from the X–ray black–body fits, is too small compared to that derived from optical spectroscopy at late times (Pian et al. 2006). On the other hand, a shock breakout in the opt–UV band would imply a too large SN expansion velocity to be consistent with the observed opt–UV early spectrum.
If the SN shock breakout went undetected both in the opt–UV and in the X–ray band we are left with two puzzling quests: (a) which is the nature of the observed early time opt–UV emission (i.e. before the SN radioactive decay emission sets in at 105 s) and (b) what is the origin of the X–ray thermal component?
We explored the possibility that the SED is produced by synchrotron self–Compton emission. A simple synchrotron fit to these data is satisfactory, with the opt–UV data corresponding to the self–absorbed synchrotron spectrum. Although the choice of the input parameter is not unique, the spectra at different times can be modelled by changing the slope of the electron distribution. A remarkable result of these fits is that also the late time (104–105 s) opt–UV emission should be described by the same model (i.e. with the same parameters of the prompt, but with steeper still slopes of the electron distribution). The X–ray flux is in this case first order self–Compton emission and naturally accounts for the unusually soft spectrum observed (which is hardly reconcilable with the normal flux time decay within the context of the standard afterglow model – Fan, Piran & Xu 2006).
Finally, we considered the possibility that the black–body observed in the X–ray band is a separate component. It is consistent to be photospheric emission from the cocoon or some stellar material energized by the GRB jet. The origin of the black–body photons should correspond to dissipation occurring not much below the photospheric radius of this material.
Acknowledgements
We thank S. Campana for useful discussion and for having provided us
the updated UVOT light curves
(see also
http://www.brera.inaf.it/utenti/campana/060218/060218.html).
References
- [] Campana, S., Mangano, V., Blustin, A.J., et al., 2006, Nature, 442, 1008 (C06)
- [] Cusumano, G., Moretti, A., Tagliaferri, G., Kennea, J., Burrows, D., 2006, GCN 4786
- [] Daigne, F. & Mochkovitch, R., 2002, MNRAS, 336, 1271
- [] Fan, Y-Z., Piran, T. & Xu, D., 2006, submitted to JCAP (astro–ph/0604016)
- [] Ferrero, P., Kann, D.A., Zeh, A., et al., 2006, A&A, 457, 857
- [] Gehrels, N., Chincarini, G., Giommi, P., et al., 2004, 2004, ApJ, 611, 1005
- [] Li, L-X. 2006, submitted to MNRAS (astro–ph/0605387)
- [] Mazzali, P., Deng, J., Nomoto, K., Pian, E., Tominaga, N., Tanaka, M. & Maeda, K., 2006, Nature, 442, 1018
- [] Meszaros, P., 2006, Reports on Progresses in Physics, IOP Publishing Ltd, in press (astro–ph/0605208)
- [] Mirabal, N., Halpern, J.P., An, D., Thorstensen, J.R. & Terndrup, D.M., 2006, ApJ, 643, L99
- [] Modjaz, M., Stanek, K.Z., Garnavich, P.M., et al., 2006, ApJ, 645, L21
- [] Peér, A., Meszaros, P. & Rees, M.J., 2006, ApJ, 642, 995
- [] Pei, Y.C., 1993, ApJ, 395, 130
- [] Pian, E., Mazzali, P.A., Masetti, N., et al., 2006, Nature, 442, 1011
- [] Ramirez–Ruiz, E., Celotti, A. & Rees, M.J., 2002, MNRAS, 337, 1349
- [] Rees M. J. & Meszaros P., 2005, ApJ, 628, 847
- [] Sambruna, R., Aharonian, F., Krawczynski, H., et al., 2000, ApJ, 538, 127
- [] Soderberg, A.M., Kulkarni, S.R., Nakar, E., et al, 2006, Nature, 442, 1014
- [] Sollerman, J., Jaunsen, O.A., Fynbo, J.P.U., et al., 2006, A&A, 454, 503
- [] Thompson, C., 2006, ApJ, 651, 333
- [] Wang, X.–Y., Li, Z., Waxman, E. & Meszaros, P., 2006, submitted to ApJ (astro–ph/0608033)