Modeling the hard states of XTE J1550–564 during its 2000 outburst
Abstract
We study hard states of the black-hole binary XTE J1550–564 during its 2000 outburst. In order to explain those states at their highest luminosities, of the Eddington luminosity, , we propose a specific hot accretion flow model. We point out that the highest values of the hard-state are substantially above the an advection-dominated accretion flow (ADAF) can produce, , which is only – even for as high as . On the other hand, we successfully explain the hard states with – using the luminous hot accretion flow (LHAF) model. As is also roughly the highest luminosity an LHAF can produce, such an agreement between the predicted and observed highest luminosities provides by itself strong support for this model. Then, we study multi-waveband spectral variability during the 2000 outburst. In addition to the primary maxima in the optical light curves, secondary maxima were detected after the transition from the very high state to the hard state. We show that the secondary maxima are well modeled by synchrotron emission from a jet formed during the state transition. We argue that the absence of the corresponding secondary peak in the X-ray light curve indicates that the X-ray jet emission, regardless of its radiative process, synchrotron or its Comptonization, is not important in the hard state compared to the emission from the accretion flow.
1 Introduction
Black hole X-ray binaries (BHXBs) appear in five main spectral states, namely quiescent, low/hard, intermediate, high/soft, and very high ones (e.g., McClintock & Remillard 2006, though they prefer a different nomenclature). The origin of the X-ray spectrum of the hard state presents a highly interesting problem. The presence of a universal high-energy spectral cutoff above 100–200 keV in the hard state points out to the X-ray emission coming from thermal Comptonization in a hot accretion corona with an electron temperature of (see, e.g., Zdziarski 2000; Zdziarski & Gierliński 2004 for reviews). We note that an alternative jet model (Markoff, Nowak & Wilms 2005), though also relying on thermal Comptonization as the dominant component at photon energies keV, requires that the electron temperature is several tens higher, –4 MeV. Then, the origin of the 100 keV cutoff is not clear; if it is due to the 1st order scattering by those thermal electrons, very strong fine tuning is required to achieve the observed cutoff energy. On the other hand, higher order scatterings will yield another spectral cutoff at MeV, which presence remains to be observationally tested.
There are two main different models of the hot corona. One relies on electron heating by magnetic reconnection above the standard thin disk (Liang & Price 1977; Galeev, Rosner, & Vaiana 1979). Since the process of magnetic reconnection remains poorly understood, this model has not yet been elaborated in detail, although recent numerical simulations have shed some light on this problem (Hirose, Krolik & Stone 2006). The other model is a hot accretion flow, which is advection dominated (ADAF) in most of its parameter space (Narayan & Yi 1994, 1995; Abramowicz et al. 1995; Rees et al. 1982). We need to illustrate two points here when we use the term ADAF. First, it is found that in most of the parameter space of ADAF, outflow is moderately strong, as emphasized by Blandford & Begelman (1999, the ADIOS solution) and other authors. Second, as we will show later, another hot accretion solution may be responsible for the X-ray emission of the relatively luminous hard states. In comparison with the magnetic reconnection, ADAF has clear dynamics, and its astrophysical applications can be worked out in detail. The specific suggestion of applying the ADAF to the hard state is due to Narayan (1996) and Narayan, McClintock & Yi (1996) (see also Shapiro, Lightman & Eardley 1976, who, however, did not recognize the importance of advection). First detailed calculations applied to data were then done by Esin, McClintock & Narayan (1997, hereafter E97).
In the present paper we concentrate on the hot accretion flow. We note that the radiative efficiency of an ADAF increases with the accretion rate, . Thus an ADAF can explain not only very dim sources like the Galactic center (e.g., Yuan, Quataert & Narayan 2003), but also some relatively luminous sources such as hard states of BHXBs. The highest rate, called the critical accretion rate, of an ADAF is determined by the balance between the viscous heating and cooling, , which occurs at , where is the viscosity parameter, , is the rate of energy change per unit volume, and is the Eddington luminosity. The corresponding maximum luminosity is (E97)111Thus the highest radiative efficiency of an ADAF is , not much lower than that of a standard thin disk around a Schwarzschild black hole, .. The actual value of remains uncertain, but recent three-dimensional magnetohydrodynamic (MHD) numerical simulations suggest – in most of the disk midplane (Hawley & Krolik 2001). Even for as high as 0.3 (a common value used in ADAF studies), the maximum ADAF luminosity is still only –. It has been thought that above the there is no hot accretion solution, with the thin disk remaining the only viable solution.
However, observations of the hard state in BHXBs often show higher luminosities during the rising part of an outburst. For example, the hard state of XTE J1550–564 reached (Sobczak et al. 2000) and (Rodriguez, Corbel & Tomsick 2003; this work) during its outbursts in 1998 and 2000, respectively. The highest hard-state luminosity of GX 339–4 was – (Zdziarski et al. 2004; Done & Gierliński 2003). These observational results have long presented a puzzle for the hot accretion flow models.
Of importance in this context was the finding of a new hot accretion flow solution, the so-called luminous hot accretion flow (LHAF; Yuan 2001, hereafter Y01). Different from an ADAF, this solution corresponds to accretion rates above the critical rate of ADAF, , up to another critical accretion rate which is about 3-5 times higher than for parameters adopted in Y01. In addition to accretion rates, the radiative efficiency of an LHAF is also higher than that of a typical ADAF. Therefore, an LHAF can produce much higher luminosity than an ADAF. Yuan & Zdziarski (2004) studied some luminous hard states of BHXBs and AGNs and found that their relatively low electron temperatures and high luminosities do require an LHAF to be present. In the first part of this work, we apply this approach to hard-state spectra of XTE J1550–564 during its 2000 outburst.
In addition to studying X-ray spectra alone, more and more efforts are devoted to multi-wavelength simultaneous observations and modeling of BHXBs, as illustrated, e.g., by studies of XTE J1118+480. Its nearly simultaneous observations were conducted from radio to X-ray wavelengths (e.g., Hynes et al. 2000; McClintock et al. 2001; Frontera et al. 2001, 2003; Chaty et al. 2003). These have allowed important theoretical conclusions to be drawn. Esin et al. (2001) showed that the EUV data rule out models with a thin disk extending to the last stable orbit. Using a coupled jet-ADAF model, Yuan, Cui & Narayan (2005) and Malzac, Merloni & Fabian (2004) successfully explained the radio to X-ray spectrum and most of the timing properties of the source.
Here, we apply the same approach to XTE J1550–564. We use simultaneous multi-wavelength observations at radio, infrared, optical and X-rays during the 2000 outburst (Corbel et al. 2001; Jain et al. 2001, hereafter J01; Tomsick, Corbel & Kaaret 2001; Rodriguez et al. 2003). Compared to XTE J1118+480, XTE J1550–564 is much more luminous. During the outburst, transitions between the hard and very high states occurred, unlike the case of XTE J1118+480, which was always in the hard state. Therefore some new interesting phenomena were observed. One issue we discuss below is that of secondary maxima in the infrared/optical light curves. J01 reported infrared (), optical (, ) and X-ray light curves for the 2000 outburst. After reaching the peak of the outburst, the IR, optical, and X-ray fluxes declined, and a transition from the very high state to the hard state occurred around MJD 51,680. Afterwards, the X-ray flux continued to decline whereas the IR/optical light curves began to rise and reached secondary maxima at MJD 51,699–51,705, after that they declined again. A contemporaneous spectrum in the radio band was obtained by Corbel et al. (2001) at MJD 51,697. Here, we model the simultaneous radio, IR, optical, and X-ray data and explain the secondary IR/optical maxima.
In §2, we model the X-ray emission of the hard states, paying special attention to the dynamics of the hot accretion flow. In §3, we study the simultaneous radio, IR/optical and X-ray data during the decline phase and explain the secondary IR/optical maxima. We conclude in §4 with a summary and discussion.
2 Modeling the X-ray spectra of the hard states of XTE J1550–564
2.1 Observational data
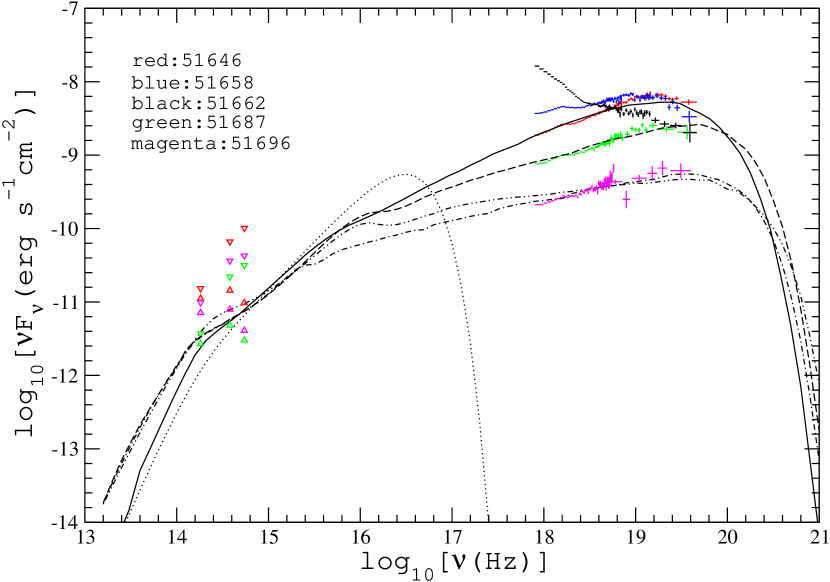
During its 2000 outburst, XTE J1550–564 experienced hard and very high states. We have selected four occurences of the hard states, at MJD 51,646, 51,658, 51,687, and 51,696, based on the criteria that they span a wide range of X-ray luminosity and that each includes simultaneous optical data. Their spectra are shown in Figure 1 by different colors. For comparison, we also show an example of the very high state spectrum, of MJD 51,662. Their X-ray RXTE spectra were earlier studied by Rodriguez et al. (2003) and Tomsick et al. (2001); here we have reextracted them ourselves. They can be well fitted by a power-law form with an exponential cut-off. The X-ray spectra in blue, red, green, and magenta in Figure 1 (from top to bottom) are fitted with the photon index and the e-folding energy, , of and ), respectively. We see a strong anticorrelation between the X-ray flux and , with its value monotonously increasing with the decreasing flux.
The IR/optical data in Figure 1 are from J01. Since we do not know the exact value of the extinction, we show two sets of fluxes for each spectrum, corresponding to the two limits of the extinction of (Orosz et al. 2001) and (Sánchez-Fernández et al. 1999). The details of the data reduction can be found in Xue, Wu, & Cui (2007).
2.2 Accretion flow models
We now fit the spectra using our accretion flow model. The components of it are nearly the same as in E97, i.e., the accretion flow consists of an inner hot accretion flow (ADAF or LHAF) within a transition radius, , and an outer thin disk. We assume that only a fraction of the accretion rate at actually accretes onto the black hole and the rest is ejected. This assumption is required by both numerical simulations (Stone, Pringle, & Begelman 1999; Hawley & Balbus 2002; Igumenshchev et al. 2003) and analytical work (Narayan & Yi 1994; Blandford & Begelman 1999; Narayan et al. 2000; Quataert & Gruzinov 2000). Details of this process depend on the accretion rate. Here, in order to formally take into account the role of outflows as well as convection in modifying the density profile of the accretion flow, we assume following Yuan et al. (2005), that for , and
| (1) |
where
| (2) |
and is independent of but it can be different for different values of . The above formula is based on the consideration that the outflow (and convection) is ultimately due to the accreting gas acquiring a positive Bernoulli parameter, as emphasized by Narayan & Yi (1994), and which value is smaller for higher accretion rates due to the stronger radiative energy loss. Then, is the advection factor of the accretion flow, defined as,
| (3) |
A negative value of in eq. (3) implies that advection plays a heating rather than a cooling role. In this case, the hot accretion flow is in the LHAF regime (Y01), as we will point out in §2.3. When is very low, and . In this case, eq. (1) gives us the usual form, (e.g., Blandford & Begelman 1999).
We calculate global solutions of the hot accretion flow using the method of Y01. A major difference of that method with respect to that of E97 is that we solve the radiation hydrodynamics equations self-consistently, and thus obtain at each radius. In contrast, E97 used the approximation of having a constant average value at all radii. The radiation processes we consider include bremsstrahlung, synchrotron emission, and Comptonization of both synchrotron photons from the hot accretion flow and soft photons from the thin disk. We use formulae in Narayan & Yi (1995) and Coppi & Blandford (1990) to calculate the synchrotron and Comptonization spectra, respectively, as a function of the radius. We treat self-absorption as in Manmoto, Mineshige & Kusunose (1997). The emission from the outer cool disk is modeled as a multicolor blackbody spectrum. The temperature as a function of is determined by the viscous dissipation and the irradiation of the disk by the inner hot flow. E97 show that when , the outer thin disk has little effect to the X-ray emission from the inner hot accretion flow because the seed photons for the Comptonization mainly come from the synchrotron and bremsstrahlung emissions in the hot accretion flow. Here is the Schwarzschild radius.
Now we discuss the values of the model parameters. As we stated in §1, the exact value of is uncertain, and we adopt , which appears the highest possible value. This choice allows us to show the highest values of possible with the ADAF model, and it shows that even then that model cannot explain the luminous hard states of BHXBs. We set the magnetic parameter, defined as the ratio of the gas pressure to the sum of the gas and magnetic pressures, at (from MHD numerical simulations; e.g., Hawley & Krolik 2001), and the fraction of the viscous dissipation directly heating electrons is set at (from the modeling to the supermassive black holein our Galactic center: Yuan et al. 2003). The parameters , and are not free hereafter, though we realize that their values bear large uncertainties. The outer radius of the cold disk is set equal to the tidal radius, which is 0.87 of the Roche lobe radius (Papaloizou & Pringle 1977). The Roche lobe radius is 0.55–0.59 of the separation (Eggleton 1983) for the estimated mass ratio of the black hole to the companion of 6.7–11, while the separation is cm (Orosz et al. 2002). This implies the outer radius cm, equivalent to . We set the black-hole mass to and the distance to kpc (Orosz et al. 2002)222Jonker & Nelemans (2004) argued that the distance to XTE J1550–564 might have been underestimated by as much as a factor of three due to an overestimation of the interstellar extinction. However, if it were true, the highest 1–20 keV luminosity of the 1998 outburst would be , which seems highly unlikely. .
Another important parameter is the transition radius, . As it has been shown by Yuan et al. (2005), its value is best constrained by the thin disk emission close to , which is in the EUV/soft X-ray band. However, we have no data for that band, and hereafter assume . As stated above, most of the seed photons for Comptonization at this value of are synchrotron photons from the hot accretion flow. Our satisfactory fits to the data (the magenta, green and red colors in Figure 1) indicate that our solution is viable though it may be not unique.
On the other hand, it is possible that when the hard state approaches the very high state, the soft photons from the thin disk or clumps in the hot accretion flow become dominant (see also Wardziński & Zdziarski 2000). As it has been shown by Yuan et al. (2007), the X-ray slope of (at least some) black-hole binaries is correlated with the luminosity, , and the sign of the correlation changes when the luminosity of the hard state increases above a certain value. Below this luminosity, the X-ray spectrum hardens with the increasing , and above it, it softens. The boundary in our case approximately corresponds to the red-color spectrum in Figure 1, though in our case with a limited range of the X-ray spectra below it keep an approximately constant slope. The change of the sign of the correlation may be due to the change of the dominant source of the seed photons.
2.3 Modeling results
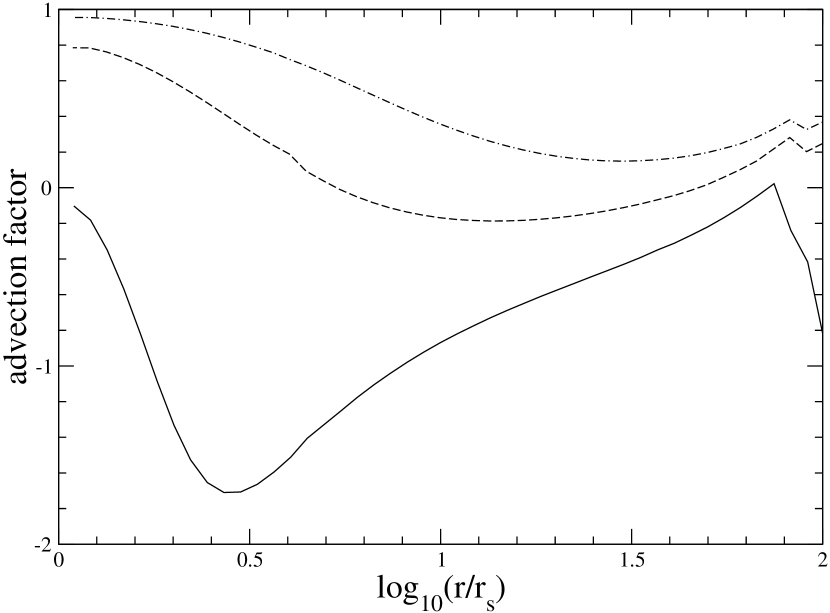
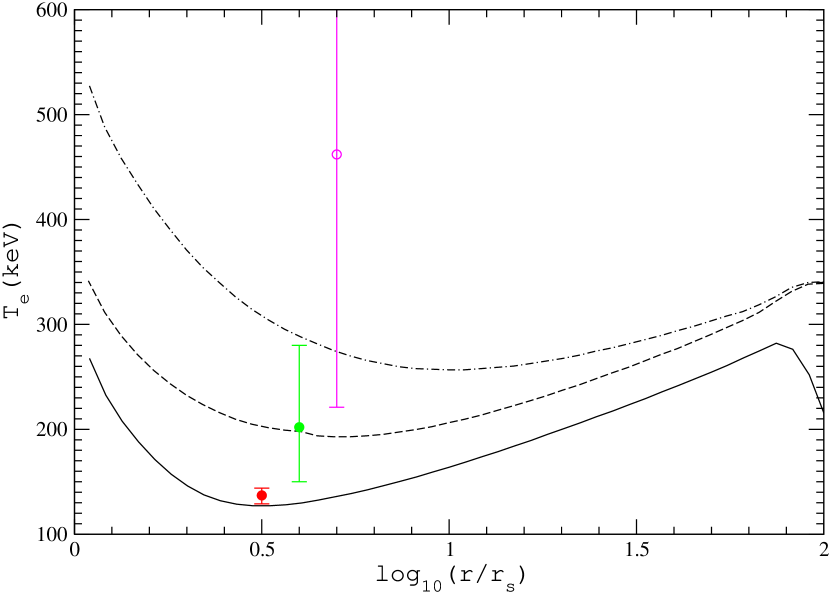
Figure 1 shows our X-ray spectral fits to the lower three hard states. (We will discuss the brightest hard state separately.) From bottom to top, they are shown by the dot-dashed, dashed and solid curves and have equal to , , and , respectively. The advection factor, , and the electron temperature, , of these models are shown as a function of in Figures 2 and 3, respectively.
We see in Figure 1 that the three models fit the X-ray spectra relatively well, including both the spectral slope and the cut-off energy. E97 did not take into account outflows and predicted that the X-ray spectra from hot accretion flows should harden with the increasing accretion rates. The X-ray spectrum at MJD 51,646 (in red) is harder than that at MJD 51,687 (in green), consistent with that prediction. However, the slope of the spectrum at MJD 51,687 is identical to that at MJD 51,696 (magenta), different from the prediction of E97. Our calculations show that the inclusion of the outflow in our model can mostly resolve this discrepancy. From eqs. (1–2) and Figure 2, we see that there is no outflow for the model shown by the (high) solid curve since its advection factor is . For the (middle) dashed line model, is very small: , so outflow is also weak. Since the accretion rate of the solid curve is larger than that of the dashed curve, the former spectrum is harder. On the other hand, for the (low) dot-dashed curve, and , the outflow is strong.
Then, the presence of an outflow will make the emitted spectrum harder compared to that with no outflow at the same . For comparison, we also show in Figure 1 the spectrum produced by a model without outflow (at to reproduce the X-ray flux level), see the double-dot-dashed curve. We clearly see that its spectrum is softer than that of the dot-dashed curve (including the outflow). The physical reason for this is as follows. The emitted X-ray spectrum is the sum of the local Comptonization spectra at each radius, and the slope of that spectrum is determined by the Compton parameter, with a larger corresponding to a harder spectrum (e.g., Beloborodov 1999). At small radii, is relatively small so the corresponding spectrum is soft. When a strong outflow exists, the accretion rate decreases with decreasing radii, thus the contribution of the innermost region (where the dissipation peaks) becomes smaller. Therefore, the total spectrum will become harder. We note that this effect is not universal; it holds only for a certain range of the accretion rate.
We note that the spectra produced by all the three models are somewhat too soft in comparison with the X-ray data. Increasing slightly can make the spectrum harder, thus improving the fits. However, the corresponding luminosities will be higher than observed values. Given the uncertainty in the distance of XTE J1550–564, it is possible that the distance is slightly larger than kpc. Another solution would be to use a larger , which will reduce the magnetic field and thus the synchrotron emission. As the latter provides seed photons for Comptonization, this will lead to hardening of the spectra.
Our models also fit satisfactorily the e-folding energies, . As noted in §2.1, , is anticorrelated with the X-ray luminosity. Such an anticorrelation appears common in the hard states. It takes place, e.g., in GRO J0422+32 (Grove et al. 1998) and GX 339–4 (Wardziński et al. 2002). In thermal Comptonization models, is close to the electron temperature . Such an anticorrelation between and (or ) is expected in the hot accretion flow models, both ADAF and LHAF, as shown here by Figure 3 (see also Fig. 3b of E97). It shows the profiles of the three models shown in Figure 1, together with the values of of the observed X-ray spectra. Note the value of for the lowest considered state is not precisely determined. Since the emitted X-ray spectra are integrated over the radii, the here only measures an average . Still, the shown agreement is excellent, indicating that the hot accretion flow model is able to quantitatively predict the correct . We emphasize that this result is quite robust, independent of the model parameters. It provides strong support for this model of the hard state.
Let us now discuss the dynamics of the accretion flow. We first need to illustrate the physics of the LHAF. The energy equation of ions in hot accretion flows reads: . The subscripts denote the energy advection, the gradient of the internal energy of ions, compression work, viscous heating, and Coulomb collision cooling, respectively. The critical accretion rate of an ADAF is determined by (Narayan, Mahadevan & Quataert 1998). Below , , therefore we have . The positive sign of means that the flow can remain hot if it starts out hot (because , and ). This is why a hot ADAF solution can exist. Above up to another (higher) critical accretion rate determined by , the value of is still positive. Thus a new hot accretion solution, i.e., LHAF, exists between and this new rate (Y01). For an ADAF, , so advection plays a cooling role. While in an LHAF, , so advection plays a heating role. In this case, the radiative cooling is balanced by the sum of advective and viscous heating.
In Figure 2, we see that the advection factor for the (low) dot-dashed curve is , thus it represents an ADAF. The bolometric luminosity of this model is . The advection factor for the (middle) dashed curve is negative in some region, and thus it is marginally an LHAF, with . This result is roughly consistent with those of E97, who found the highest accretion rate of ADAFs as and the corresponding highest is – for . Thus, for spectra such as that of MJD 51,687, whose is , an ADAF marginally does not work. For the spectrum at MJD 51,646, the luminosity is still higher, . In this case, the flow is an LHAF in the entire range, see the solid curve in Figure 2.
However, even an LHAF cannot explain the spectrum at MJD 51,658 (the blue symbols). This is because the required is above the maximum accretion rate of LHAF, , roughly determined by . Because does not depend on , the value of depends only weakly on , unlike . In addition to , other model parameters such as , and the outer boundary conditions also affect its value. Y01 found that and for and , respectively. For the parameters adopted here, is slightly larger than 333As a comparison, the critical rate of the ADAF for the parameters adopted in the present paper is . The ratio is smaller than that obtained in Y01. This is due to the different parameters assumed, and as well due to the inclusion of outflows in the ADAF but not in the LHAF (where they are suppressed)., which corresponds to . This is not high enough to explain the X-ray spectrum at MJD 51,658. When , the innermost region of the LHAF will collapse and form an cold annulus (Y01). Calculations of the emitted spectrum in this case are complicated; here, we hypothesize that this effect may be responsible for the very high state.
Phenomenologically, the X-ray spectrum at MJD 51,658 appears to be intermediate between the hard state spectra, and the very high state spectrum, shown by the black points. The approximate agreement between the observed highest luminosity of the proper hard state and the highest LHAF luminosity strongly supports the LHAF model for the hard state of BHXBs.
Figure 1 shows that the IR/optical fluxes are under-predicted by the hot flow models. This implies that some other components such as a jet and the thin disk also contribute. We consider the role of the jet in §3. Here, we show the emission from an irradiated truncated thin disk with and . We see that this improves the agreement of the model with the data in the optical band, but most of the IR data are still not explained.
3 The role of jet
We note here two interesting results in the IR/optical and X-ray light curves for the 2000 outburst reported by J01. The first one is that the outburst in the IR/optical started some days before that in X-rays (seen by the RXTE/ASM). Here, we focus on another interesting result of J01. After the primary peak of the outburst, the and X-ray fluxed declined, and the transition from the very high state back to the hard state occurred around MJD 51,680. After the transition, the X-ray flux continued to decline while the fluxes began to rise and reached secondary maxima at MJD 51,699–51,705. J01 also found that the secondary maximum is most prominent in the band.
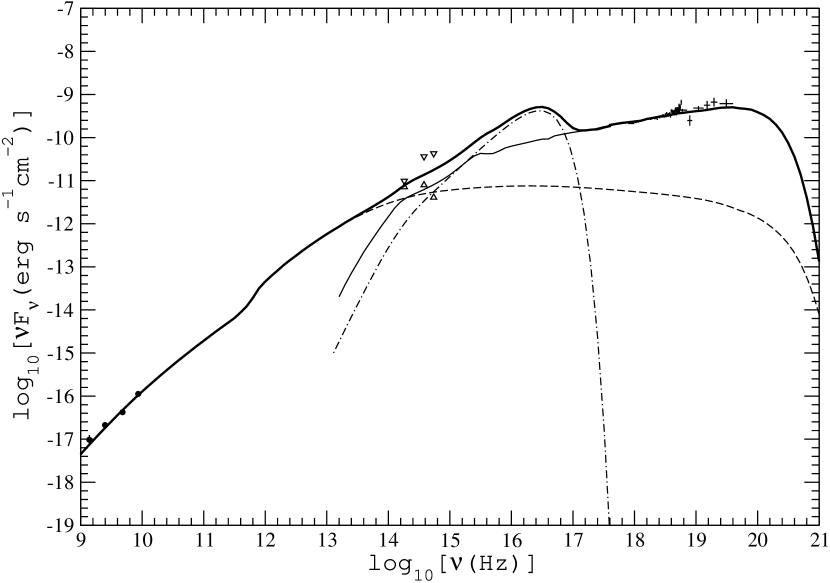
The IR/optical and X-ray spectra at MJD 51,696 are shown in Figure 4. It also shows the contemporaneous radio measurements at MJD 51,697 (Corbel et al. 2001) with the Australia Telescope Compact Array (ATCA) at four frequencies from 1384 to 8640 MHz. The detected spectrum is slightly inverted with the spectral index of (where the energy flux is ). Since the radio regime is much less variable than the X-rays, we assume that the radio spectra at MJD 51,696 and 51,697 were the same.
Based on Figure 4, we can rule out the standard thin disk as the origin of the secondary peaks. The flux produced by the thin disk in the band depends mainly on the values of the outer radius of the thin disk, , and . The dot-dashed curve in Figure 4 shows the emitted spectrum by an irradiated thin disk with and . We can see that the emission from the disk (in the Rayleigh-Jeans regime) is substantially below the observed flux. We note that only for , which appears highly unlikely, the observed and predicted fluxes would become equal.
Jet formation is usually observed when the source enters the hard state (Fender 2001, 2006). Prompted by this, J01 proposed that the secondary peaks are due to the emission from the jet formed at the time of the very high-hard state transition around MJD 51,680. Our detailed calculations support this conjecture. We model the MJD 51,696 spectrum (Figure 4) taking into account the contributions from the hot flow, the truncated disk, and the jet. We use the internal shock scenario (widely adopted in the study of GRB afterglows) to calculate the jet emission, see Yuan et al. (2005) for details. Briefly, internal shocks within the jet occur due to collisions of shells with different velocities. The shocks accelerate a fraction of the electrons into a nonthermal, power-law, energy distribution. The steady-state electron energy distribution is then self-consistently determined taking into account the radiative cooling. We parametrize the model by two parameters, and , giving the fraction of the shock energy going into the accelerated electrons and the (amplified) magnetic field, respectively. We then calculate the nonthermal synchrotron emission.
The modeled jet and total spectra are shown by the dashed and solid curves respectively in Figure 4. We can see that this model fits the data from the radio to the X-rays very well. The jet parameters are: , , its opening angle of , the bulk Lorentz factor, , and the spectral index at which the electrons are accelerated of . The values of the parameters are the same as those used by Yuan et al. (2005) to model the outburst hard state of XTE J1118+480. The mass flow through the jet is . This is of the accretion rate at in the inner flow, equal to at . This is very similar to the corresponding value of in XTE J1118+480.
Based on the above fitting, we now explain the secondary peaks as follows. The jet began to form at the very-high to hard state transition, at MJD 51,680. Initially, was very small, therefore the contribution of the jet emission to the flux was negligible. But then the accretion continued to decrease and the accretion luminosity declined. On the other hand, the jet grew, with increasing, so the relative jet contribution to the bands continued to increase. The increase of lasted for 20 d and reached its maximum at MJD 51,699–51,705, which corresponds to the secondary peaks in the light curves. After that time, decreased together with the . Our fitting results at MJD 51,696, shown in Figure 4, are for the time very close to that of the secondary peaks.
Fig. 1 in J01 shows that the band fluxes at MJD 51,680 and 51,696 differ by one magnitude. We note that the modeled ADAF and the thin disk fluxes could have changed only very little between those two days (see Figure 1). On the other hand, from Figure 4, we see that the band flux increases due to the appearance of the jet emission at MJD 51,696 by about one magnitude, completely consistent with the observational results in J01. We also see in Figure 4 that while the spectrum from the jet is almost flat in the band, the spectrum of the accretion flow (the thin disk and ADAF) rises with the increasing frequency. This explains why the secondary peak is most prominent at the band (J01), i.e., at the lowest energy.
Another important observational result is the absence of the corresponding secondary peak in the X-ray light curve. This requires that whatever emission the jet produces in X-rays, it has to be negligible compared to that from the hot accretion flow. Our theoretical modeling is consistent with that result. As shown in Figure 4, the contribution of the jet emission in the X-ray band is much weaker than that of the accretion flow. We thus conclude that the absence of the secondary maximum in the X-ray light curve provides a strong evidence that the jet emission (synchrotron plus Compton) is not important in the X-ray band in the hard state.
4 Summary and Discussion
We have investigated the hard states of XTE J1550–564 during its 2000 outburst. We have modeled the X-ray spectra with accretion flow models (§2). Our model consists of an inner hot flow within a transition radius and an outer thin disk, as in E97. Different from E97, we have taken into account two new developments of the hot accretion flow models. One is the inclusion of outflow, the other is the extension of the ADAF model to higher accretion rates using the LHAF model (Y01). Our model fits well the lower three of the four characteristic hard-state spectra, see Figure 1. The two extensions of the model are necessary for the obtained good fits. First, the inclusion of the outflow allows us to fit the X-ray spectral slopes. Without outflow, the emitted spectrum hardens with the increasing accretion rate (E97), which disagrees with the observations, where the slopes of the two lowest data sets are almost identical in spite of their different luminosities. To resolve this discrepancy, the outflow becomes weaker with the increasing accretion rate. This is physically motivated as the radiative energy loss is smaller at lower accretion rates and thus the Bernoulli parameter is larger.
The extension of hot accretion flow models from ADAFs to LHAFs enables us to model the luminous hard states with luminosities up to (while the ADAF is limited to ). The LHAF fits the spectral slope and the cut-off energy of those states, as shown in Figure 1, confirming the prediction of Yuan & Zdziarski (2004).
The value of the highest possible luminosity of the LHAF model, , depends on and other model parameters, and the outer boundary condition (see Y01). For our assumed parameters, we find , somewhat lower than of the most luminous hard state considered here shown by the blue symbols in Figure 1. However, we can see that this state appears intermediate between the hard and the very high states, and perhaps some prcesses responsible for the very high state are already for importance here. Thus, the overall agreement between the maximum observed and the prediction of the LHAF model provides strong support for it as a model of the X-ray emission of the hard states of BHXBs.
The highest of the hard state varies among various sources as well as different outbursts of a given source. As discussed in §1, the maximum hard-state of XTE J1550–564 and GX 339–4 varies in the 10–30% range. On the other hand, the corresponding value in Cyg X-1 is only – (e.g., Zdziarski et al. 2002). We discuss now possible reasons for this variability.
First, is a function of the model parameters, e.g., , and parameter variations among different sources will contribute to its dispersion. However, numerical simulations of accretion flow indicate that (e.g., Hawley & Krolik 2001). Thus, this effect can explain a low value of the maximum , but not values . Still, we can obtain by adjusting the outer boundary condition (determined by the physics of the transition region between the hot and cool accretion flows, which is complex and currently unclear).
An efficient way of increasing the maximum hard-state can be due to the angular momentum of the black hole being . In the present calculations, we have assumed a Schwarzschild black hole. If the black hole is rapidly rotating, substantially more gravitational energy will be released because of the deeper potential well (e.g., Gammie & Popham 1998; Popham & Gammie 1998). Shafee et al. (2006) indeed have found that a number of BHXBs appear to have the spin parameter of 0.6–0.8.
Yet another effect that could increase is a magnetic coupling between the rotating black hole and the accretion flow. If the black hole rotates faster than the disk, energy and angular momentum will be extracted from the black hole and transferred to the disk by the magnetic field (Li 2000, 2002; Wang et al. 2003). However, we are not able to estimate quantitatively the importance of this effect here because the existing studies have only considered the standard thin disk rather than a hot flow444Recently attention has been paid to the effect of the presence of magnetic stresses near and inside the last stable circular orbit on the radiative efficiency of the standard thin disk (e.g., Agol & Krolik 2000; Beckwith, Hawley & Krolik 2006). This effect does not apply to the hot accretion flow since the no-torque boundary condition is not adopted in the global solution of hot accretion flow..
As we point out above, the most luminous hard states border the very high state. The nature of the latter remains an open question. Numerical calculations by Y01 (see also Begelman, Sikora & Rees 1987) indicate that above the hot accretion flow will collapse within a certain radius and form a cold annulus (see Liu, Meyer & Meyer-Hofmeister 2006 for a similar result in the context of their evaporation model). The inner cold annulus will emit black body radiation which may explain the thermal component of the very high state. At the collapse region, strong magnetic reconnection events should occur due to the overflow of the magnetic field (Begelman et al. 1987; Y01). This is likely to accelerate some electrons into a power-law distribution. Compton scattering of the soft photons from the inner annulus by both the thermal and power-law electrons may then be responsible for the X-ray emission of the very high state. We note that Gierliński & Done (2003) have found that the shape of the soft -ray spectrum of XTE J1550–564 in the very high state indeed requires the presence of both thermal and nonthermal (power-law like) electrons.
A possible problem with the above scenario is that the hot accretion flow is strongly thermally unstable at the collapse region (Yuan 2003). As a result of the instability, the accretion flow may form a two-phase flow structure, with cold clumps surrounded by the hot phase (Yuan 2003; Guilbert & Rees 1988; Celotti, Fabian & Rees 1992; Kuncic, Celloti & Rees 1997; Krolik 1998; Beloborodov 1999; Merloni et al. 2006). The radiation from the cold clumps can then explain the thermal component of the very high state, whereas Comptonization of the soft photons by the high-energy electrons in the hot phase may be responsible for the power law tail. Thus, this represents an alternative scenario for the very high state. (However, a hybrid electron distribution in the hot phase is required as stated above, see Gierliński & Done 2003.) We speculate that even some luminous hard-state flows with may also contain such a two-phase configuration. The formation of the cold clumps in this case could be due to the strong instability in the transition region between the hot accretion flow and the standard thin disk (Kato 1999, 2000). This scenario is promising in explaining the observed power spectra of the rapid aperiodic variability of X-ray emission of BHXBs (Böttcher & Liang 1999). It also may explain the claimed relativistic iron K emission line profiles in BHXBs (e.g., Miller et al. 2006). We plan to investigate these issues in future work.
We have also investigated the nature of the secondary peaks in the light curves of XTE J1550–564 (J01). They began to emerge after the transition from the very high state back to the hard state, and reached the maximum 20 d later. However, there have been no corresponding peak in the X-ray light curve. Based on a detailed modeling to the multi-waveband spectrum from the radio to X-rays, we conclude that the secondary peaks are due to the emission from the jet formed during the state transition. The mass loss rate in the jet kept increasing for 20 d after its birth, and then decreased. The secondary peaks were then due to the corresponding maximum of the relative contribution of the jet () emission with respect to the accretion emission. The absence of the corresponding peak in the X-rays strongly indicates that the jet emission (either synchrotron or Compton) is negligible in the X-ray band in the hard state. This differs from the scenarios with the dominance of the jet in X-rays (e.g., Markoff et al. 2005). In principle, it is possible that a drop in the X-ray flux from the disk is exactly compensated by a rise in the X-ray flux from the jet, with the total flux changing smoothly. As this scenario requires fine tuning, we consider it to be highly unlikely.
We also point out that Xue et al. (2007) present another argument against the jet dominance in X-rays in the hard state. By modeling the spectrum of the jet blob, they obtain the parameters of the electron energy distribution. Assuming the electron energy distribution is the same for all blobs in the jet, they model the overall radio spectrum of the source and extrapolate their fit to higher energies. They find that the synchrotron emission from the jet contribute negligibly to the observed X-ray emission.
References
- (1) Abramowicz, M. A., Chen, X., Kato, S., Lasota, J.-P., & Regev, O. 1995, ApJ, 438, L37
- (2) Agol, E., & Krolik, J. H. 2000, ApJ, 528, 161
- (3) Beckwith, K., Hawley, J. F., & Krolik, J. H. 2006, ApJ, submitted (astro-ph/0605295)
- (4) Begelman, M. C., Sikora, M., & Rees, M. J. 1987, ApJ, 313, 689
- (5) Beloborodov, A. M. 1999, in J. Poutanen, & R. Svensson, eds., ASP Conf. Ser. Vol. 161, High Energy Processes in Accreting Black Holes. ASP, San Francisco, 295
- (6) Blandford, R. D., & Begelman, M. C. 1999, MNRAS, 303, L1
- (7) Böttcher, M., & Liang, E. P. 1999, ApJ, 511, L37
- (8) Celotti A., Fabian A. C., & Rees, M. J. 1992, MNRAS, 255, 419
- (9) Chaty, S., Haswell, C. A., Malzac, J., Hynes, R. I., Shrader, C. R., & Cui, W. 2003, MNRAS, 346, 689
- (10) Coppi, P. S., & Blandford, R. D. 1990, MNRAS, 245, 453
- (11) Corbel, S., et al. 2001, ApJ, 554, 43
- (12) Done, C. & Gierliński, M. 2003, MNRAS, 342, 1041
- (13) Eggleton, P. P. 1983, ApJ, 268, 368
- (14) Esin, A. A., McClintock, J. E., & Narayan, R. 1997, ApJ, 489, 865 (E97)
- (15) Esin, A. A., McClintock, J. E., Drake, J. J., Garcia, M. R., Haswell, C. A., Hynes, R. I., & Muno, M. P. 2001, ApJ, 555, 483
- (16) Fender, R. P. 2001, MNRAS, 322, 31
- (17) Fender, R. P. 2006, in Compact Stellar X-Ray Sources, ed. W. H. G. Lewin & M. van der Klis, (Cambridge: Cambridge Univ. Press), 381
- (18) Frontera, F., et al. 2001, ApJ, 561, 1006
- (19) Frontera, F., et al. 2003, ApJ, 592, 1110
- (20) Galeev, A. A., Rosner, R., & Vaiana, G. S. 1979, ApJ, 229, 318
- (21) Gammie, C. F., & Popham, R. 1998, ApJ, 498, 313
- Gierliński & Done (2003) Gierliński, M., & Done, C. 2003, MNRAS, 342, 1083
- (23) Grove, J. E., et al. 1998, ApJ, 500, 899
- (24) Guilbert P. W., & Rees M. J., 1988, MNRAS, 233, 475
- (25) Hawley, J. F., & Krolik J. H. 2001, ApJ, 548, 348
- (26) Hawley, J. F., & Balbus, S. A. 2002, ApJ, 573, 738
- (27) Hameury, J.-M., Lasota, J.-P., McClintock, J. E., & Narayan, R. 1997, ApJ, 489, 234
- (28) Hirose, S., Krolik J. H., & Stone, J. M. 2006, ApJ, 640, 901
- (29) Hynes, R., Mauche, C., Haswell, C., Shrader, C., Cui, W., & Chaty, S. 2000, ApJ, 539, L37
- (30) Igumenshchev, I. V., Narayan, R., & Abramowicz, M. A. 2003, ApJ, 592, 1042
- (31) Jain, R. K., Bailyn, C. D., Orosz, J. A., McClintock, J. E., & Remillard, R. A. 2001, ApJ, 554, L181 (J01)
- (32) Jonker, P. G., & Nelemans, G. 2004, MNRAS, 354, 355
- (33) Kato, S. 1999, PASJ, 51, 71
- (34) Kato, S. 2000, PASJ, 52, 1125
- (35) Krolik, J. H., 1998, ApJ, 498, L13
- (36) Kuncic, Z., Celotti, A., & Rees, M. J. 1997, MNRAS, 284, 717
- (37) Li, L. X. 2000, ApJ, 533, L115
- (38) Li, L. X. 2002, ApJ, 567, 463
- (39) Liang, E.P.T., Price, R.H. 1977, ApJ, 218, 247
- (40) Liu, B. F., Meyer, F., & Meyer-Hofmeister, E. 2006, A&A, 454, L9
- (41) Malzac, J., Merloni, A., & Fabian, A. 2004, MNRAS, 351, 253
- (42) Manmoto, T., Mineshige, S., & Kusunose, M. 1997, ApJ, 489, 791
- (43) Markoff, S., Nowak, M. A., & Wilms, J. 2005, ApJ, 635, 1203
- (44) McClintock, J. E., et al., 2001, ApJ, 555, 477
- (45) McClintock, J. E., & Remillard, R. A. 2006, in Compact Stellar X-Ray Sources, ed. W. H. G. Lewin & M. van der Klis, (Cambridge: Cambridge Univ. Press), 157
- (46) Merloni, A., Malzac, J., Fabian, A.C., & Ross, R.R. 2006, 370, 1699
- (47) Miller, J. M., Homan, J., Steeghs, D., Rupen, M., Hunstead, R. W., Wijnands, R., Charles, P. A., & Fabian, A. C. 2006, ApJ, 653, 525
- (48) Narayan, R. 1996, ApJ, 462, 136
- (49) Narayan, R., Igumenshchev, I. V., & Abramowicz, M. A. 2000, ApJ, 539, 798
- (50) Narayan, R., Mahadevan, R., & Quataert, E. 1998, in The Theory of Black Hole Accretion Discs, ed. M. A. Abramowicz, G. Bjornsson & J.E. Pringle (Cambridge University Press), 148
- (51) Narayan, R., McClintock, J. E. & Yi, I. 1996, ApJ, 457, 821
- (52) Narayan, R. & Yi, I. 1994, ApJ, 428, L13
- (53) Narayan, R. & Yi, I. 1995, ApJ, 452, 710
- (54) Orosz, J. A., et al. 2002, ApJ, 568, 845
- (55) Papaloizou, J., & Pringle, J. E. 1977, MNRAS, 181, 441
- (56) Popham, R. & Gammie, C. F. 1998, ApJ, 504, 419
- (57) Quataert, E., & Gruzinov, A. 2000, ApJ, 539, 809
- (58) Rees, M. J., Phinney, E. S., Begelman, M. C., & Blandford, R. D. 1982, Nature, 295, 17
- (59) Rodriguez, J., Corbel, S., & Tomsick, J. A. 2003, ApJ, 595, 1032
- (60) Sánchez-Fernández, C., et al. 1999, A&A, 348, L9
- Shafee et al. (2006) Shafee, R., McClintock, J. E., Narayan, R., Davis, S. W., Li, L.-X., & Remillard, R. A. 2006, ApJ, 636, L113
- (62) Shapiro, S. L., Lightman, A. P., & Eardley, D. M. 1976, ApJ, 204, 187
- (63) Sobczak, G. J., et al. 2000, ApJ, 544, 993
- (64) Stone, J., Pringle, J., & Begelman, M. 1999, MNRAS, 310, 1002
- (65) Tomsick, J. A., Corbel, S., & Kaaret, P. 2001, ApJ, 563, 229
- (66) Wang, D. X., et al. 2003, ApJ, 595, 109
- (67) Wardziński, G., & Zdziarski, A. A. 2000, MNRAS, 314, 183
- (68) Wardziński, G., Zdziarski, A. A., Gierliński, M., Grove, J. E., Jahoda, K., & Johnson, W. N. 2002, MNRAS, 337, 829
- (69) Xue, Y. Q., Wu, X. B., & Cui, W. 2007, A&A, submitted (astro-ph/0606194)
- (70) Yuan, F. 2001, MNRAS, 324, 119 (Y01)
- (71) Yuan, F. 2003, ApJ, 594, L99
- (72) Yuan, F., Cui, W., & Narayan, R. 2005, ApJ, 620, 905
- (73) Yuan, F., Quataert, E., & Narayan, R. 2003, ApJ, 598, 301
- (74) Yuan, F., & Zdziarski, A. 2004, MNRAS, 354, 953
- (75) Yuan, F., Taam, R. E., Misra, R., Wu, X.-B., & Xue, Y.Q. 2007, ApJ, in press (astro-ph/0611939)
- (76) Zdziarski, A. A. 2000, IAU Symp. 195, 153
- (77) Zdziarski, A. A., & Gierliński, M. 2004, Progr. Theor. Phys., 155, 99
- (78) Zdziarski, A. A., Poutanen, J., Paciesas, W. S., & Wen, L. 2002, ApJ, 578, 357
- (79) Zdziarski, A. A., Gierliński, M., Mikołajewska, J., Wardziński, G., Smith, D.M., Harmon, B. A., & Kitamoto, S. 2004, MNRAS, 351, 791