The Spatial Distribution of Brown Dwarfs in Taurus
Abstract
By combining photometry from the 2MASS Point Source Catalog and the USNO-B1.0 Catalog with optical and infrared spectroscopy, I have performed a search for young brown dwarfs in an area of 225 deg2 encompassing all of the Taurus star-forming region ( Myr). From this work, I have discovered 22 new members of Taurus, five of which were independently found by Guieu and coworkers. Sixteen of these new members have spectral types later than M6 and thus are likely to be brown dwarfs according to the theoretical evolutionary models of Chabrier and Baraffe. After adding these new members to the previously known members of Taurus, I have compared the spatial distributions of stars and brown dwarfs across the entire region. I find no statistically significant difference between these two distributions. Taurus does not contain the large, extended population of brown dwarfs that has been predicted by some embryo ejection models for the formation of brown dwarfs. However, these results are consistent with other ejection models, as well as models in which stars and brown dwarfs share a common formation mechanism.
Subject headings:
infrared: stars — stars: evolution — stars: formation — stars: low-mass, brown dwarfs — stars: luminosity function, mass function — stars: pre-main sequence1. Introduction
Measuring the spatial distribution of a population of newly-formed stars can offer insight into the star formation process. Because of its youth and low stellar density, the stellar content within the Taurus-Auriga molecular cloud probably has undergone the least dynamical evolution of any nearby star-forming region, and therefore is the best available site for measuring a primordial spatial distribution of young stars. Several studies over the last decade have taken advantage of this fact to address various aspects of star formation. For instance, measurements of the distribution of stars in Taurus have revealed effects of both binary formation and the Jeans condition on clustering properties (Gomez et al., 1993; Larson, 1995; Simon, 1997; Nakajima et al., 1998; Bate et al., 1998) while a comparison of the distributions of stars and molecular material in Taurus has constrained the velocity dispersion with which the stars are born and the nature of cloud fragmentation (Hartmann, 2002).
Measuring the spatial distribution of Taurus members as a function of mass is another potentially rewarding experiment. Several studies have suggested that brown dwarfs might form as protostellar sources whose accretion is prematurely halted by ejection from multiple systems (Reipurth & Clarke, 2001; Boss, 2001; Bate et al., 2002; Delgado-Donate, Clarke, & Bate, 2003; Umbreit et al., 2005). Some of these ejection models have predicted that newborn brown dwarfs could have higher velocity dispersions than their stellar counterparts (Reipurth & Clarke, 2001; Kroupa & Bouvier, 2003). If so, brown dwarfs would be more widely distributed than stars in star-forming regions. For instance, Kroupa & Bouvier (2003) favored an ejection model with a one-dimensional velocity dispersion of km s-1, which corresponds to an angular distance of for an object traveling for 1 Myr at the distance of Taurus. Meanwhile, other models of ejection predict that stars and brown dwarfs should have similar spatial and velocity distributions (Bate et al., 2003).
Over time, surveys for substellar members of Taurus have encompassed larger areas surrounding the stellar aggregates. Some of these data have exhibited no statistically significant differences in the spatial distributions of the high- and low-mass members of Taurus (Briceño et al., 2002; Luhman, 2004b) while other data have suggested a possible difference (Guieu et al., 2006). To search for an extended population of brown dwarfs beyond the previous survey fields and to measure the distribution of brown dwarfs in Taurus on the largest size scales, I have performed a survey for brown dwarfs across an area of 225 deg2 containing the entire Taurus star-forming region. In this paper, I describe the selection of candidate substellar members of Taurus (§ 2) and the spectroscopy and classification of these candidates (§ 3), evaluate the completeness of this survey and the recent one by Guieu et al. (2006) (§ 4), and use the resulting updated census of Taurus to perform a definitive comparison of the distributions of stars and brown dwarfs in this region (§ 5).
2. Selection of Brown Dwarf Candidates
Previous surveys for low-mass stars and brown dwarfs in the Taurus star-forming region have identified candidates through color-magnitude and color-color diagrams constructed from optical and near-infrared (IR) photometry (Luhman, 2000, 2004b; Martín et al., 2001; Briceño et al., 1998, 2002; Luhman et al., 2003a; Guieu et al., 2006, hereafter G06). Those optical data were obtained through dedicated imaging with wide-field cameras of areas ranging from to 28 deg2. IR measurements for these optical fields were then taken from the Two-Micron All-Sky Survey (2MASS, Skrutskie et al., 2006). 2MASS is also the source of IR photometry for the survey in this work. However, as a substitute for optical CCD photometry, I use the photometric measurements designated as the second epoch near-IR magnitude (or photographic ) in the USNO-B1.0 Catalog (Monet et al., 2003), which is referred to as in this work. By employing only all-sky catalogs, one can survey a field of any area and position. Therefore, I consider a field that is large enough to encompass all of the Taurus star-forming region, which I choose to center at , (J2000) with dimensions of . The boundaries of this survey area correspond approximately to the boundaries of the maps in Figs. 1 and 2.
To develop criteria for identifying candidate substellar members of Taurus with data from the USNO and 2MASS catalogs, I used the 14 known members with spectral types later than M6111The hydrogen burning mass limit at ages of 0.5-3 Myr corresponds to a spectral type of M6.25 according to the models of Baraffe et al. (1998) and Chabrier et al. (2000) and the temperature scale of Luhman et al. (2003b). from Luhman et al. (2003a) and prior studies that are resolved by 2MASS (excludes GG Tau Bb). Nine of these late-type members have measurements in , while the remaining five sources are below the detection limit. All of the known late-type members of Taurus have measurements in the 2MASS catalog. The sources detected at are shown in a diagram of versus in Figure 3. The ranges of colors and magnitudes that encompass these objects can be defined as , , and . I have performed a similar exercise with versus in Figure 4, where the 14 members later than M6 exhibit colors of , , and . In addition, the objects with have , and 12 of the 14 late-type members have photometric uncertainties less than 0.05 mag in all three bands of the 2MASS data.
To search for new late-type members of Taurus that are in the same range of masses and extinctions as the previously known ones, I applied all of the above criteria to the 2MASS Point Source Catalog and the USNO-B1.0 Catalog for the 225 deg2 field encompassing Taurus. For objects not detected in , only the criteria using the 2MASS photometry were applied. This process produced 112 candidates. I rejected 21 candidates that appeared to be field stars based on color-magnitude diagrams from Luhman (2000), Briceño et al. (2002), and Luhman (2004b), six candidates identified and presented in the concurrent survey by Luhman (2004b), and two candidates for which was unavailable because of close proximity to a brighter star rather than a faint flux in that band. The remaining 83 candidates comprised the final sample. Luhman (2004b) presented spectroscopy of 15 candidates, 7 of which were confirmed as members of Taurus222Luhman (2004b) incorrectly stated that 17 candidates were selected with the methods described in this work, when in fact the number was 15; the two other candidates, 2MASS 04185791+2830520 and 04305971+1804237, were selected from photometry in Luhman (2000).. Spectroscopy for the other 68 candidates is described in the next section. In § 3, I classify 22 candidates as Taurus members and 46 candidates as field stars.
I also examined the photometry from the surveys by Luhman (2000) and Briceño et al. (2002) for candidate low-mass members of Taurus that have not been observed spectroscopically. In Figure 5, the data from Luhman (2000) are shown in extinction-corrected diagrams of versus and versus , which were constructed in the manner described by Luhman (2004a). I include with the data the boundary for separating potential members of Taurus from probable field stars that was developed by Luhman (2004b). Several objects appear above the boundaries of both diagrams, and thus are candidate members. Few undiscovered members are expected to reside among the brighter candidates () since the survey of Briceño et al. (1998) already searched those magnitude levels for the fields in question. However, seven faint sources () are above the boundaries of both diagrams, and thus are candidate substellar members. I obtained spectra of these seven candidates, as well as two similar candidates from the data of Briceño et al. (2002). These nine candidates are classified as field stars in § 3.
In addition to the candidate members of Taurus identified in this section, I selected for spectroscopy three known members that lack accurate spectral classifications (IRAS 04370+2559, IRAS 04166+2706, CIDA 7), three members that were classified as low-mass class I objects by White & Hillenbrand (2004) (IRAS 04158+2805, IRAS 04248+2612, IRAS 04489+3042), and nine new members from G06 (CFHT 5, 7, 11, 15-18, 20, 21).
3. Spectroscopy of Candidates
3.1. Observations
I performed spectroscopy on the 77 candidate Taurus members and the 15 known members that were selected in the previous section. Optical and near-IR spectra were obtained for 65 and 18 of the candidates and 14 and 4 of the known members, respectively. Table 1 summarizes the observing runs and instrument configurations for these data. In Tables 2 and The Spatial Distribution of Brown Dwarfs in Taurus, I indicate the night on which each object was observed. The procedures for the collection and reduction of the optical spectra with the MMT and Hobby-Eberly Telescope (HET) were similar to those described by Luhman (2004b). The IR spectra obtained with SpeX (Rayner et al., 2003) at the Infrared Telescope Facility (IRTF) were reduced with the Spextool package (Cushing, Vacca, & Rayner, 2004) and corrected for telluric absorption with the method from Vacca et al. (2003).
3.2. Spectral Classification
To measure spectral types and assess membership in Taurus for the objects in my spectroscopic sample, I applied the optical and IR classification methods from my previous studies of Taurus and other star-forming regions (Luhman, 1999, 2004a; Luhman et al., 2005). The spectral types are based predominantly on the absorption bands of VO and TiO ( µm) and H2O ( µm). When classifying objects that appear to be young, averages of spectra of dwarfs and giants are used as the spectroscopic standards at optical wavelengths (Luhman, 1999). For the IR spectra, optically-classified young objects are used as the standards, which ensures that the IR and optical types are on the same classification system. If dwarfs were instead used as the standards for classifying the IR spectra of Taurus members, the resulting spectral types would be systematically later than those derived from the optical spectra because the H2O absorption bands are stronger in pre-main-sequence sources than in field dwarfs at a given optical spectral type (Luhman & Rieke, 1999; Lucas et al., 2001; McGovern et al., 2004). To determine whether an object is a member of Taurus or a field star, I employ the diagnostics described in my previous work (e.g., Luhman et al., 2003b, 2005; Luhman, 2004a), such as emission lines, IR excess emission, gravity-sensitive spectral features, and reddening. Only a few of the spectra have sufficiently high resolution and signal-to-noise for a reliable measurement of Li absorption, which is another indicator of youth.
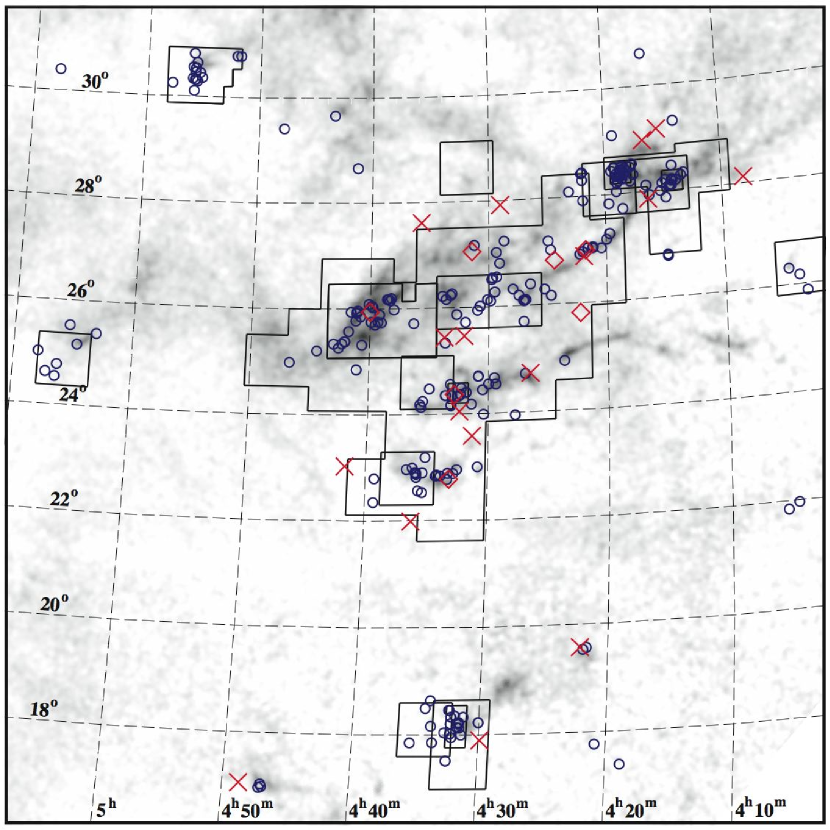
Based on the optical and IR spectra, I classify 55 candidates as field stars and 22 candidates as members of Taurus. Five of the 22 new members (CFHT 9, 10, 12-14) were independently discovered in the recent survey by G06. The identifications and photometry from 2MASS and the available spectral types for these field stars and new members are provided in Tables 2 and The Spatial Distribution of Brown Dwarfs in Taurus, respectively. Table The Spatial Distribution of Brown Dwarfs in Taurus also includes the 15 previously known members that were observed spectroscopically, as well as the evidence of membership for each object. The spectra of the known and new members are presented in order of spectral type in Figs. 6-9. To facilitate the comparison of these spectra, they have been corrected for reddening (Luhman, 2004a; Luhman et al., 2005). The positions of the new members are indicated in a map of Taurus in Figure 1. Interestingly, one of the new brown dwarfs, 2MASS 04221332+1934392, is only from T Tau, which has only one other known young star within .
The studies cited above have provided many illustrations of the variations of the gravity-sensitive spectral features between dwarfs, giants, and pre-main-sequence objects that appear in the kind of optical and IR spectra obtained in this work. I present an additional illustration for the IR spectra by including in Figure 9 the spectra of the candidates classified as late-type field dwarfs. In the field dwarfs, the -band continua exhibit broad plateaus, whereas the Taurus members are characterized by sharply peaked, triangular continua. This behavior has been observed in young late-type objects in other star-forming regions (Lucas et al., 2001; Luhman et al., 2004) and has been attributed to the dependence of H2 collision induced absorption on surface gravity (Kirkpatrick et al., 2006). A similar effect is found in the -band, although it is more subtle than at . Another feature that varies noticeably in these IR spectra is the FeH absorption at 0.99 µm (McGovern et al., 2004; Kirkpatrick et al., 2006), which is strong in the dwarfs and very weak or undetected in the young objects.
3.3. Comments on Individual Sources
In terms of the gravity-sensitive features, most of the candidates are well-matched to either known Taurus members or standard field dwarfs. The exceptions are 2MASS 04172478+1634364, 04324813+2431063, and 04203904+2355502. The IR spectrum of one of these objects, 2MASS 04172478+1634364, is compared to data for a Taurus member and a field dwarf in Figure 10. Both the FeH absorption and the shape of the -band continuum are intermediate between those of the comparison objects, which indicates an intermediate surface gravity. The other two objects exhibit the same behavior, except that the FeH absorption of 2MASS 04203904+2355502 is dwarf-like. The gravity-sensitive lines at optical wavelengths are consistent with surface gravities lower than those exhibited by field dwarfs for these three sources. For instance, in addition to the spectra of known members, Figure 8 includes the optical spectra of 2MASS 04172478+1634364 and 04324813+2431063, whose Na I and K I strengths are indistinguishable from those of the Taurus members. Similarly, the third object, 2MASS 04203904+2355502, exhibits much weaker Na I than a standard field L dwarf (Kirkpatrick et al., 1997), as shown in Figure 11. These optical and IR data are consistent with ages older than Taurus ( Myr) and younger than typical field dwarfs ( Gyr). These three sources may represent low-mass members of the population of young field stars ( Myr) that Briceño et al. (1997) used to explain the wide-field distribution of X-ray sources in the direction of Taurus. In this case, 2MASS 04203904+2355502 could be a young field L dwarf like the one recently discovered by Kirkpatrick et al. (2006). Because of the uncertainty in their ages, it is unclear whether to use dwarfs, Taurus members, or stars at some other age as standards when measuring their spectral types. For 2MASS 04172478+1634364 and 04324813+2431063, the use of dwarfs as standards produces late-M spectral types from the optical spectra and early L types from the IR data. Meanwhile, similar spectral types are derived from the two wavelength ranges when Taurus members are used as the standards. Therefore, I adopt the latter types for the purposes of this work. For 2MASS 04203904+2355502, both the optical and IR spectra are consistent with the same type of L1 when compared to dwarf standards, which is adopted here.
In addition to candidate members of Taurus, several previously known members were included in my spectroscopic sample. I briefly comment on the spectra of three of these known members, IRAS 04158+2805, IRAS 04248+2612, and IRAS 04489+3042, which were classified as possible class I brown dwarfs by White & Hillenbrand (2004). The optical spectra of these objects have strong emission in H, Ca II, and other permitted and forbidden lines. For all three sources, both the optical (0.6-0.9 µm) and near-IR (0.75-2.5 µm) spectra exhibit increasing excess emission with decreasing wavelength at µm when compared to the classification standards. Long wavelength excess emission at 2 µm is also apparent in the data for IRAS 04158+2805. In Figure 12, the blue and red excesses for this star are revealed by a comparison to another Taurus member at the same spectral type, V410 Anon 13. To avoid veiling by excess emission, the spectral types for these stars are primarily based on features at µm and -2 µm in the optical and near-IR spectra, respectively. For each of the three objects, the optical and near-IR spectra produce similar spectral types. However, the optical spectra imply much lower extinctions (-15) than the IR spectra, which is probably caused by the blue excess emission. The spectral types measured here for IRAS 04158+2805, IRAS 04248+2612, and IRAS 04489+3042 are earlier than the ones reported by White & Hillenbrand (2004), but the two sets of classifications are consistent within the uncertainties. The combination of my spectral types, the temperature scale of Luhman et al. (2003b), and the evolutionary models of Baraffe et al. (1998) and Chabrier et al. (2000) suggest that these three class I sources are low-mass stars rather than brown dwarfs.
4. Survey Completeness
All of the fields in Taurus that have been previously searched for new low-mass members are encompassed by the 225 deg2 area considered in this work. Thus, the completeness of the various surveys can be investigated in a straightforward manner by comparing the lists of late-type objects discovered in each survey. In this section, I focus on the completeness of my survey and the recent 28 deg2 survey by G06.
I first examine the completeness of my USNO/2MASS survey for the population that was targeted, namely Taurus members with spectral types of M6. In this discussion, I include the initial sample of members found in this survey that was reported in Luhman (2004b). As mentioned in § 2, two of the 14 previously known late-type members of Taurus from Luhman et al. (2003a) and prior studies, KPNO 9 (8.5) and KPNO 12 (M9), have 2MASS photometric uncertainties that are greater than the thresholds I adopted for selecting candidates. Three of the six new members at M6 that were found in the CCD survey by Luhman (2004b) did not satisfy the criteria for the USNO/2MASS survey because ITG2 (M7.25) is slightly too bright at , 2MASS 04552333+3027366 (M6.25) is too blue in , and 2MASS 04574903+3015195 (M9.25) has photometric uncertainties that are too large. Among the 6 new members from G06 that I classify as M6, three objects were not found in my survey because two of them are slightly too faint (CFHT 15, 16) and one is too red in (CFHT 5), and thus is outside of the extinction range considered here. These results suggest that my survey has a completeness of % for Taurus members at M6, M9, and . The completeness would have been % if I had selected a slightly brighter limit at and slightly larger thresholds for the 2MASS photometric uncertainties (e.g., 0.06 mag instead of 0.05 mag).
Before discussing the completeness of the wide-field survey by Martín et al. (2001) and G06, I summarize its results and place it in the context of other surveys of Taurus. Martín et al. (2001) obtained spectra of candidate low-mass members appearing in an initial set of images covering 3.6 deg2, resulting in the discovery of four new members (CFHT 1-4). G06 then presented the results of their full survey of several fields encompassing a total area of 28 deg2. After applying their selection criteria for identifying candidate low-mass members, they recovered 17 previously known members of Taurus. G06 performed spectroscopy on eight of these known members and treated two of them as new discoveries (CFHT 6 and 8), which had been found earlier by Luhman (2004b). Through spectroscopy of a large sample of candidates, G06 discovered an additional 15 new members. Five of those new objects have been independently found in this work (CFHT 9, 10, 12-14). Among the other 10 new members, six objects were not found in my survey because they have spectral types of M6 according to my classifications, and thus are outside of the range of spectral types for which my search criteria were designed. The one new member from G06 that was not included in my spectroscopic sample, CFHT 19, also has a type earlier than M6 according to G06. The other three new CFHT sources that were not found in my survey were discussed earlier in this section. Using their spectroscopy, G06 classified 12 of their 17 new members as M6, and thus likely to be substellar. In comparison, the spectral types measured in this work for those sources are earlier than the classifications from G06 by an average of 0.5 subclass. As a result, I find that only 6/17 of the CFHT sources from G06 are later than M6.
I now evaluate the completeness of the survey by G06. They identified 47 objects with photometry indicative of Taurus members with spectral types of M4. These sources included the four members presented by Martín et al. (2001) and 17 previously known members. G06 obtained spectra of 20 of the 26 remaining candidates, which included all of the candidates at M6. As a result, they reported a completeness of 41/47, or 87%, for Taurus members at M4 and a completeness of 100% for candidates at M6, both for , , and ages of Myr. However, these percentages do not fully characterize completeness because they did not account for the completeness of the candidate list itself, or the percentage of members that were identified as candidates, which G06 did not estimate. As a simple test of their completeness, I have investigated whether any known members of Taurus with spectral types of M4 are within their survey fields but not recovered by their selection criteria. From published membership lists for Taurus (Herbig & Bell, 1988; Strom & Strom, 1994; Kenyon & Hartmann, 1995; Briceño et al., 1998, 1999, 2002; Martín, 2000; Martín et al., 2001; Luhman & Rieke, 1998; Luhman et al., 2003a; Luhman, 2004b), I have identified 38 such sources: MHO 4-9, V927 Tau, RXJ04467+2459, CIDA 1, 2 and 7, J1-507, J1-665, J1-4423, IRAS 04248+2612 and 04158+2805, LkCa 1, V410 X-ray 1, 3, 4, 5a, and 6, FQ Tau, 2MASS 04161210+2756385, 04213459+2701388, 04403979+2519061, 04141188+2811535, and 04414825+2534304, KPNO 8, 13 and 14, UX Tau C, Haro 6-32, FN Tau, GG Tau Ba, FW Tau, GM Tau, and ITG 2. Seven sources of this kind are also present among the new members discovered in this work: 2MASS 04263055+2443558, 04334291+2526470, 04320329+2528078, 04322329+2403013, 04311907+2335047, 04215450+2652315, 04295422+1754041. Among these 45 members, 34 and 11 have spectral types of M4-M6 and M6, respectively. In comparison, the total sample of members recovered by Martín et al. (2001) and G06 (both previously known and new ones) consisted of 17 and 19 objects in those spectral type ranges. Thus, the completeness of G06 was at best 17/51 (33%) and 19/30 (63%) at M4-M6 and M6. The true completeness at M4-M6 is probably lower because neither G06 nor any other survey has demonstrated that the known census of members in this range of spectral types is complete for the area considered by G06. On the other hand, their completeness at M6 may not be much lower than the upper limit computed here given that my survey was designed to find members of this kind, and has a reasonably high level of completeness for M6-M9 and , as shown earlier in this section.
The reason for the high level of incompleteness in the survey by G06 is explored in Figure 13, which compares versus for the 36 recovered members and the 45 missed members. All but one of the missed members span a range of colors that is similar to, or even smaller on average than, the recovered members, indicating that the former objects were not missed because of higher extinction. Instead, the missed members are systematically brighter than the recovered members, and thus may have been saturated in the images of G06 and consequently overlooked.
5. Spatial Distribution of Brown Dwarfs
My 225 deg2 survey of Taurus was designed to identify members in the same ranges of spectral types (M6-M9) and extinctions () as exhibited by the previously known late-type members that were found in surveys of smaller fields. As shown in the previous section, the completeness of this survey is not 100% for those ranges of types and extinctions, but it appears to be high enough that the combination of the new members that I have found and the previously known members should comprise an accurate representation of the substellar population of Taurus that is unbiased with position. In this section, I examine the spatial distribution of that population.
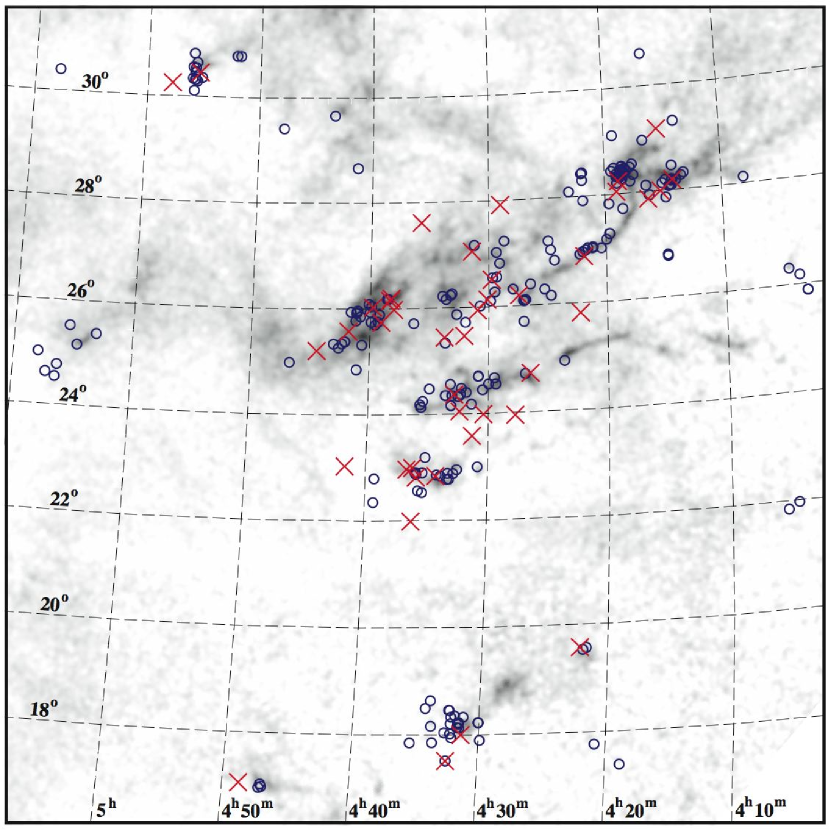
A map of the positions of all known members of Taurus is shown in Figure 2, where the objects with spectral types of M6 ( ) and M6 ( ) are plotted with different symbols. A large, extended population of brown dwarfs between the stellar aggregates does not exist. Instead, the spatial distribution of brown dwarfs in Taurus closely resembles that of the stellar members, which is consistent with previous surveys of smaller areas (Briceño et al., 2002; Luhman, 2004b, G06).
To search for subtle differences in the distributions of stars and brown dwarfs in Taurus in their surveyed fields, G06 computed the number ratio of brown dwarfs to stars for areas of varying radii from the stellar aggregates, which is quantified as (Briceño et al., 2002). They found that this ratio increased with radii. For instance, G06 measured for their full survey area, whereas Luhman (2004b) reported a value of 0.18 for smaller fields surrounding some of the aggregates. G06 presented these results as evidence for differences in the spatial distributions of stars and brown dwarfs in Taurus. However, as discussed in § 4, the spectral types reported by G06 for the CFHT sources are systematically later than the ones that I measured for those objects. If my spectral types are adopted instead, which are based on the classification system used for most of the previously known late-type members (Briceño et al., 2002; Luhman et al., 2003a; Luhman, 2004b), then six CFHT objects become stars rather than brown dwarfs (M6, CFHT 7-12) and the ratio computed by G06 becomes 0.17, which is consistent with the value for the smaller fields. In other words, the apparent increase in with radius reported by G06 was simply a reflection of differences in the spectral classification systems used for their (outer) CFHT sources and the (inner) previously known members. However, even if the measurement of by G06 is revised to use my spectral types for the CFHT sources, it still may not accurately represent the Taurus population because, as shown in the previous section, their survey was significantly incomplete for members at M4, which applies to both the numerator and denominator in and thus precludes a meaningful ratio.
Although the combination of previous surveys and the one in this work provide a census of brown dwarfs that has fairly high completeness for M6-M9 and across all of Taurus, I do not attempt to measure for the entire star-forming region because no study has quantified the completeness of the known census of low-mass stars (M2-M6) for this area. This issue was raised by Luhman (2004b), who pointed out that the faint limits of the wide-field X-ray and H surveys (M4) do not clearly overlap with the bright limits of deep CCD surveys, which range from M4 to M6 (Briceño et al., 1998, 2002; Luhman, 2000, 2004b, G06). For instance, one of the objects found in my survey, 2MASS 04161885+2752155 (M6.25), is within one of the fields observed by Briceño et al. (2002), but was not found in that study because it was saturated. Paradoxically, the membership of Taurus now is probably more complete for brown dwarfs than for low-mass stars because the latter have been too faint for X-ray surveys, frequently saturated in CCD surveys, and not easily distinguished from background field stars in USNO and 2MASS data.
As demonstrated above, a comparison of a ratio like with position (or with any other parameter) is sensitive to incompleteness and differences in spectral classification systems. To avoid the latter effect, one can examine the spatial distributions of stars and brown dwarfs in terms of the angular distances to the nearest stellar neighbors instead of . Changing classification systems is equivalent to changing the boundary between the two samples in , which in turn will change quickly because the numerator and denominator are anti-correlated. In contrast, a sensitivity of this kind is not present in the distribution of neighbor distances because changing the boundary simply removes a few objects from one average and adds them to the other average. To mitigate the effect of incompleteness on the distribution of nearest neighbor distances, I exclude the range of spectral types that has an uncertain level of completeness, namely M2-M6. I have computed the distribution of nearest neighbor distances for the entire Taurus star-forming region by using the census of Taurus that combines the previously known members with the new ones found in this work. I consider only members with measured spectral types, which has the effect of excluding most of the Class 0 and I sources. To measure the spatial distributions of unrelated members of Taurus, the clustering of members of multiple systems should be avoided in this experiment. Therefore, neighboring members with separations less than are treated as one object (Larson, 1995). The resulting samples at M2 and M6 contain 101 and 40 sources, respectively. As shown in Figure 14, these two samples exhibit similar distributions of distances to the nearest stellar neighbor at M2. A two-sided Kolmogorov-Smirnov test of the two distributions indicates a probability of % that they are drawn from the same parent distribution, and thus I find no statistically significant difference between the spatial distributions of stars and brown dwarfs in Taurus. I arrive at the same result if a different boundary for the hydrogen burning mass limit is adopted, such as M5 or M7, or if I ignore the potential incompleteness at M2-M6 and include these members in the stellar sample (Figure 14). For their survey area, G06 also found no significant difference between the distributions of nearest neighbor distances for members at M6 and M6.
6. Conclusions
To measure the spatial distribution of substellar members of Taurus, I have performed a search for brown dwarfs across the entire star-forming region. The results of this work can be summarized as follows:
-
1.
Through analysis of photometry from the 2MASS and USNO-B1.0 catalogs for an area of 225 deg2 encompassing Taurus, I have identified 83 potential substellar members of the region. Spectroscopy was performed on 15 of these candidates by Luhman (2004b), who classified seven of them as new members. Among the 68 remaining candidates observed in this work, I have identified 22 new members, five of which were independently discovered by G06. Sixteen of these 22 objects have spectral types later than M6 and thus are likely to be brown dwarfs according to the theoretical evolutionary models of Baraffe et al. (1998) and Chabrier et al. (2000) and the temperature scale of Luhman et al. (2003b).
-
2.
Among the candidates classified as non-members, three objects have late spectral types (M8-L1) and spectral features that are suggestive of surface gravities between those of Taurus members and typical field dwarfs. I speculate that these objects could be young members of the field ( Myr).
-
3.
Using the low-mass Taurus members found in previous surveys, I estimate that my survey has a completeness of % for members with spectral types of M6 to M9 and extinctions of . The same type of analysis demonstrates that the completeness of the recent survey by G06 is % for this range of types.
-
4.
G06 concluded that the abundance of brown dwarfs relative to stars varies with distance from the stellar aggregates in Taurus. I find that this apparent variation is a reflection of differences in the spectral classification systems used for low-mass members inside and outside of the aggregates. No variation is evident when spectral types for all objects are adopted from the same system. Furthermore, a reliable measurement of the relative numbers of stars and brown dwarfs as a function of position in Taurus is currently not possible because the available census of Taurus members has an unknown level of completeness for low-mass stars (M2-M6, 0.1-0.6 ) for most of the region.
-
5.
After updating the census of Taurus members with the new objects discovered in this work, I find that the spatial distribution of brown dwarfs closely follows that of the stars. An extended population of brown dwarfs outside of the stellar aggregates is not present. These results are consistent with a common formation mechanism for stars and brown dwarfs (e.g., Padoan & Nordlund, 2004) and with some models for embryo ejection (Bate et al., 2003), but not others (Kroupa & Bouvier, 2003).
References
- Baraffe et al. (1998) Baraffe, I., Chabrier, G., Allard, F., & Hauschildt, P. H. 1998, A&A, 337, 403
- Bate et al. (1998) Bate, M. R., Clarke, C. J., & McCaughrean, M. J. 1998, MNRAS, 297, 1163
- Bate et al. (2002) Bate, M. R., Bonnell, I. A., & Bromm, V. 2002, MNRAS, 332, L65
- Bate et al. (2003) Bate, M. R., Bonnell, I. A., & Bromm, V. 2003, MNRAS, 339, 577
- Boss (2001) Boss, A. 2001, ApJ, 551, L167
- Briceño et al. (1997) Briceño, C., Hartmann, L., Stauffer, J., Gagne, M. Stern, R. A., & Caillault, J.-P. 1997, AJ, 113, 740
- Briceño et al. (1998) Briceño, C., Hartmann, L., Stauffer, J., & Martín, E. L., 1998, AJ, 115, 2074
- Briceño et al. (1999) Briceño, C., Calvet, N., Kenyon, S., & Hartmann, L. 1999, AJ, 118, 1354
- Briceño et al. (2002) Briceño, C., Luhman, K. L., Hartmann, L., Stauffer, J. R., & Kirkpatrick, J. D. 2002, ApJ, 580, 317
- Chabrier et al. (2000) Chabrier, G., Baraffe, I. Allard, F., & Hauschildt, P. H. 2000, ApJ, 542, 464
- Cushing, Vacca, & Rayner (2004) Cushing, M. C., Vacca, W. D., & Rayner, J. T. 2004, PASP, 116, 362
- Delgado-Donate, Clarke, & Bate (2003) Delgado-Donate, E. J., Clarke, C. J., & Bate, M. R. 2003, MNRAS, 342, 926
- Dobashi et al. (2005) Dobashi, K., Uehara, H., Kandori, R., Sakurai, T., Kaiden, M., Umemoto, T., & Sato, F. 2005, PASJ, 57, 1
- Gomez et al. (1993) Gomez, M., Hartmann, L., Kenyon, S. J., & Hewett, R. 1993, AJ, 105, 1927
- Guieu et al. (2006) Guieu, S., Dougados, C., Monin, J.-L., Magnier, E. & Martín, E. L. 2006, A&A, 446, 485 (G06)
- Hartmann (2002) Hartmann, L. 2002, ApJ, 578, 914
- Herbig & Bell (1988) Herbig, G. H., & Bell, K. R. 1988, Lick Obs. Bull. Ser., No. 1111
- Kenyon & Hartmann (1995) Kenyon, S. J., & Hartmann, L. 1995, ApJS, 101, 117
- Kenyon et al. (1998) Kenyon, S. J., Brown, D. I., Tout, C. A., & Berlind, P. 1998, AJ, 115, 2491
- Kirkpatrick et al. (1997) Kirkpatrick, J. D., Henry, T. J., & Irwin, M. J. 1997, AJ, 113, 1421
- Kirkpatrick et al. (1999) Kirkpatrick, J. D., et al. 1999, ApJ, 519, 802
- Kirkpatrick et al. (2006) Kirkpatrick, J. D., et al. 2006, ApJ, in press
- Kroupa & Bouvier (2003) Kroupa, P., & Bouvier, J. 2003, MNRAS, 346, 369
- Larson (1995) Larson, R. B. 1995, MNRAS, 272, 213
- Lucas et al. (2001) Lucas, P. W., Roche, P. F., Allard, F., & Hauschildt, P. H. 2001, MNRAS, 326, 695
- Luhman (1999) Luhman, K. L. 1999, ApJ, 525, 466
- Luhman (2000) Luhman, K. L. 2000, ApJ, 544, 1044
- Luhman (2004a) Luhman, K. L. 2004a, ApJ, 602, 816
- Luhman (2004b) Luhman, K. L. 2004b, ApJ, 617, 1216
- Luhman & Rieke (1998) Luhman, K. L., & Rieke, G. H. 1998, ApJ, 497, 354
- Luhman & Rieke (1999) Luhman, K. L., & Rieke, G. H. 1999, ApJ, 525, 440
- Luhman et al. (2003a) Luhman, K. L., Briceño, C., Stauffer, J. R., Hartmann, L., Barrado y Navascués, D., & Nelson, C. 2003a, ApJ, 590, 348
- Luhman et al. (2003b) Luhman, K. L., Stauffer, J. R., Muench, A. A., Rieke, G. H., Lada, E. A., Bouvier, J., & Lada, C. J. 2003b, ApJ, 593, 1093
- Luhman et al. (2004) Luhman, K. L., Peterson, D. E., & Megeath, S. T. 2004, ApJ, 617, 565
- Luhman et al. (2005) Luhman, K. L., Lada, E. A., Muench, A. A., & Elston, R. J. 2005, ApJ, 618, 810
- Luhman, McLeod, & Goldenson (2005) Luhman, K. L., McLeod, K. K., & Goldenson, N. 2005, ApJ, 623, 1141
- Martín (2000) Martín, E. L. 2000, AJ, 120, 2114
- Martín et al. (2001) Martín, E. L., Dougados, C., Magnier, E., Ménard, F., Magazzù, A., Cuilandre, J.-C., & Delfosse, X. 2001, ApJ, 561, L195
- McGovern et al. (2004) McGovern, M. R., Kirkpatrick, J. D., McLean, I. S., Burgasser, A. J., Prato, L., & Lowrance, P. J. 2004, ApJ, 600, 1020
- Monet et al. (2003) Monet, D. G., et al. 2003, AJ, 125, 984
- Nakajima et al. (1998) Nakajima, Y., Tachihara, K., Hanawa, T., & Nakano, M. 1998, ApJ, 497, 721
- Padoan & Nordlund (2004) Padoan, P., & Nordlund, Å. 2004, ApJ, 617, 559
- Rayner et al. (2003) Rayner, J. T., et al. 2003, PASP, 115, 362
- Reipurth & Clarke (2001) Reipurth, B. & Clarke, C. 2001, AJ, 122, 432
- Simon (1997) Simon, M. 1997, ApJ, 482, L81
- Skrutskie et al. (2006) Skrutskie, M. F., et al. 2006, AJ, 131, 1163
- Strom & Strom (1994) Strom, K. M., & Strom, S. E. 1994, ApJ, 424, 237
- Umbreit et al. (2005) Umbreit, S., Burkert, A., Henning, T., Mikkola, S., & Spurzem, R. 2005, ApJ, 623, 940
- Vacca et al. (2003) Vacca, W. D., Cushing, M. C., & Rayner J. T., 2003, PASP, 115, 389
- White & Hillenbrand (2004) White, R. J., & Hillenbrand, L. A. 2004, ApJ, 616, 998
| Night | Date | Telescope + Instrument | Disperser | (m) | |
|---|---|---|---|---|---|
| 1 | 2004 Nov 12 | IRTF + SpeX | prism | 0.8-2.5 | 100 |
| 2 | 2004 Nov 13 | IRTF + SpeX | prism | 0.8-2.5 | 100 |
| 3 | 2004 Dec 10 | MMT + Blue Channel | 600 grating | 0.63-0.89 | 2900 |
| 4 | 2004 Dec 11 | MMT + Blue Channel | 600 grating | 0.63-0.89 | 2900 |
| 5 | 2004 Dec 12 | MMT + Blue Channel | 600 grating | 0.63-0.89 | 2900 |
| 6 | 2005 Sep 25 | HET + LRS | G3 grism | 0.63-0.91 | 1100 |
| 7 | 2005 Sep 27 | HET + LRS | G3 grism | 0.63-0.91 | 1100 |
| 8 | 2005 Oct 21 | HET + LRS | G3 grism | 0.63-0.91 | 1100 |
| 9 | 2005 Dec 12 | IRTF + SpeX | prism | 0.8-2.5 | 100 |
| 10 | 2005 Dec 13 | IRTF + SpeX | prism | 0.8-2.5 | 100 |
| 2MASSaa2MASS Point Source Catalog. | Spectral Type | aa2MASS Point Source Catalog. | aa2MASS Point Source Catalog. | aa2MASS Point Source Catalog. | Night |
|---|---|---|---|---|---|
| J04095207+2821399 | M4V | 0.79 | 0.53 | 13.86 | 4 |
| J04111034+2830379 | M0 | 1.00 | 0.63 | 13.50 | 4 |
| J04114008+2834024 | G0 | 0.72 | 0.35 | 11.99 | 4 |
| J04122245+2827470 | K0 | 0.97 | 0.52 | 13.18 | 4 |
| J04125785+2556088 | M8V | 0.73 | 0.46 | 13.73 | 5 |
| J04143306+3033411 | M8-M9V(op,IR) | 0.68 | 0.47 | 13.80 | 5,10 |
| J04151433+2840321 | M1V | 0.86 | 0.46 | 13.61 | 5 |
| J04153235+2908447 | M4V | 1.01 | 0.54 | 13.67 | 4 |
| J04172402+2837197 | M3.5V | 1.01 | 0.65 | 13.34 | 5 |
| J04172478+1634364 | M8.5(op,IR)bbSpectral features suggest a surface gravity intermediate between those of Taurus members and field dwarfs (Figs. 10 and 11). | 0.73 | 0.53 | 12.90 | 2,3 |
| J04173180+2849444 | M4.75V | 0.88 | 0.46 | 13.69 | 5 |
| J04175041+2814403ccSelected from photometry in Luhman (2000) (Figure 5). | M0 | 1.48 | 0.86 | 14.47 | 2 |
| J04184416+2831533ccSelected from photometry in Luhman (2000) (Figure 5). | M0 | 1.15 | 0.61 | 15.40 | 2 |
| J04202573+2513013 | M3.25V | 0.91 | 0.47 | 12.57 | 5 |
| J04203904+2355502 | L1(op,IR)bbSpectral features suggest a surface gravity intermediate between those of Taurus members and field dwarfs (Figs. 10 and 11). | 0.85 | 0.59 | 13.50 | 5,10 |
| J04214004+2853048 | M3V | 1.19 | 0.70 | 12.55 | 4 |
| J04220170+2653225 | K0 | 0.97 | 0.52 | 13.31 | 5 |
| J04230586+2345204 | M0 | 1.11 | 0.66 | 13.31 | 5 |
| J04251784+2641211 | M3.5V | 0.89 | 0.59 | 13.80 | 5 |
| J04260704+2430070 | K0 | 0.99 | 0.53 | 13.33 | 5 |
| J04271561+1850364 | K0 | 0.84 | 0.42 | 12.35 | 5 |
| J04272913+1854245 | K0 | 0.96 | 0.52 | 12.93 | 5 |
| J04273708+2056389 | M5.75V | 0.63 | 0.38 | 12.07 | 5 |
| J04284746+1837356 | M2.5V | 0.99 | 0.59 | 13.52 | 5 |
| J04304017+2409526 | M0 | 0.89 | 0.50 | 13.35 | 4 |
| J04310604+2409588 | M0 | 0.97 | 0.51 | 12.98 | 4 |
| J04314195+2431268ccSelected from photometry in Luhman (2000) (Figure 5). | M0 | 1.68 | 0.91 | 13.45 | 10 |
| J04320000+2406343 | M2.25V | 0.96 | 0.51 | 13.81 | 4 |
| J04320865+2418583ccSelected from photometry in Luhman (2000) (Figure 5). | M0 | 1.00 | 0.81 | 15.15 | 2 |
| J04322947+2426174ccSelected from photometry in Luhman (2000) (Figure 5). | M0 | 1.21 | 0.57 | 15.04 | 10 |
| J04324813+2431063ccSelected from photometry in Luhman (2000) (Figure 5). | M8.25(op),M8(IR)bbSpectral features suggest a surface gravity intermediate between those of Taurus members and field dwarfs (Figs. 10 and 11). | 0.60 | 0.66 | 14.74 | 2,4 |
| J04330831+2413195ccSelected from photometry in Luhman (2000) (Figure 5). | L1-L3V | 0.71 | 0.63 | 15.40 | 2 |
| J04331906+2343035 | M3.75V | 0.70 | 0.47 | 13.32 | 4 |
| J04332359+2650191 | M0 | 0.93 | 0.50 | 12.85 | 3 |
| J04333296+2506587 | M3.25V | 0.98 | 0.62 | 13.61 | 4 |
| J04335918+2552238ddSelected from photometry in Briceño et al. (2002). | M4V | 0.73 | 0.74 | 14.94 | 2 |
| J04341763+2251297 | M0 | 0.94 | 0.50 | 13.43 | 3 |
| J04344356+1638484 | M2.5V | 0.71 | 0.48 | 13.59 | 3 |
| J04344701+1652593 | M4.5V | 0.64 | 0.52 | 13.91 | 4 |
| J04351796+2408105 | K0 | 0.88 | 0.45 | 11.66 | 4 |
| J04352837+2410004ddSelected from photometry in Briceño et al. (2002). | M0 | 0.90 | 0.74 | 15.23 | 2 |
| J04404725+2501121 | M4V | 1.08 | 0.63 | 13.35 | 5 |
| J04440270+2515065 | M3.25V | 0.83 | 0.49 | 13.58 | 5 |
| J04470883+2921026 | M7.5V | 0.67 | 0.46 | 13.60 | 5 |
| J04474757+2819165 | L2-L3V | 1.05 | 0.77 | 13.29 | 2 |
| J04480068+1710115 | K0 | 0.79 | 0.38 | 11.90 | 4 |
| J04481381+2559399 | M1V | 0.85 | 0.47 | 13.52 | 4 |
| J04482244+2051433 | M6V | 0.62 | 0.41 | 12.28 | 4 |
| J04483627+2541137 | K0 | 0.74 | 0.36 | 12.59 | 4 |
| J04490477+2535229 | M5V | 0.89 | 0.53 | 13.11 | 5 |
| J04490506+1703513 | M4V | 0.68 | 0.35 | 12.40 | 5 |
| J04503796+2624466 | M3.5V | 0.71 | 0.48 | 13.76 | 5 |
| J04523836+2708423 | M3.25V | 0.82 | 0.46 | 13.83 | 5 |
| J04554336+2812523 | M8V | 0.60 | 0.48 | 13.71 | 5 |
| J04555897+2140007 | M8-9V | 0.67 | 0.51 | 12.93 | 2 |
| Membership | ||||||||
|---|---|---|---|---|---|---|---|---|
| 2MASSaa2MASS Point Source Catalog. | Other Names | Spectral TypebbUncertainties are and subclass for the optical and IR types from this work, respectively, unless noted otherwise. | Ref | EvidenceccMembership in Taurus is indicated by and a position above the main sequence for the distance of Taurus (“”), strong emission lines (“e”), Na I and K I strengths intermediate between those of dwarfs and giants (“NaK”), strong Li absorption (“Li”), IR excess emission (“ex”), or the shape of the gravity-sensitive steam bands (“H2O”). | aa2MASS Point Source Catalog. | aa2MASS Point Source Catalog. | aa2MASS Point Source Catalog. | Night |
| Previously Known Members | ||||||||
| J04185813+2812234 | IRAS 04158+2805 | M3,K7-M3,M6, | 1,2,3, | e,ex,,NaK,H2O | 1.43 | 1.17 | 11.18 | 1,3 |
| M5.25(op),M6(IR) | 4 | |||||||
| J04194148+2716070 | IRAS 04166+2706 | M0 | 4 | e,ex | 1.30 | 0.79 | 12.62 | 5 |
| J04221675+2654570 | CFHT 21 | M1.25,M1-M2 | 5,4 | e,,NaK | 1.54 | 1.03 | 9.01 | 6 |
| J04274538+2357243 | CFHT 15 | M8.25 | 5,4 | NaK | 0.70 | 0.55 | 13.69 | 6 |
| J04275730+2619183 | IRAS 04248+2612 | M2,M5.5, | 1,3, | e,ex,NaK, | 1.44 | 0.77 | 11.03 | 1,3 |
| M4.5(op),M4.75(IR) | 4 | |||||||
| J04292165+2701259 | IRAS 04263+2654,CFHT 18 | M6,M5.25 | 5,4 | ,NaK | 1.30 | 0.77 | 8.72 | 6 |
| J04295950+2433078 | CFHT 20 | M5.5,M5 | 5,4 | e,,NaK | 1.15 | 0.73 | 9.81 | 8 |
| J04302365+2359129 | CFHT 16 | M8.5,M8.25 | 5,4 | NaK | 0.72 | 0.55 | 13.70 | 6 |
| J04321786+2422149 | CFHT 7 | M6.5,M5.75 | 5,4 | NaK | 0.75 | 0.41 | 10.38 | 8 |
| J04325026+2422115 | CFHT 5 | M7.5 | 5,4 | ,NaK,H2O | 1.74 | 0.94 | 11.28 | 9 |
| J04350850+2311398 | CFHT 11 | M6.75,M6 | 5,4 | NaK | 0.59 | 0.35 | 11.59 | 7 |
| J04400174+2556292 | CFHT 17 | M5.75,M5.5 | 5,4 | ,NaK | 1.58 | 0.88 | 10.76 | 3 |
| J04400800+2605253 | IRAS 04370+2559 | M0 | 4 | e,ex | 2.16 | 1.38 | 8.87 | 3 |
| J04422101+2520343 | CIDA 7 | M2-M3?,M4.75 | 6,4 | e,NaK, | 0.82 | 0.41 | 10.17 | 3 |
| J04520668+3047175 | IRAS 04489+3042 | M2,M4-M8, | 1,3, | e,ex, | 2.40 | 1.64 | 10.38 | 1,3 |
| M3.5-M4.5(op),M3-M4(IR) | 4 | |||||||
| New Members | ||||||||
| J04080782+2807280 | M3.75 | 4 | Li, | 0.71 | 0.35 | 11.39 | 4 | |
| J04152409+2910434 | M7 | 4 | ,NaK | 0.80 | 0.53 | 12.36 | 5 | |
| J04161885+2752155 | M6.25 | 4 | ,NaK | 0.77 | 0.43 | 11.35 | 5 | |
| J04163911+2858491 | M5.5 | 4 | ,NaK | 0.88 | 0.56 | 11.28 | 5 | |
| J04214631+2659296 | CFHT 10 | M6.25,M5.75 | 5,4 | ,NaK | 1.09 | 0.60 | 12.13 | 4 |
| J04215450+2652315 | M8.5(op),M8.75(IR) | 4 | NaK?,H2O | 1.04 | 0.60 | 13.90 | 4,10 | |
| J04221332+1934392 | M8 | 4 | NaK | 0.81 | 0.53 | 11.53 | 4 | |
| J04221644+2549118 | CFHT 14 | M7.75 | 5,4 | NaK | 0.70 | 0.43 | 11.94 | 5 |
| J04242646+2649503 | CFHT 9 | M6.25,M5.75 | 5,4 | Li,NaK | 0.69 | 0.43 | 11.76 | 5 |
| J04263055+2443558 | M8.75(op,IR) | 4 | e,NaK,H2O | 0.72 | 0.54 | 13.40 | 2,3 | |
| J04290068+2755033 | M8.25 | 4 | e,NaK,H2O | 0.69 | 0.47 | 12.85 | 5 | |
| J04295422+1754041 | M4 | 4 | Li,NaK | 0.94 | 0.69 | 11.02 | 5 | |
| J04311907+2335047ddAlso discovered by Slesnick, Carpenter, & Hillenbrand (in preparation). | M7.75 | 4 | NaK | 0.79 | 0.52 | 12.20 | 4 | |
| J04312669+2703188 | CFHT 13 | M7.25,M7.5 | 5,4 | NaK | 0.86 | 0.52 | 13.45 | 4 |
| J04320329+2528078 | M6.25 | 4 | Li,NaK | 0.61 | 0.39 | 10.72 | 4 | |
| J04322329+2403013 | M7.75 | 4 | e,NaK | 0.64 | 0.36 | 11.33 | 4 | |
| J04330945+2246487 | CFHT 12 | M6.5,M6 | 5,4 | e,,NaK | 1.01 | 0.60 | 11.54 | 3 |
| J04334291+2526470 | M8.75(op,IR) | 4 | NaK,H2O | 0.79 | 0.52 | 13.33 | 4,10 | |
| J04354526+2737130 | M9.25 | 4 | NaK | 0.77 | 0.53 | 13.71 | 5 | |
| J04361030+2159364 | M8.5 | 4 | NaK | 0.75 | 0.46 | 13.64 | 5 | |
| J04414489+2301513 | M8.5(op),M8(IR) | 4 | e,NaK,H2O | 0.69 | 0.56 | 13.16 | 2,3 | |
| J04484189+1703374 | M7 | 4 | NaK | 0.60 | 0.44 | 12.49 | 4 | |