The structural and photometric properties of early-type galaxies in hierarchical models
Abstract
We present predictions for the structural and photometric properties of early-type galaxies in the cold dark matter cosmology (CDM) from the published semi-analytical galaxy formation models of Baugh et al. and Bower et al. These calculations were made with the GALFORM code, which tracks the evolution of the disc and bulge components of a galaxy, using a self-consistent model to compute the scalelengths. The sizes of galactic discs are determined by the conservation of the angular momentum of cooling gas. The sizes of merger remnants are computed by applying the virial theorem and conserving the binding energy of the progenitors and their orbital energy. There are a number of important differences between the two galaxy formation models. To suppress the overproduction of bright galaxies, the Bower et al. model employs AGN heating to stifle gas cooling, whereas the Baugh et al. model invokes a superwind which ejects cooled gas. Also, in the Baugh et al. model a top-heavy stellar initial mass function is adopted in starbursts. We compare the model predictions with observational results derived from the SDSS. The model enjoys a number of notable successes, such as giving reasonable reproductions of the local Faber-Jackson relation (velocity dispersion-luminosity), the velocity dispersion-age relation, and the fundamental plane relating the luminosity, velocity dispersion and effective radius of spheroids. These achievements are all the more remarkable when one bears in mind that none of the parameters have been adjusted to refine the model predictions. We study how the residuals around the fundamental plane relation depend on galaxy properties. We examine in detail the physical ingredients of the calculation of galaxy sizes in GALFORM, showing which components have the most influence over our results. We also study the evolution of the scaling relations with redshift. However, in spite of the successes, there are some important disagreements between the predictions of the model and observations: the brightest model spheroids have effective radii smaller than observed and the zero-point of the fundamental plane shows little or no evolution with redshift in the model.
1 Introduction
Remarkably tight correlations exist between the structural and photometric properties of galaxies. Across the Hubble sequence there is a strong dependence of luminosity on either the rotation speed of galactic discs (Tully & Fisher, 1977) or the velocity dispersion of spheroids (Faber & Jackson, 1976). Other scaling relations observed for early-type galaxies include those between colour and magnitude (Sandage & Visvanathan, 1978a, b), colour and velocity dispersion (Bernardi et al., 2005), radius and luminosity (Sandage & Perelmuter, 1990), and radius and surface brightness (Kormendy, 1977). Some of these correlations can be combined into a “fundamental plane” which connects the effective radii, velocity dispersions and luminosities of ellipticals (Djorgovski & Davis, 1987; Dressler et al., 1987; Bernardi et al., 2003a).
The existence of these scaling relations and their tightness encode clues about the formation and evolution of elliptical galaxies. For example, the existence of a fundamental plane can be understood by applying the virial theorem to a gravitationally bound stellar spheroid in dynamical equilibrium, after making the assumption that ellipticals of different sizes have the same structure (homology) and a constant mass-to-light ratio. The deviation of the observed fundamental plane from this prediction can therefore be driven by variations in the mass-to-light ratio across the early-type population or by a non-uniformity of the structure of ellipticals, referred to as structural non-homology, or a combination of these two effects (Ciotti et al., 1996; Bertin et al., 2002; Trujillo et al., 2004a). At first sight, the small scatter around the observed correlations would appear to pose a challenge to hierarchical galaxy formation models, since the variety of merger histories in the models would lead one to expect to a corresponding scatter in the properties of early-type galaxies.
In this paper, we use a semi-analytical approach to model the properties of elliptical galaxies. Such models predict the star formation and merger histories of galaxies (for a review of this class of model, see Baugh, 2006). In general, two channels are considered for the formation of spheroids: galaxy mergers or secular evolution of the disc. We will describe the formation of discs and bulges in more detail in Section 2. The first attempts to track the disc and bulge of a galaxy separately simply recorded the mass and luminosity in each component (Baugh, Cole & Frenk 1996; Kauffmann 1996). The models have now progressed to a state where detailed predictions can be produced for the structural properties of galaxies in addition to their stellar populations. Cole et al. (2000) introduced a model for the sizes of the disc and spheroid components of galaxies: the size of a galactic disc is calculated by assuming conservation of the angular momentum of the gas as it cools and collapses in the halo; the size of the spheroid is derived by applying conservation of binding and orbital energy, and by applying the virial theorem to the merging galaxies. The Cole et al. scheme also takes into account the gravitational force of the dark matter and the reaction of the dark matter halo to the presence of the baryons (see Section 2 for further details).
Cole et al. tested their model for the sizes of galactic discs against the observed distribution of disc scale lengths estimated by De Jong & Lacey (2000), and verified that the predictions of their fiducial model were in excellent agreement with the observations.
Cole et al. did not test their prescription for predicting the size of galactic spheroids. This is the focus of our paper. In related studies, Gonzalez et al. (2007, in prep.) test the predictions of galaxy scale lengths for disks and bulges at and Coenda et al. (2007, in prep.), look at the evolution of galaxy sizes.
Hatton et al. (2003) used a similar scheme to that outlined by Cole et al. to compute the sizes of spheroids in the GALICS model. However, these authors adopted a less realistic model for the scale size of galactic discs. In common with many semi-analytical models, they assumed that the scale size of a disc is related to the virial radius of the host dark matter halo by , where is the dimensionless spin parameter for the dark matter halo, which quantifies its angular momentum, and is the halo virial radius. This ignores the self-gravity of the baryons and the contraction they produce in the central regions of the dark matter halo. Several papers have considered the origin of the fundamental plane and the role of gas-rich and gas-poor mergers using numerical simulations, which follow the dark matter and baryons (Kobayashi, 2005; Dekel & Cox, 2006; Robertson et al., 2006; Boylan-Kolchin et al., 2006).
In Section 2, we summarize our model, explaining the ingredients which are particularly pertinent to the formation of galactic spheroids. We first compare our predictions to the sample of early-type galaxies drawn from the Sloan Digital Sky Survey by Bernardi et al. (2005): the selection criteria are described in Section 3 and the comparisons between our model predictions and the data are given in Section 4. In Section 5, we explore the sensitivity of our model predictions to various physical ingredients of the models. The evolution with redshift of the model predictions for the scaling relations is presented in Section 6. Our conclusions are given in Section 7.
2 The galaxy formation model
A comprehensive overview of the GALFORM model of galaxy formation and the philosophy behind semi-analytical modelling can be found in Cole et al. (2000) (see also the review by Baugh, 2006). Important extensions to the model are described in Benson et al. (2002) and Benson et al. (2003). In this paper, we focus on the predictions of the model introduced by Baugh et al. (2005). These authors put forward the first fully consistent hierarchical galaxy formation model which was able to explain the observed number counts of sub-mm sources and the luminosity function of Lyman-break galaxies, at the same time as reproducing the observed properties of the low redshift galaxy population. In some instances, we also show predictions from the model described by Bower et al. (2006), which includes feedback processes associated with the accretion of material onto a supermassive black hole, using the model of black hole growth explained in Malbon et al. (2006). Predictions from the Bower et al. model can be downloaded over the internet (see Lemson et al., 2006).
We now give a brief overview of the GALFORM model, referring the reader to the references given in the previous paragraph for further details. We then outline some of the differences between the Baugh et al. and Bower et al. models. Finally, we recap some of the ingredients of the model which are particularly important for determining the masses and sizes of galactic spheroids and discs.
The aim of the GALFORM model is to make an ab initio calculation of the formation and evolution of the galaxy population, set in the context of a cosmological model in which structures in the dark matter form hierarchically through gravitational instability. The main physical processes which we incorporate into the model are the following: (i) The hierarchical merging and collapse of dark matter haloes. (ii) The radiative cooling of shock heated gas. (iii) Quiescent star formation in discs. (iv) Feedback processes driven by supernovae and by the accretion of material onto supermassive black holes in the case of the model of Bower et al. (2006). (v) The effect of a photoionizing background of radiation on the intergalactic medium and on galaxy formation(see Benson et al., 2002). (vi) The chemical enrichment of the gas and stars. (vii) The decay of the orbits of galactic satellites due to dynamical friction. This can lead to mergers between galaxies which can trigger bursts of star formation and a change in galaxy morphology (see the next subsection). The model generates a star formation history and a galaxy merger history for a representative population of galaxies at any epoch. Each galaxy is split into two components, a disc and a bulge. The formation of these components is discussed in the next subsection.
For completeness, we now give a list of the primary differences between the Baugh et al. (2005) and Bower et al. (2006) models, even though the Baugh et al. model is the main focus of the comparisons presented in the paper:
-
1.
Dark matter halo merger trees. The Bower et al. model utilizes merger histories for dark matter haloes drawn from the Millennium Simulation of the hierarchical clustering of dark matter in a CDM universe (Springel et al., 2005). The simulation covers a volume of . The mass resolution of the trees extracted from the simulation is . The Baugh et al. model is not set in the context of an N-body simulation. Instead, a representative sample of galaxies is constructed by considering a grid of dark halo masses. For each mass on the grid, realizations of merger trees are generated using a Monte Carlo algorithm based on extended Press-Schechter theory (see Cole et al., 2000). The mass resolution used in the Monte Carlo trees is a factor of three better than that of the trees drawn from the Millennium. Helly et al. (2003) compared model predictions obtained using Monte Carlo or N-body merger trees and reached the conclusion that the results are very similar for bright galaxies, with the two prescriptions giving divergent answers for the luminosity function at faint luminosities; for the resolution of the Millennium, the predictions for the luminosity function are robust down to around three magnitudes fainter than the break in the luminosity function.
-
2.
The suppression of bright galaxy formation. Hierarchical models tend to produce too many bright galaxies unless some physical mechanism is invoked to regulate the formation of massive galaxies. The Baugh et al. and Bower et al. models do this in different ways. Baugh et al. adopt a superwind driven by star formation (see Benson et al., 2003). In this case, the wind drives cold gas out of the galactic disc and out of the gravitational potential well of the dark halo. The effectiveness of the wind depends upon the depth of the potential well. Such winds have been observed in massive galaxies, with inferred mass ejection rates which are comparable to the star formation rate (e.g. Pettini et al., 2001; Wilman et al., 2005). In the Bower et al. model, the cooling of gas in quasi-static hot gas haloes is suppressed, effectively cutting off the “fuel supply” for star formation. These are haloes in which the cooling time of the gas exceeds the free fall time within the halo. The cooling is quenched by the energy injected into the hot halo by the accretion of mass onto the central supermassive black hole in the galaxy. The growth of the black hole is followed using the model described by Malbon et al. (2006).
-
3.
Quiescent star formation in discs. The scaling with redshift of the timescale for quiescent star formation in galactic discs is different in the two models. Both models allow the star formation timescale to depend upon some power of the circular velocity of the disc, and multiply this by an efficiency factor (eqn. 4.14 of Cole et al.). Baugh et al. assume that the efficiency factor is independent of redshift, whereas in the Bower et al. model this factor scales with the dynamical time of the galaxy. Dynamical times are shorter at high redshifts, so the quiescent star formation timescales are shorter in the Bower et al. model at high redshift than they are in the Baugh et al. model.
-
4.
Star formation in bursts. Globally, the two models display somewhat different star formation densities in bursts. Furthermore bursts are triggered in different ways in the models. Baugh et al. only consider bursts resulting from galaxy mergers. A burst may accompany a major merger in which a galaxy accretes a satellite of a comparable mass to its own, or a minor merger in which a gas rich disc is hit by a much smaller satellite. Bower et al. consider this mode of initiating star bursts, but also incorporate bursts which occur when discs become dynamically unstable. The need for this additional channel for bursts is driven by the need to build up black hole mass, so that cooling flows can be suppressed in massive haloes. One final difference to note between star bursts in the two models is that Baugh et al. invoke a flat initial mass function (IMF) for stars produced in a burst, whereas Bower et al. adopt a standard IMF (Bower et al. adopt a Kennicutt (1998) IMF in all modes of star formation; Baugh et al. use the Kennicutt IMF in quiescent star formation).
-
5.
Background cosmology. Baugh et al. adopt the parameters of the concordance CDM model: matter density, , cosmological constant, , baryon density, and a normalization of density fluctuations given by . Bower et al. use the cosmological parameters of the Millennium simulation, which are in better agreement with the constraints from the anisotropies in the cosmic mircowave background and large scale galaxy clustering (e.g. Sánchez et al., 2006): , , and . The power spectrum of density fluctuation used in the Millennium has somewhat more large scale power and less small scale power than that in the concordance CDM model.
One difference between the predictions of the two models is the amount of star formation which takes place in starbursts. Baugh et al. calculate that 30% of all star formation in their model takes place in starbursts driven by galaxy mergers. However, due to the high recycled fraction in starbursts as a consequence of a top-heavy IMF, only 7% of this mass is locked up in long lived stars, and yet bulges account for around 50% of the global stellar mass in this model. The re-assembly of stars which were produced with the standard IMF used in quiescent star formation is therefore the primary source of stellar mass in bulges (Baugh, Cole & Frenk 1996; de Lucia et al. 2006; de Lucia & Blaizot 2006). In the Bower et al. model, the amount of star formation triggered by galaxy mergers is lower than in the Baugh et al. model for a combination of reasons: 1) Bower et al. use a quiescent star formation timescale which depends on the dynamical time, and is thus shorter at high redshift. Galactic disks at high redshift are therefore gas poor in the Bower et al. model compared with those in the Baugh etal model, so there is less fuel for the starbursts. 2) Minor mergers do not trigger bursts of star formation in the Bower et al. model, as is the case in the Baugh et al. model. In the Bower et al. model, disk instabilities account for over half of the star formation in bursts. Due to the choice of a standard IMF in all modes of star formation in this model, bursts are responsible for producing around a quarter of the mass in bulge. Again, the re-assembly of stellar mass made in galactic disks is the main source of spheroid stars.
2.1 The formation of spheroids and discs
We assume that gas initially settles into a rotationally supported disc when it cools from the hot halo. This gas eventually turns into stars in the quiescent star formation mode. The effective timescale on which the star formation takes place does not depend upon the dynamical time of the disc in the model of Baugh et al. (2005), but does have some dependence on the circular velocity of the disc.
The formation of galactic spheroids takes place through two channels: galaxy mergers and the instability of galactic discs. Baugh et al. only consider the galaxy merger mode of spheroid formation; Bower et al. consider both mechanisms.
The consequences of a galaxy merger are characterized by the ratio, , of the mass of the accreted satellite galaxy () to the mass of the primary or central galaxy in the halo (), onto which the satellite is accreted. The mass ratio is compared to two thresholds, and , to establish the severity of the merger (see, for example, Bournaud et al., 2005). These thresholds are model parameters. If , then the galaxy merger is termed “major”. In the case of major mergers, the disc of the primary galaxy is destroyed. All stars are transferred to the spheroid component and any cold gas present participates in a burst of star formation which adds stars to the spheroid. If the mass ratio of satellite to primary falls between the thresholds, i.e. , then the stellar disc of the primary survives and the stars from the accreted satellite are added to the spheroid. In this case, if the primary is also gas rich, that is if cold gas accounts for at least 75% of the total mass in the disc, then we assume that the accretion of the satellite induces an instability which drains the primary disc of cold gas, leading to a burst of star formation in the spheroid.
In our model, a galaxy can move in either direction along the Hubble sequence (Baugh et al., 1996). The accretion of gas from the hot halo and subsequent quiescent star formation leads to a late-type (disc dominated) galaxy. A major merger between two such galaxies produces a descendent galaxy which jumps to the opposite end of the Hubble sequence, becoming an early-type galaxy (bulge dominated). Further accretion of cooling gas allows the galaxy to grow a new disc around its bulge, moving the galaxy back towards the late-type part of the sequence.
In addition to the merger mode of spheroid production, Bower et al. also consider the secular production of bulges from discs which are unstable due to their strong self-gravity. This mode is most important in less massive galaxies.
2.2 The scale lengths of the disc and bulge components of galaxies
We assume that discs have an exponential profile, with a half-mass radius given by , and bulges have a profile in projection, with a half mass in 3D given by .
The scalelength of the disc is determined by the angular momentum of the halo gas, which arises due to the tidal torques which act during the formation of the halo. The angular momentum of the halo gas is quantified by the dimensionless spin parameter, ; this quantity is assumed to follow a log-normal distribution matching the results of N-body simulations (see Cole et al., 2000, for details). We assume that the angular momentum of the gas is conserved as it cools to form a rotationally supported disc (see Okamoto et al., 2005, for a discussion of this assumption).
Spheroids are formed in galaxy mergers or through disc instabilities as outlined in the previous subsection. The size of the spheroid resulting from a galaxy merger, , is determined by applying the conservation of energy and the virial theorem (see Section 4.4.2 of Cole et al., 2000):
| (1) |
where represents the total mass (stellar, cold gas and dark matter) of one of the merging objects, within , and the form factor and the parameter are related to the self-binding energy and orbital energy by
| (2) | |||||
| (3) |
For simplicity, we adopt and . Later on, we explore the impact on our predictions of varying . Similar arguments are applied to calculate the scale size of the spheroid which results from an unstable disc (see Section 4.4.3 of Cole et al., 2000).
Once the scale lengths of the disc and bulge components have been calculated as outlined above, we next take into account the selfgravity of the baryons and the contraction of the dark matter halo in response to the gravity of the condensed baryons. New radii are computed for the disc and bulge by applying an adiabatic contraction of the disc, bulge and dark matter components (Blumenthal et al., 1986; Jesseit et al., 2002). In the case of the disc, the total specific angular momentum is conserved. The bulge and dark matter halo are not rotationally supported. Nevertheless, it is useful to define an equivalent circular velocity using the velocity dispersion of each of these components, and, using this, to define a quantity which we refer to as a pseudo-angular momentum. For the bulge the pseudo-angular momentum is given by: . This quantity is conserved during the adiabatic contraction. A similar quantity is conserved for the dark matter.
In the case of the secular growth of spheroids, we again apply the conditions of virial equilibrium and energy conservation as in Eq. 1, defining the component 1 as the galactic bulge, , , and the component 2 as the unstable disc, , . After the calculation of the radius of the new bulge, we readjust adiabatically the spheroid and halo terms to reach the new equilibrium.
3 The selection of an early-type sample
We first compare our model predictions against the scaling relations and statistics of the sample of early-type galaxies constructed from the SDSS by Bernardi et al. (2003a, 2005). These authors measured relations between luminosity and various properties of early-type galaxies such as velocity dispersion, effective radius, effective mass, effective density and surface brightness (Bernardi et al., 2003b, 2005). The sample was also used to measure the luminosity function of early-type galaxies (Bernardi et al., 2003b), the fundamental plane (Bernardi et al., 2003c) and the colour-magnitude/colour-velocity dispersion relations (Bernardi et al., 2003d, 2005).
For a complete description of the construction of the early-type sample from the SDSS, we refer the reader to the above papers. Below we give a summary of the selection criteria applied by Bernardi et al. (2005) (hereafter Ber05). Galaxies are included in the sample if they have:
-
1.
Redshift , with a median .
-
2.
Apparent r-band Petrosian magnitudes in the range .
-
3.
eclass . The eclass value is a classification of the spectral type of a galaxy derived from a principal component decomposition of its spectrum (Connolly & Szalay, 1999). Ber05 chose negative values of eclass as this corresponds to spectra in which absorption lines dominate, characteristic of early-type galaxies.
-
4.
fracDev, computed using the band image. The value of fracDev is an indicator of morphology. It is calculated in two steps, in turn. First, the best fit de Vaucouleurs and exponential profiles to the galaxy image are found. Second, using the scale lengths of the best fit profiles found in step one, the best fit linear combination of the disc and bulge profiles is derived. The contribution of the de Vaucouleurs profile to this linear combination is the value of fracDev.
We attempt to reproduce these selection criteria by imposing the following conditions on GALFORM galaxies:
-
1.
We generate a population of galaxies at an output redshift of , the median redshift of the Ber05 sample. In our comparisons, we consider only Ber05 galaxies that lie within the redshift interval , close to the median redshift. This additional selection in redshift reduces the size of the observational sample by a factor of to objects.
-
2.
We use total magnitudes to select a sample of model galaxies. We apply the same apparent magnitude limits which are used for the data. This is a reasonable approach as the difference between total and Petrosian magnitudes is typically smaller than 0.2 mag (Graham et al., 2005). We have also computed Petrosian magnitudes for our model galaxies and find that using the Petrosian magnitudes in place of total magnitudes does not make a significant difference to our results.
-
3.
At present, GALFORM does not produce spectra with absorption line features. Therefore we cannot directly calculate a value for the spectral parameter eclass. Instead, we use the colour which is more readily predicted for model galaxies. In Fig. 1, we use the SDSS DR4 to show that there is a good correlation between colour and eclass. We retain galaxies with ; Fig. 1 shows that more than 95% of the galaxies with a negative value for eclass are selected by this colour cut.
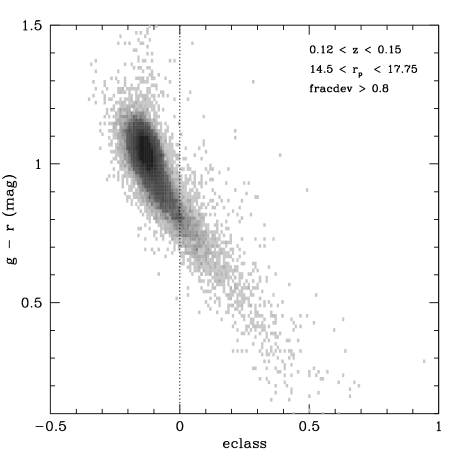
Figure 1: The relation between colour and eclass, for a sample of galaxies selected from SDSS DR4 in the redshift range and with Petrosian magnitudes in the interval . The dotted line represents the selection applied to the observational data, eclass , by Bernardi et al. (2005): more than 95% of these galaxies have . -
4.
We compute the value of fracdev in the a similar way as was done for the SDSS galaxies. We assume that the model bulges follow a de Vaucouleurs profile and the discs an exponential profile; these profiles describe the distribution of stellar mass, and so are independent of the passband. We adopt a cut on fracdev . In Section 4.1, we explore the impact on our predictions of replacing the cut in the value of fracdev with a simple cut on the bulge-to-total luminosity ratio of the model galaxies.
-
5.
Due to limitations of the SDSS data we also set a surface brightness threshold, mag arcsec-2.
4 Results
In this section, we compare the predictions of the Baugh et al. (2005) model with observational data for early-type galaxies derived from the SDSS sample of Ber05.
4.1 The luminosity function of early-type galaxies
The luminosity function is perhaps the most fundamental statistical description of the galaxy population. Later on, we perform fits to the fundamental plane of early-type galaxies in our model. The results for this fit are sensitive to the abundance of galaxies as a function of luminosity, so it is imperative that the model reproduces the observed luminosity function closely.
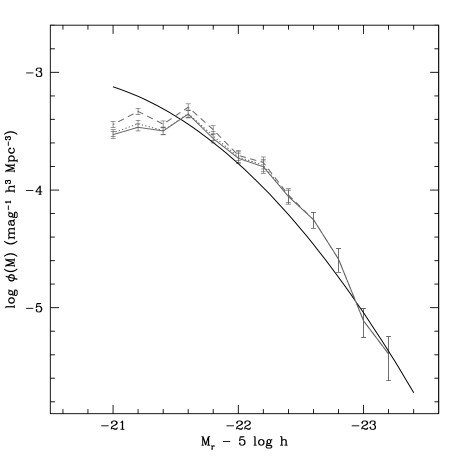
In Fig. 2, we compare the predictions of the GALFORM model for the -band luminosity function of early-type galaxies with the estimate from the SDSS sample of Ber05. The luminosity function of SDSS early-types is well described by a Gaussian form: , where respectively (note, Ber05 assume ). The model predictions are in reasonably good agreement with the luminosity function estimated from the data.
We also show, in Fig. 2, the effect of changing the criteria used to select early-type galaxies in the model. In our standard selection, the primary indicator of morphology is fracdev (see Section 3). We have also explored using the bulge-to-total luminosity ratio in the -band, B/Tr, in place of fracdev (Baugh et al., 1996). The results for cuts of B/T and B/T are shown by the dotted and dashed lines respectively in Fig. 2. The luminosity function derived using B/T is remarkably similar to the one obtained using fracdev (shown by the solid grey line).
In our subsequent comparisons with the SDSS sample of early-types, we assign each model galaxy a weight which depends upon luminosity, such that the luminosity function of early-types in the model is forced to reproduce exactly the luminosity function of the data.
4.2 The Faber-Jackson and -age relations
The Faber-Jackson (hereafter FJ) relation was one of the first scaling relations to be discovered for early-type galaxies (Faber & Jackson, 1976). This relation indicates that luminosity is a strong function of velocity dispersion, , with brighter early-types displaying larger velocity dispersions. Observational studies suggest that this relation is approximately given by : Forbes & Ponman (1999), using a local sample of early-type galaxies, found in the B-band, while Pahre et al. (1998) reported in the K-band. These results also indicate that the FJ relation is essentially independent of wavelength. In the case of SDSS early-type galaxies, Bernardi et al. (2003b) confirmed these earlier results, finding in the r-band at , with no significant differences in slope apparent in the g, i or z-bands.
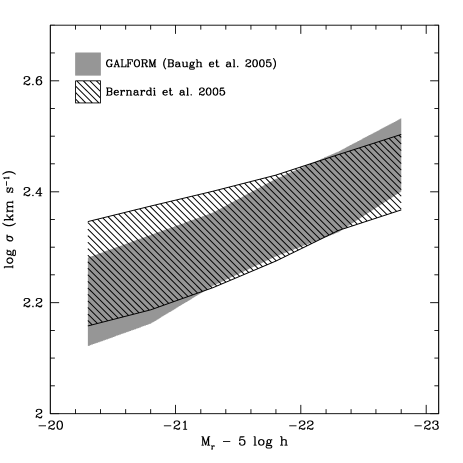
Fig. 3 shows the velocity dispersion-magnitude relation predicted by GALFORM. The one-dimensional velocity dispersion is calculated using , where is the effective circular velocity of the bulge, which is assumed to be isotropic (Frenk et al., 1988; Cole et al., 1994). The factor of 1.1 is an empirical correction which Cole et al. employed to map data for elliptical galaxies onto the Tully-Fisher relation for spiral galaxies. Fig. 3 shows that retaining this factor gives good agreement with the observed FJ relation. We find no change in the predictions if we consider, instead, the effective circular velocity of the disc and bulge combined. This is a consequence of our selection which ensures that the model galaxies we consider are bulge dominated, as shown by Fig. 2. We find reasonably good agreement between model predictions and the FJ relation observed for the Ber05 sample, albeit with a shallower slope, (note, we plot on the y-axis). Whilst the slope of the predicted FJ relation is formally at odds with that measured by Ber05, it is clear from Fig. 3 that the velocity dispersion of the model galaxies would change by relatively little even in the case of perfect agreement between the observed and predicted slopes, given the limited range of magnitudes plotted. We find little dependence of the slope of the FJ relation on passband, in agreement with observations.
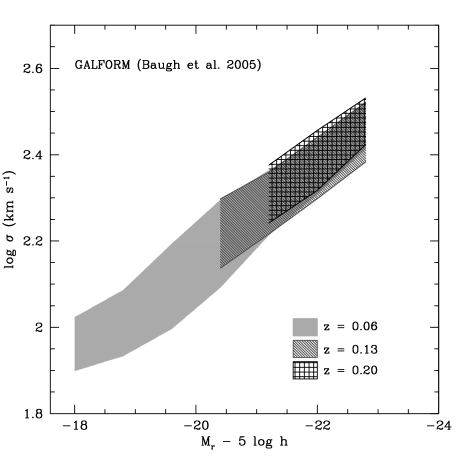
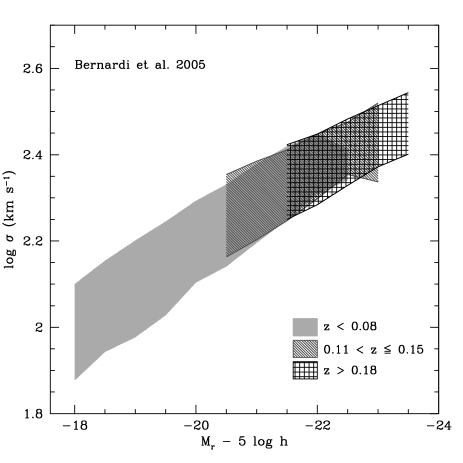
The evolution of the FJ relation with redshift is plotted in Fig. 4. Here, we have chosen output redshifts in GALFORM to match the median redshifts of the Ber05 redshift subsamples: for SDSS galaxies with we use for the model galaxies, and for SDSS galaxies with we set . Little evolution is observed in the zero-point of the FJ relation with redshift, a trend which is reproduced by the model predictions. The shift to brighter magnitudes with increasing redshift is simply a reflection of the fixed apparent magnitude limit of the SDSS. As we shall see in next section, this absence of evolution is actually expected at these redshifts due to the cancellation of two different evolutionary effects.
Finally, in Fig. 5, we plot the luminosity-weighted age of the stellar population, computed in the -band, as a function of the velocity dispersion. Some authors have argued that a correlation exists between these quantities, which has implications for the scatter in the FJ relation (Forbes & Ponman, 1999; Nelan et al., 2005).
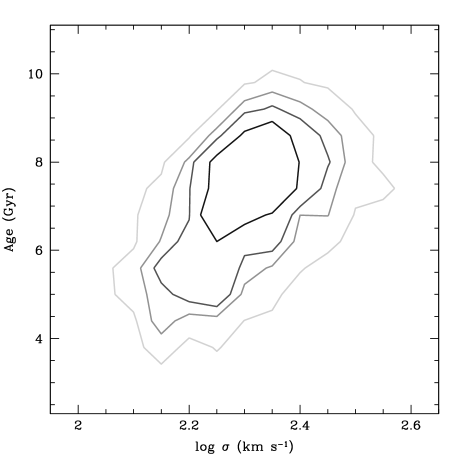
Fig. 5 reveals that velocity dispersion and luminosity-weighted age are indeed correlated in the model, with galaxies which have larger velocity dispersions also displaying older stellar populations. A linear fit to the model predictions shows that , which is in excellent agreement with recent determination by Nelan et al. (2005), who found . Furthermore, we verify that the inclusion of AGN feedback, as implemented by Bower et al. (2006), does not change this relation substantially, giving . At first sight, these predictions seem to contradict those presented, for a different observational selection, by Nagashima et al. (2005b). However, it is important to note that, at least in the case of the model galaxies, the slope and scatter of the relation are very sensitive to the selection criteria applied.
4.3 Radius-Luminosity Relation
Another component of the fundamental plane of early-type galaxies is the relation between radius and luminosity; galaxies with larger radii are more luminous. This was originally of interest for use in distance scale measurements and cosmological tests (Sandage & Perelmuter, 1990). Different studies indicate that this relation varies slightly with wavelength. For example, Schade et al. (1997) determined in the B-band and Pahre et al. (1998) found in the K-band. For SDSS early-type galaxies, Bernardi et al. (2003b) reported in the g-band and in the r, i and z-bands, which is consistent with the variation of the slope of this relation with wavelength suggested by the earlier determinations.
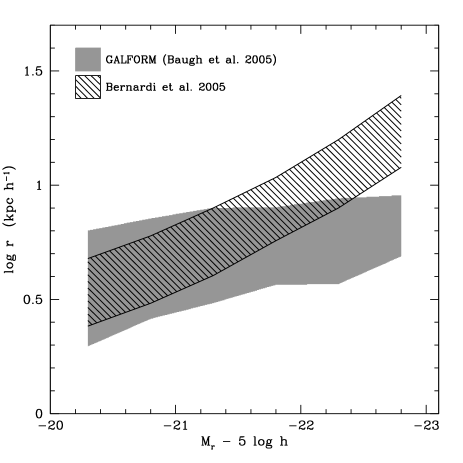
We compare the predicted radius-luminosity relation with the Ber05 data in Fig. 6. The effective radius plotted here, , is the projected bulge half-light radius of the de Vaucouleurs law, which is related to the half-mass radius in 3D, , by: . The model predictions do not change if we compute a composite half-mass (half-light) radius from the disc and bulge components of the galaxy, as the model galaxies we consider are bulge dominated. The slope of the predicted radius-luminosity relation is flatter than is observed. The agreement between the model predictions and the observations is best at fainter magnitudes; the brightest early-type galaxies are predicted to be around a factor of three smaller in effective radius than is observed. Fig. 6 and Fig. 3 suggest that in the model, the high luminosity early-type galaxies have a pseudo-angular momentum which is lower than would be inferred from the data (see § 2.2 for the definition of the pseudo-angular momentum of a spheroid).
4.4 Effective Mass
We can define an effective dynamical mass, , by setting . This differs from the true mass, , because the definition of ignores any rotational support and the flattening of galaxies. The difference between the two masses can be quantified by a correction term, : . For a galaxy with T-type E0, there is no flattening or rotational support and so . In contrast, for the case of an E6 galaxy, the true mass is almost twice as large as the dynamical mass, with (see Bender et al., 1992, for details).
In Fig. 8 we compare our prediction for the relation between dynamical mass and luminosity with the observed result for the Bernardi et al. (2005) sample.
The figure reveals reasonable agreement between the model and the observations for fainter galaxies. Brighter galaxies, in the model, have a somewhat lower dynamical mass than observed. As we noted when discussing the radius-luminosity relation, high luminosity galaxies in the model display a lower specific pseudo-angular momentum than is observed, which translates into a smaller dynamical mass.
4.5 Fundamental Plane
Observational studies indicate that early-type galaxies show tight correlations between their kinematic and photometric properties (Djorgovski & Davis, 1987; Dressler et al., 1987). The remarkably small scatter about the so-called fundamental plane connecting the effective radius, velocity dispersion and surface brightness of early types encodes information about the formation and evolution of these galaxies.
The existence of a fundamental plane is expected if a stellar system obeys the virial theorem, which connects the kinetic and potential energies. The assumption of virial equilibrium gives a relation between the three-dimensional velocity dispersion, and the “gravitational” radius, , assuming that the system is gravitationally bound:
| (4) |
This equation can be rewritten in terms of the central one dimensional velocity dispersion, , and the effective radius of the galaxy, ,
| (5) |
where we have defined structural constants such that
based on the assumption that the population is homologous.
The mean surface brightness within half-mass radius of a galaxy is , where is the total luminosity of the galaxy and the mean surface density is given by . The ratio of the surface brightness to the surface density is equal to the mean mass-to-light ratio of the galaxy, within : . Using these definitions, Eq. 5 can be rearranged to give an expression for the fundamental plane,
| (6) |
where is a constant whose value depends upon and the choice of units.
The observed plane is slightly different from the form predicted in Eq. 6, which follows by applying the virial theorem to a purely stellar galaxy without any dark matter and assuming an homologous population. For example, Jørgensen et al. (1996) found , while Bernardi et al. (2003c) obtained .
The discrepancy between the theoretical prediction outlined above and the observational results is known as the tilt of the fundamental plane. Trujillo et al. (2004a) argued that this tilt is due to a combination of effects: structural nonhomology, which means a change in the surface brightness profile of the early-types with luminosity, and a variation in the mass-to-light ratio of the stellar populations with galaxy luminosity.
The intrinsic thickness or scatter in the fundamental plane poses another challenge, and its interpretation is far from clear. Forbes et al. (1998) showed that the scatter was mainly due to the age of the stellar population. However, Pahre et al. (1999) demonstrated that the position of the galaxy relative to the FP could not be entirely due to age or metallicity effects.
To determine the location of the fundamental plane, we consider an orthogonal fit to the plane given by:
and determine the values of the coefficients , and by minimizing the quantity
Following this procedure, we obtain a fundamental plane for given by in the r-band.
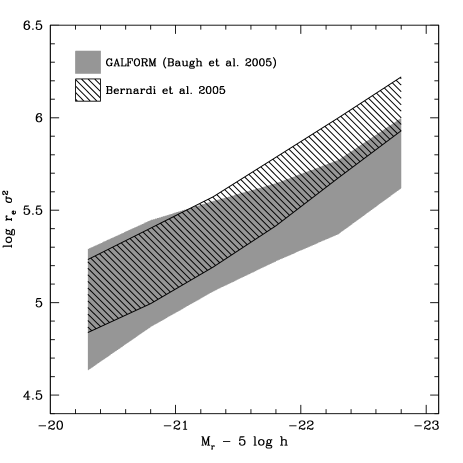
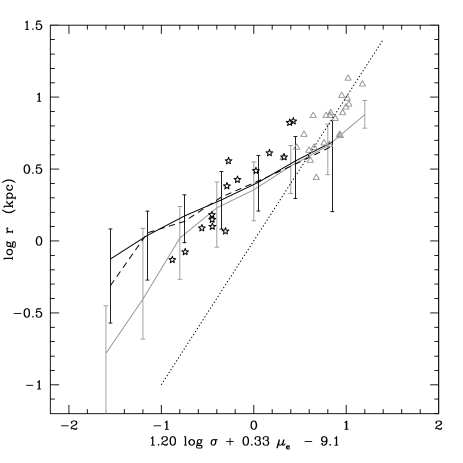
In Fig. 9, we plot the fundamental plane derived from GALFORM model galaxies, along with the data from Bernardi et al. (2005) in the same projection of the plane.
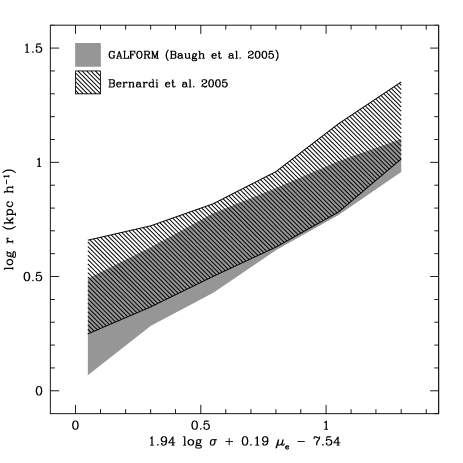
Fig. 9 reveals reasonable agreement between the fundamental plane predicted by GALFORM and the observational data: we can reproduce not only the tilt, but also the scatter associated with the plane. In the g-band we calculate: ; and similar results in the i and z-bands. This reveals that the slope of the FP is independent of wavelength, analogous to the results found by Bernardi et al. (2003c).
We plot the fundamental plane at different redshifts in Fig. 10. The radius, velocity dispersion, surface brightness and mass-to-light ratios of the model galaxies all evolve with time (see §5), so one might expect to see some evolution in the fundamental plane itself, unless the changes in these quantities occur in such a way as to cancel out any evolution in the locus of the plane.
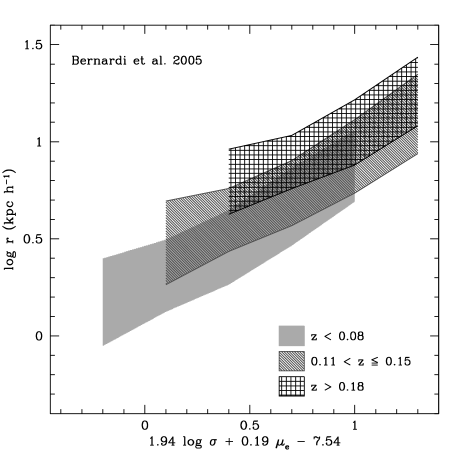
Ber05 report evolution in the position of the fundamental plane which corresponds to a change in the mean galaxy surface brightness of . We find no clear evidence for evolution in the model predictions over the same redshift interval. In section 6 we show the predictions for the scaling relations over a wider baseline in redshift.
5 The dependence of the structural properties of ellipticals on the physical ingredients of the model
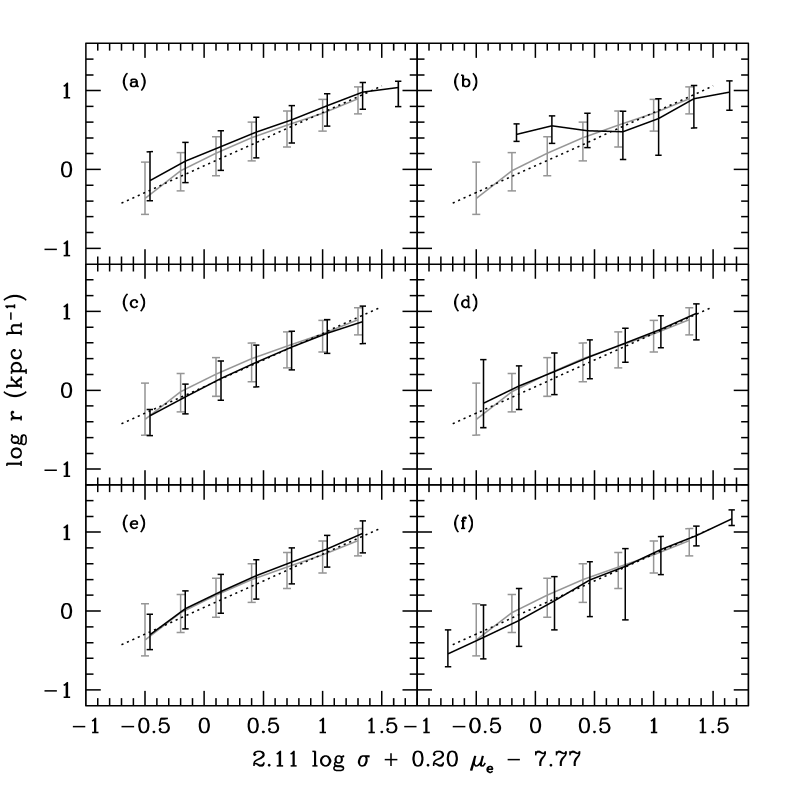
Our calculation of the sizes of galactic spheroids contains several steps and is sensitive to some of the physical ingredients of the galaxy formation model more than others. The beauty of semi-analytical modelling is that we can switch off or vary particular assumptions or processes to isolate their impact on the model predictions. Such a study is only possible to a very limited extent in fully numerical simulations of galaxy formation. Moreover, the high speed of the semi-analytical calculations compared with a numerical simulation allows us to examine many different variants in a short time. In this section, we seek to establish the sensitivity of our model predictions for the structural and photometric properties of spheroids to the composition of the model. For this purpose, we study the model predictions at and consider bulge dominated galaxies, i.e. those with a bulge-to-total luminosity ratio in the -band of . The results of this section are presented in Figs. 11, 12, 13 and 14, which look, respectively, at how deviations from the fundamental plane correlate with various galaxy properties, the Faber-Jackson relation between velocity dispersion and luminosity, the radius-luminosity relation and the fundamental plane.
5.1 The deviation from the fundamental plane
As we noted in the previous section, there is some controversy in the literature regarding the source of the dispersion around the fundamental plane, with some authors arguing that the scatter could be due to a number of causes, such as variations in the formation times of galaxies, metallicity trends in stellar populations, or differences in the dark matter content of galaxies.
Fig. 11 shows how the deviation from the fundamental plane correlates with various galaxy properties.
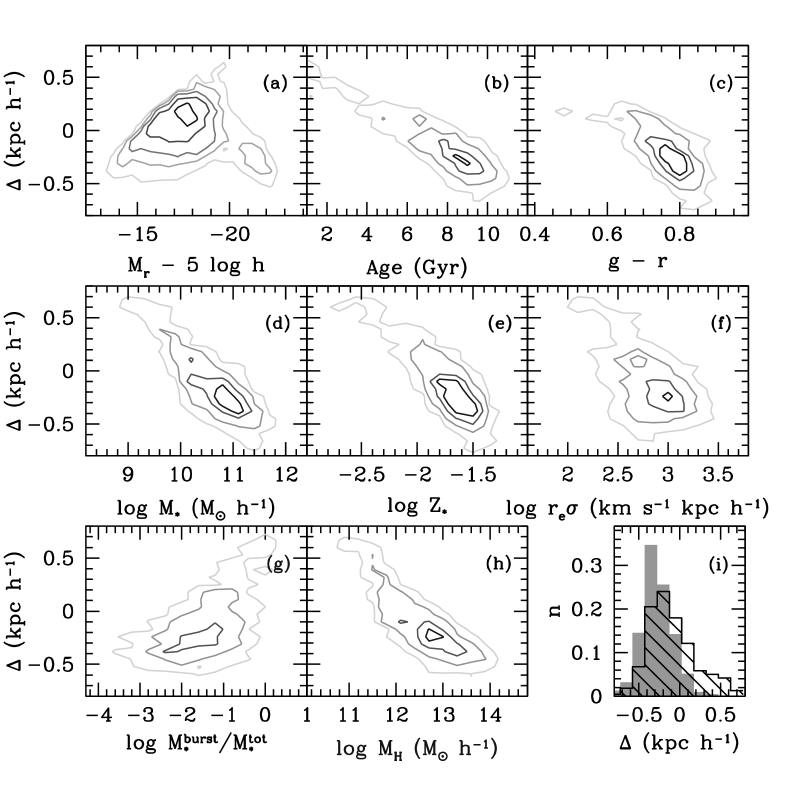
Here, the quantity represents the offset from the fundamental plane predicted in the -band, after applying the selection criteria to match the Ber05 SDSS sample: . Fig. 11(a) shows that the deviation is correlated with r-band absolute magnitude for galaxies fainter than . This result shows that magnitude-limiting a sample might bias the determination of the fundamental plane. Surprisingly, luminous early-type galaxies () exhibit no correlation with deviation from the fundamental plane, which is in agreement with the results of Bernardi et al. (2003b). For the remaining panels in Fig. 11, we only select galaxies with (i.e. brighter than one magnitude faintwards of ), in order to make our results comparable to observations. Fig. 11(b) reveals a strong anticorrelation between the deviation and the r-band luminosity-weighted age of the galaxy, in the sense that galaxies which lie above the fundamental plane are younger. A linear fit to the distribution reveals Age . This strong correlation indicates that the age of the stellar population plays an important role in determining the position of the galaxy in the fundamental plane space (see Forbes et al., 1998; Pahre et al., 1999). We find that the fundamental plane offset is also anticorrelated with g-r colour (Fig. 11(c)). As noted by Bernardi et al. (2003c), this is due to the correlation between colour and velocity dispersion (see also Bernardi et al. 2005). Interestingly, we see in Fig. 11(d) that the total stellar mass is anticorrelated with the deviation from the fundamental plane, for galaxies brighter that . When all the early-type galaxies are included, then the distribution reveals a different picture: similar to the trend seen in panel (a), we find that faint galaxies show a stronger deviation from the fundamental plane. Fig. 11(e) shows that the absolute metallicity of the stellar population is anticorrelated with a deviation from the fundamental plane: metal-rich galaxies are to be found predominately below the mean fundamental plane relation. The relation between the pseudo-specific angular momentum, , of the bulge and the FP offset is plotted in Fig. 11(f), revealing a weak anticorrelation between these quantities. There is little correlation between the deviation from the fundamental plane and the fraction of the total stellar mass formed in the last burst of star formation triggered by a galaxy merger (Fig. 11(g)), which shows that the presence of gas in galaxy mergers does not change significantly the fundamental plane relation. This seems to contradict the recent results of Robertson et al. (2006). However, if we also consider faint galaxies, which tend to have mergers containing a larger fraction of gas, then we find an anticorrelation between and the deviation from the FP, along the lines of that seen by Robertson et al. The relation between the deviation from the FP and halo mass is shown in Fig. 11(h). We find an anticorrelation between these two quantities, such that galaxies which lie in more massive haloes are found below the main FP relation, i.e. cluster galaxies should lie below the mean fundamental plane. In Fig. 11(i), we show that the distribution of the FP offset for central galaxies resembles that predicted for satellite early-types.
5.2 The physics of the model and the scaling relations
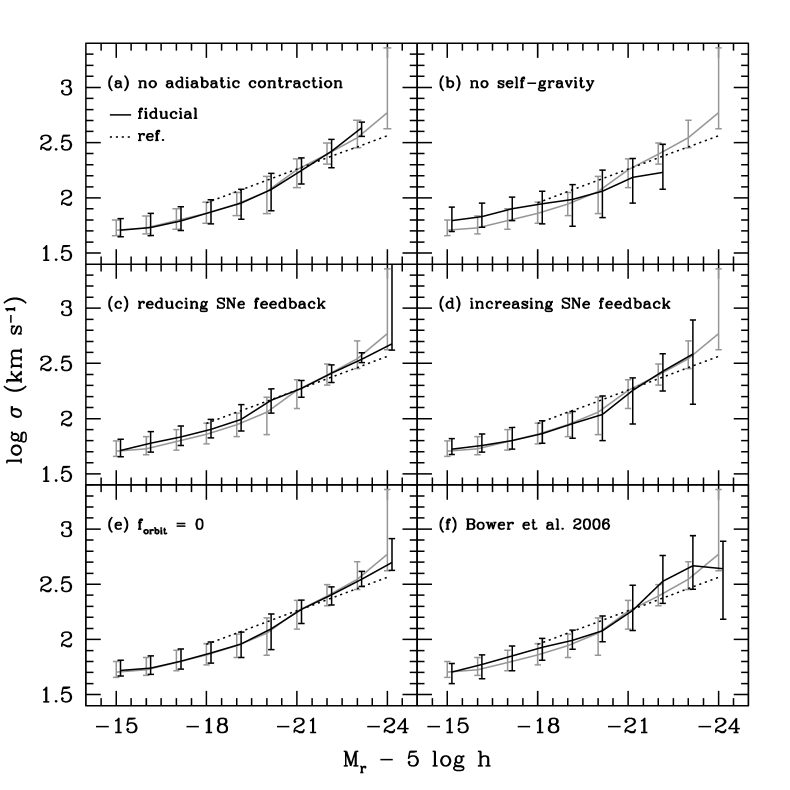
In this section, we examine how the predictions of the Baugh et al. model change if one ingredient at a time is varied. These variant models are not necessarily acceptable galaxy formation models, because they may not give as good a match to the local data used to calibrate the model parameters as was the case for the fiducial Baugh et al. model. We also show the predictions of the Bower et al. model, as a further example of a variant model. In this case, many ingredients have been changed from the ones used in the Baugh et al. model, as explained at length in Section 2.
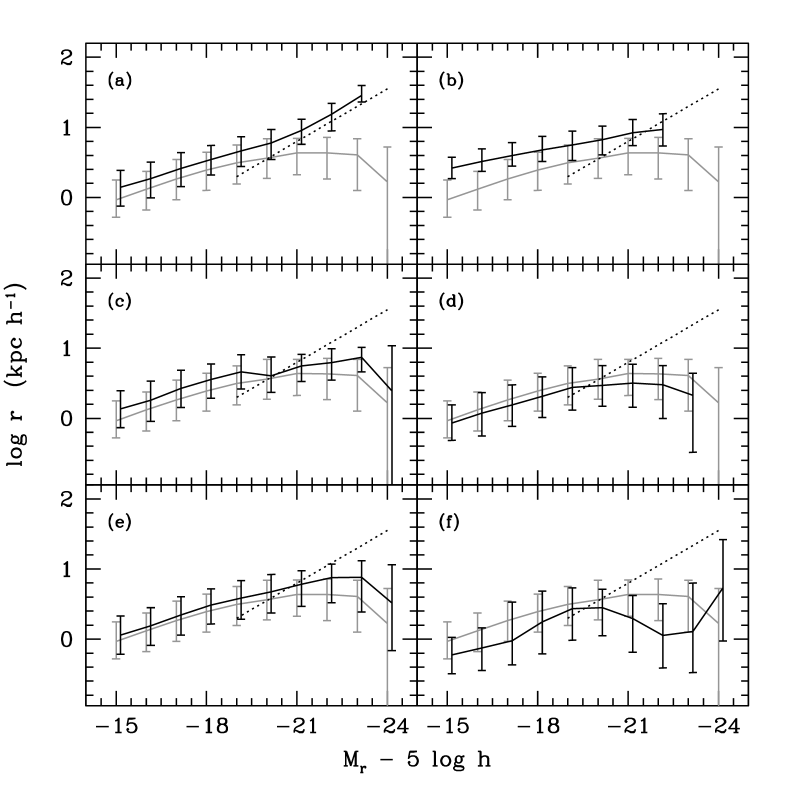
The first ingredient we test is the adiabatic contraction model used to take into account the gravitational pull of the baryons on the dark matter. To recap, the condensation of baryons at the centre of the dark matter halo provides an additional gravitational force on the dark matter which causes it to move inwards, thereby increasing the density of dark matter in the central part of the halo. This in turn alters the gravitational force on the baryons due to the dark matter. The degree of contraction is computed by exploiting the fact that, in a slowly varying potential, the action integral, , is an adiabatic invariant for each particle of mass , where is the conjugate momentum of the coordinate (Barnes & White, 1984; Blumenthal et al., 1986; Jesseit et al., 2002). If we assume spherical symmetry and circular orbits, the action integral simplifies to the conservation of angular momentum in spherical shells, . The adiabatic contraction of the dark matter leads to a more centrally peaked halo density. The main consequence of switching off the adiabatic contraction of the dark matter halo is that the half-mass radius of the spheroid increases (Fig. 13(a)). The radii of bright galaxies increase by a larger factor than those of faint galaxies, leading to a steepening of the radius-luminosity relation. The slope of the radius-luminosity is in much better agreement with the observed slope on omitting adiabatic contraction, although the model galaxies are too large overall (both spheroids and discs).
Next we ignore the self-gravity of the baryons when computing the size and effective rotation speed of the disc and bulge. This also means that there is no adiabatic contraction. The rotation curve of the galaxy in this case is set purely by the dark matter, which is assumed to have an NFW density profile (Navarro, Frenk, & White, 1997). The consequences of this change are a flattening in the velocity dispersion-luminosity relation (Fig. 12(b)), with brighter galaxies displaying a lower velocity dispersion, and a uniform increase in the radius of the spheroid (Fig. 13(b)). In combination, these changes result in a different projection of the fundamental plane which looks flatter in the projection which best fits the predictions of the fiducial model.
Feedback, the regulation of the star formation rate due to the reheating and ejection of cooled gas following the injection of energy into the interstellar medium by supernova explosions, plays an important role in setting the sizes of disc galaxies (Cole et al., 2000). The strength of SNe feedback is quantified in the model by the parameter (for details see Cole et al., 2000): , where and are parameters and is the rotation speed of the disc at the half mass radius. The mass of cold gas which is reheated is given by , where is the star formation rate. In the Baugh et al. model, the values adopted for these parameters are: and . We show the impact of reducing (by setting ) and increasing (by setting ) the strength of supernova feedback in Figs. 12, 13 and 14-(c)-(d). Cole et al. demonstrated that increasing the strength of supernova feedback results in gas cooling to form stars in larger haloes, which leads to larger discs. Conversely, reducing the feedback allows gas to cool and form stars in smaller haloes resulting in smaller discs. These trends are reproduced in Figs. 13(c) and (d). There is little change in velocity dispersion on changing the strength of the supernova feedback. The shift in the zero-point of the radius-luminosity relation produces a change in the location of the fundamental plane (see Fig. 14-(c)-(d)).
In the fiducial GALFORM model, spheroids are the end products of galaxy mergers. As we explained in § 2, the radius of the merger remnant is determined by conserving the binding energy of the individual galaxies involved in the merger and their relative orbital energy. The contribution of the orbital energy to the energy budget is parameterized by : the standard choice is to set and to include the full orbital energy in the calculation of the remnant size. In Figs. 12, 13 and 14-(e), we show the effect of removing the contribution of the orbital energy from the calculation of the radius of the spheroid produced by mergers, i.e. we set . Perhaps surprisingly, this change results in an imperceptibly small change in the radius of the spheroid, except in the case of the brightest galaxies.
Finally, we consider the model of Bower et al. (2006), who implemented an AGN feedback scheme into GALFORM, in which cooling flows are quenched in massive haloes at low redshift. As a result of this change to the cooling model in GALFORM, Bower et al. (2006) were able to produce improved matches to the local B and K-band luminosity functions, the observed bimodality of colour distribution and the inferred evolution of the stellar mass function. In Figs. 12, 13 and 14-(f) we plot the scaling relations for Bower et al. (2006) model. Though the model performs quite well in reproducing the local fundamental plane of early-type galaxies and the Faber-Jackson relation, the radius-luminosity relation for bright galaxies is substantially different from both the observations and from the predictions of the Baugh et al. (2005) model: luminous galaxies in the Bower et al. model are up a factor of three smaller in radius than in the Baugh et al. model.
We also considered a variant of the Baugh et al. model in which the Kennicutt IMF was used in starbursts, in place of the top-heavy IMF. This produces scaling relations for early type galaxies which look very similar to those presented for the Bower et al. model in Figs 12 13, and 14, with the main change being a shift in the predicted radius-luminosity relation. When the IMF is changed, the yield and recycled gas fraction are also changed accordingly, which affect the rate at which gas cools and alter the star formation timescale. This suggests that the primary difference in the predictions of the Baugh et al. and Bower et al. models is due to the choice of the IMF used in starbursts, in spite of the other differences between the models outlined in Section 2.
The results in this section suggest that the scaling relations of early-type galaxies are essentially insensitive to variations in some of the model parameters. However, this should not be interpreted as implying that these observations are of limited value in constraining the models. It should be remembered that our starting point is a model of galaxy formation which has already successfully passed a range of comparisons with observed galaxy properties.
6 The evolution of scaling relations
We now present the GALFORM predictions for the evolution of the structural and photometric properties of early-type galaxies with redshift. In this section, we consider the evolution over a much wider baseline in redshift than we addressed in the previous section. Furthermore, in order to get a clear picture of the nature of the evolution, we relax some of the selection criteria which we applied to the model output in previous sections, where the goal was to mimic the Ber05 sample selection as closely as possible. The only selection we apply in this section is that the bulge must account for at least 80% of the total luminosity in the rest-frame -band.
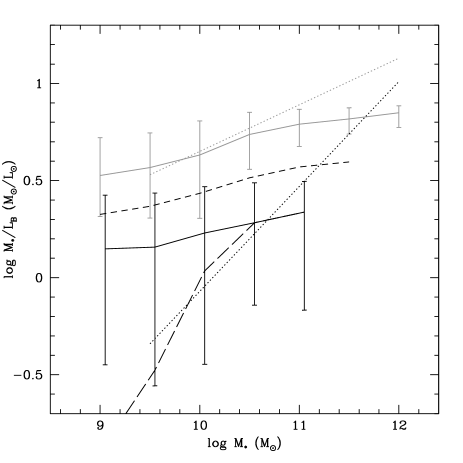
It is important to be able to disentangle changes in the typical stellar populations of early-type galaxies with redshift from evolution in their structural properties. Hence, we first examine the predicted evolution in the mass-to-light ratio of early-type galaxies in Fig. 15. The stellar populations of early-type galaxies at in GALFORM have lower mass-to-light ratios by a factor of compared with the early-types at . This result is in agreement with the change in mass-to-light ratio inferred from observations by van de Ven et al. (2003), (see also van Dokkum et al., 2006; van de Wel et al., 2005; Treu et al., 2005). We find a weak dependence of mass-to-light ratio on total stellar mass. However this is somewhat lower than what is seen observationally (see Wuyts et al., 2004; van de Wel et al., 2005). Note that when we restrict our attention to bright galaxies (i.e. those with ), the prediction for the median mass-to-light ratio steepens considerably, bringing the model predictions into much better agreement with the observational estimates.
The evolution with redshift of the Faber-Jackson relation is shown in Fig. 16. We show the correlation between velocity dispersion and the -band magnitude in the rest-frame for the local universe (), and .
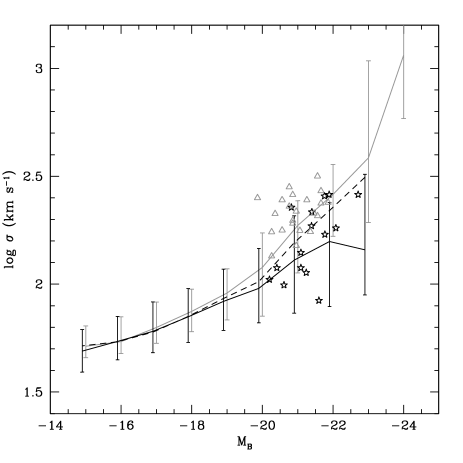
Fig. 16 shows that the model predicts differential evolution in velocity dispersion with rest-frame luminosity; at brighter luminosities, the velocity dispersion drops by up to a factor of between and , whereas for fainter luminosities, the change in velocity dispersion is much more modest. These results are similar to the ones found in observational studies (cf. di Serego Alighieri et al., 2005; Reda et al., 2006). We note that the scatter around the FJ relation seems to increase slightly with redshift. Furthermore, it is clear that the slope of the relation for faint early-type galaxies is shallower than that of the bright-end, which resembles the results for faint galaxies found by some authors (e.g. Matković et al., 2006; Davies et al., 1983).
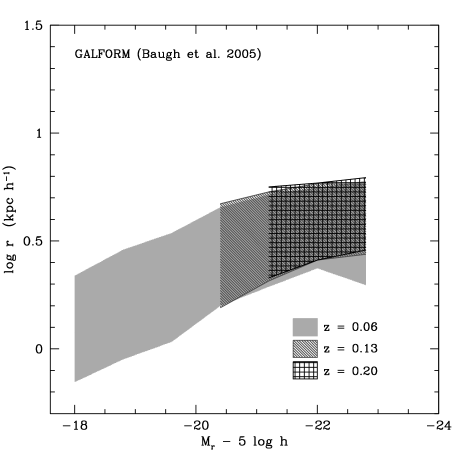
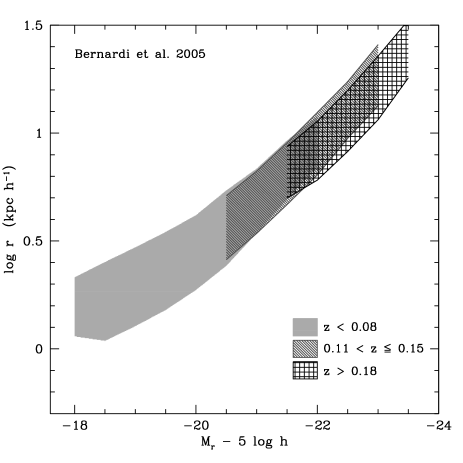
Fig. 17 shows how the relation between radius and luminosity varies with redshift. As we saw in Section 4, the model predicts that the brightest early-types are too small. Nevertheless, it is interesting to look at the predictions at different redshifts.
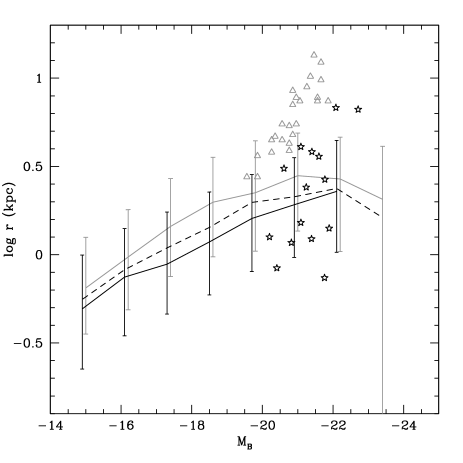
The primary agent behind the shift in the predictions is the passive evolution of the stellar populations in the elliptical galaxies. Also, at a fixed stellar mass, the galaxy radii decrease with redshift (Coenda et al 2007; in preparation). As redshift increases, we see the bulk of the stars in ellipticals when they were younger and hence brighter. There is no significant trend in the size of the scatter in this relation with redshift.
Trujillo et al. (2004b) estimated the evolution of the radius-luminosity relation of bright galaxies up to (see also Bouwens et al., 2004). These authors found that early-type galaxies, as defined by a high value of Sérsic index, show a size evolution proportional to ; this is comparable to the amount of evolution we predict in Fig. 17 for all ellipticals.
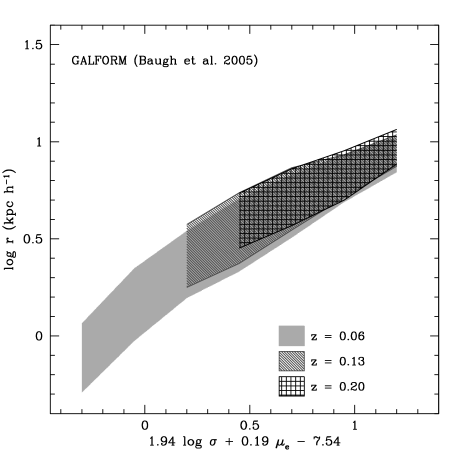
The evolution of the fundamental plane has long been used to study changes in the stellar populations of galaxies (e.g. van Dokkum & Franx, 1996; van Dokkum et al., 2001; Gebhardt et al., 2003; van de Wel et al., 2006). As previously noted, Bernardi et al. (2003c) found evolution in the fundamental plane which is consistent with the passive aging of the stellar population, , but without any noticeable difference in the slope. There is a general consensus in the literature regarding the nature of the evolution of the fundamental plane (Gebhardt et al., 2003; Ziegler et al., 2005; Jørgensen et al., 2006). However, as we have shown in the previous section, deviations from the fundamental plane relation are linked to several galaxy properties.
In Fig. 18, we plot the model predictions in the Jørgensen et al. (2006) projection of the fundamental plane, , for galaxies with . In this projection, we find no evolution in the slope or offset of the fundamental plane up to , for galaxies with , which is contrary to the claims made from observations. As we noted in Fig. 11(a), the evolution found in observational studies might be partly due to the correlation between the magnitude and the deviation from fundamental plane, i.e. magnitude-limiting samples might induce the zero-point of the FP to shift. On the other hand, the effective radius of bright early-type galaxies in GALFORM is smaller than observed (see Fig. 6), and evolves with redshift, which will complicate any inferences drawn from the evolution of the FP. Interestingly, in the small radius regime, the evolution of our predicted fundamental plane shows an offset similar to that observed.
7 Discussion and conclusions
We presented tests of the model proposed by Cole et al. (2000) to calculate the scale sizes of the disc and bulge components of galaxies. This is currently the most sophisticated model in use in semi-analytical codes to compute the radii of galaxies. In brief, the model assumes that galactic discs have an exponential profile and that spheroids follow an law in projection. The hot gas atmosphere in dark matter haloes is assumed to have the same specific angular momentum as the dark matter. Gas is assumed to retain its angular momentum as it cools to form a galactic disc. The size of a merger remnant is computed by conserving the sum of the binding and orbital energies of the merging galaxies and applying the virial theorem. The self-gravity of the baryons and their impact on the distribution of dark matter in the central parts of the halo are taken into account. Cole et al. demonstrated that this model predicts scale length distributions for galactic discs which are in excellent agreement with observations.
In this paper, we have carried out the first tests of the model predictions for the structural properties of early-type galaxies and the evolution of these relations with redshift, using the published models of Baugh et al. (2005) and Bower et al. (2006). The Baugh et al. and Bower et al. models differ in a number of ways, as set out in Section 2. Two of the main differences are the manner in which the models prevent the overproduction of bright galaxies and in the IMF assumed in starbursts. Bower et al. use AGN heating to switch off the cooling-flow in haloes with a quasistatic hot gas atmosphere, whereas Baugh et al. invoke a superwind which ejects gas that has already cooled. Perhaps controversially, Baugh et al. adopt a flat IMF in starbursts, and a standard solar neighbourhood IMF for quiescent star formation; in Bower et al., a standard IMF is assumed in all modes of star formation. We emphasize that, for the majority of the results presented, we have not adjusted any of the model parameters in order to improve the predictions for the fundamental plane and its projections. The one exception is where we exploit the modular nature of semi-analytical models to vary or switch off various physical ingredients of the model in order to assess their influence on the model predictions (Section 5.2).
The model enjoys some notable successes. We demonstrated that the model can match the abundance of early-type galaxies in the SDSS sample of Ber05. We also obtain a reasonable match to the Faber-Jackson relation between velocity dispersion and luminosity and its evolution with redshift, albeit with a shallower slope than measured by Ber05. Furthermore, we find a relation between velocity dispersion and age which is in excellent agreement with recent observations. Perhaps most impressively, the fundamental plane predicted by the model is in good agreement with that inferred for SDSS early-types by Bernardi et al. (2003c). The deviation from the FP relation reveals a strong correlation with luminosity, age, colour, stellar mass and metallicity: galaxies that lie above the mean fundamental plane relation are more luminous, younger, bluer, less massive and metal-poor. Furthermore, the feedback processes and clustering, as given by the pseudo-specific angular momentum of the bulge and the halo mass respectively, seem to play a role in defining the plane.
Nevertheless, despite these achievements, there are some model predictions which disagree with the observations. Formally, the slope of the predicted Faber-Jackson relation is at odds with that measured by Ber05, although the overlap between the model galaxies and observations in this projection remains impressive. However, perhaps the most striking discrepancy is the slope of the radius-luminosity relation; the model predicts a significantly flatter radius luminosity relation than is observed. Whereas the model predictions for the effective radii of faint spheroids are in good agreement with the data, the brightest galaxies are up to a factor of three smaller in the model. Our results suggest that, in the model, the brightest spheroids have less specific pseudo-angular momentum (i.e. , this is a definition of convenience; see Section 2.2) than is the case for observed galaxies. This could be due to the model underpredicting the galaxy mass for a given luminosity. Somewhat surprisingly, the predicted slope of the radius-luminosity relation is in much better agreement with the observations if the adiabatic contraction of the halo is switched off (although, in this case, the model galaxies are uniformly too large without adjusting other parameters). The adiabatic contraction of the halo in response to the presence of condensed baryons has been tested against numerical simulations (e.g. Jesseit et al., 2002; Sellwood & McGaugh, 2005; Choi et al., 2006). Our prescription for computing the size of merger remnants could become inaccurate if there is a significant fraction of mass in the form of cold gas.
The other significant discrepancy is the evolution with redshift of the zero-point of the fundamental plane. The model predicts no evolution in the zero-point of the fundamental plane. This is at odds with the evolution inferred observationally, which is consistent with the shift in the mass-to-light ratio expected for a passively evolving stellar population. This discrepancy is intriguing, as the model does predict a decline in the mass-to-light ratio of early-types with increasing redshift of the magnitude expected for passive evolution. The lack of evolution in the predicted fundamental plane therefore points to a compensating change in one of the other projections; the effective radii of galaxies also evolve with redshift in the model. This serves as a cautionary note to observational studies which interpret a shift in the fundamental plane in terms of a corresponding change in the typical mass to light ratio. The correlation between luminosity and the deviation from the fundamental plane shows that part of the evolution found by observational studies may in fact be due to the construction of magnitude limited samples.
In summary, the prescription outlined by Cole et al. for computing the radii of discs and bulges enjoys many successes, but displays a few important disagreements with observations. The solution of these remaining problems will require enhancement of the model to compute galaxy sizes, guided by the results of numerical simulations of the growth of disc galaxies and galaxy mergers (e.g. Okamoto et al., 2005; Robertson et al., 2006).
ACKNOWLEDGEMENTS
CA gratefully acknowledges a scholarship from the FCT, Portugal. CMB is supported by the Royal Society. This research was partly supported by PPARC. We thank Andrew Benson and Richard Bower for allowing us to use results generated with the new version of the GALFORM code. We are grateful to Mariangela Bernardi for providing the observational data presented in this paper. We thank Pieter van Dokkum, Alister Graham and the referee for valuable suggestions.
Funding for the SDSS and SDSS-II has been provided by the Alfred P. Sloan Foundation, the Participating Institutions, the National Science Foundation, the U.S. Department of Energy, the National Aeronautics and Space Administration, the Japanese Monbukagakusho, the Max Planck Society and the Higher Education Funding Council for England. The SDSS Web Site is http://www.sdss.org/.
The SDSS is managed by the Astrophysical Research Consortium for the Participating Institutions. The Participating Institutions are the American Museum of Natural History, Astrophysical Institute Potsdam, University of Basel, Cambridge University, Case Western Reserve University, University of Chicago, Drexel University, Fermilab, the Institute for Advanced Study, the Japan Participation Group, Johns Hopkins University, the Joint Institute for Nuclear Astrophysics, the Kavli Institute for Particle Astrophysics and Cosmology, the Korean Scientist Group, the Chinese Academy of Sciences (LAMOST), Los Alamos National Laboratory, the Max-Planck-Institute for Astronomy (MPA), the Max-Planck-Institute for Astrophysics (MPIA), New Mexico State University, Ohio State University, University of Pittsburgh, University of Portsmouth, Princeton University, the United States Naval Observatory and the University of Washington.
References
- Adelberger et al. (2003) Adelberger K.L., Steidel C.C., Shapley A.E., Pettini M., 2003, ApJ, 584, 45
- Barnes & White (1984) Barnes J., White S.D.M., 1984, MNRAS, 211, 753
- Baugh (2006) Baugh C.M., 2006, Rep. Prog. Phys., 69, 3101
- Baugh et al. (2005) Baugh C.M., Lacey C.G., Frenk C.S., Granato G.L., Silva L., Bressan A., Benson A.J., Cole S., 2005, MNRAS, 356, 1191
- Baugh et al. (1996) Baugh C.M., Cole S., Frenk C.S., 1996, MNRAS, 283, 1361
- Bender et al. (1992) Bender R., Burstein D., Faber S.M., 1992, ApJ, 399, 462
- Benson et al. (2003) Benson A.J., Bower R.G., Frenk C.S., Lacey C.G., Baugh C.M., Cole S., 2003, ApJ, 599, 38
- Benson et al. (2002) Benson A.J., Lacey C.G., Baugh C.M., Cole S., Frenk C.S., 2002, MNRAS, 333, 156
- Bernardi et al. (2005) Bernardi M., Sheth R.K., Nichol R.C., Schneider D.P., Brinkmann J., 2005, AJ, 129, 61
- Bernardi et al. (2003a) Bernardi M., Sheth R.K., Annis J., et al., 2003a, AJ, 185, 1817
- Bernardi et al. (2003b) Bernardi M., Sheth R.K., Annis J., et al., 2003b, AJ, 185, 1849
- Bernardi et al. (2003c) Bernardi M., Sheth R.K., Annis J., et al., 2003c, AJ, 185, 1866
- Bernardi et al. (2003d) Bernardi M., Sheth R.K., Annis J., et al., 2003d, AJ, 185, 1882
- Bertin et al. (2002) Bertin G., Ciotti L., Del Principe M., 2002, A&A, 386, 149
- Blumenthal et al. (1986) Blumenthal G.R., Faber S.M., Flores R., Primack J.R., 1986, ApJ, 301, 27
- Bournaud et al. (2005) Bournaud F., Jog C. J., Combes F., 2005, A&A, 437, 69
- Bouwens et al. (2004) Bouwens R.J., Illingworth G.D., Blakeslee J.P., Broadhurst T.J., Franx M., 2004, ApJL, 611, 1
- Bower et al. (2006) Bower R.G., Benson A.J., Malbon R., Helly J.C., Frenk C.S., Baugh C.M., Cole S., Lacey C.G., 2006, MNRAS, 370, 645
- Boylan-Kolchin et al. (2006) Boylan-Kolchin M., Ma C., Quataert E., 2006, MNRAS, 369, 1081
- Ciotti et al. (1996) Ciotti L., Lanzoni B., Renzini A., 1996, MNRAS, 282, 1
- Choi et al. (2006) Choi J., Lu Y., Mo H.J., Weinberg M.D., 2006, astro-ph/0604587
- Cole et al. (2000) Cole S., Lacey C.G., Baugh C.M., Frenk C.S., 2000, MNRAS, 319, 168
- Cole et al. (1994) Cole S., Aragón-Salamanca A., Frenk C.S., Navarro J.F., Zepf S.E., 1994, MNRAS, 271, 781
- Connolly & Szalay (1999) Connolly A.J., Szalay A.S., 1999, ApJ, 117, 2052
- Davies et al. (1983) Davies R.L., Efstathiou G., Fall S.M., Illingworth G., Schechter P.L., 1983, ApJ, 266, 41
- De Jong & Lacey (2000) De Jong R.S., Lacey C.G., 2000, ApJ, 545, 781
- De Lucia et al. (2006) De Lucia G., Springel V., White S.D.M., Croton D., Kauffmann G., 2006, MNRAS, 366, 499
- De Lucia & Blaizot (2006) De Lucia G., Blaizot J., 2006, MNRAS, in press (astro-ph/0606519)
- Dekel & Cox (2006) Dekel A., Cox T.J., 2006, MNRAS, 370, 1445
- di Serego Alighieri et al. (2005) di Serego Alighieri S., et al., 2005, A&A, 442, 125
- Djorgovski & Davis (1987) Djorgovski S., Davis M., 1987, ApJ, 313, 59
- Dressler et al. (1987) Dressler A., Lynden-Bell D., Burstein D., Davies R.L., Faber S.M., Terlevich R.J., Jackson R., 1987, ApJ, 313, 42
- Faber & Jackson (1976) Faber S.M., Jackson R., 1976, ApJ, 204, 668
- Forbes & Ponman (1999) Forbes D.A., Ponman T.J., 1999, MNRAS, 309, 623
- Forbes et al. (1998) Forbes D.A., Ponman T.J., Brown R.J.N., 1998, ApJ, 508, L43
- Frenk et al. (1988) Frenk C.S., White S.D.M., Davis M., Efstathiou G., 1988, ApJ, 327, 507
- Gebhardt et al. (2003) Gebhardt K., et al., 2003, ApJ, 597, 239
- Graham et al. (2005) Graham A. W., Driver S. P., Petrosian V., Conselice C. J., Bershady M. A., Crawford S. M., Goto T., 2005, AJ, 130, 1535
- Hatton et al. (2003) Hatton S., Devriendt J.E.G., Ninin S., Bouchet F.R., Guiderdoni B., Vibert D., 2003, MNRAS, 343, 75
- Helly et al. (2003) Helly J.C., Cole S., Frenk C.S., Baugh C.M., Benson A.J., Lacey C.G., 2003, MNRAS, 338, 903
- Holden et al. (2005) Holden B.P., et al., 2005, ApJ, 626, 809
- Jesseit et al. (2002) Jesseit R., Naab T., Burkert A., 2002, ApJ, 571, L89
- Jørgensen et al. (2006) Jørgensen I., Chiboucas K., Flint K., Bergmann M., Barr J., Davies R., 2006, ApJ, 639, L9
- Jørgensen et al. (1996) Jørgensen I., Franx M., Kjærgaard P., 1996, MNRAS, 280, 167
- Kauffmann (1996) Kauffmann G., 1996, MNRAS, 281, 487
- Kobayashi (2005) Kobayashi C., 2005, MNRAS, 361, 1216
- Kormendy (1977) Kormendy J., 1977, ApJ, 218, 333
- Lemson et al. (2006) Lemson G., Virgo Consortium, 2006, astro-ph/0608019
- Matković et al. (2006) Matković A., Guzmán R., 2005, MNRAS, 362, 289
- Malbon et al. (2006) Malbon R.K., Baugh C.M., Frenk C.S., Lacey C.G., 2006, MNRAS, submitted, astro-ph/0607424
- Nagashima et al. (2005b) Nagashima M., Lacey C.G., Okamoto T., Baugh C.M., Frenk C.S., Cole S., 2005b, MNRAS, 363, 31
- Nagashima et al. (2005a) Nagashima M., Lacey C.G., Baugh C.M., Frenk C.S., Cole S., 2005a, MNRAS, 358, 1247
- Navarro, Frenk, & White (1997) Navarro J., Frenk C., White S., 1997, ApJ, 490, 493
- Nelan et al. (2005) Nelan J.E., Smith R.S., Hudson M.J., Wegner G.A., Lucey J.R., Moore S.A.W., Quinney S.J., Suntzeff N.B., 2005, ApJ, 632, 137
- Okamoto et al. (2005) Okamoto T., Eke V.R., Frenk C.S., Jenkins A., 2005, MNRAS, 363, 1299
- Pahre et al. (1999) Pahre M.A., Djorgovski S.G., de Carvalho R.R., 1999, ASPC, 163, 283
- Pahre et al. (1998) Pahre M.A., Djorgovski S.G., de Carvalho R.R., 1998, ApJ, 116, 1591
- Pettini et al. (2001) Pettini M., Shapley A.E., Steidel C.C., et al., 2001, ApJ, 554, 981
- Reda et al. (2006) Reda F.M., Forbes D.A., Hau G.K.T., 2006, MNRAS, 360, 693
- Robertson et al. (2006) Robertson B., Cox T.J., Hernquist L., Franx M., Hopkins P.F., Martini P., Springel V., 2006, ApJ, 641, 21
- Sánchez et al. (2006) Sánchez A.G., Baugh C.M., Percival W.J., Peacock J.A., Padilla N.D. Cole S., Frenk C.S., Norberg P., 2006, MNRAS, 366, 189
- Sandage & Perelmuter (1990) Sandage A., Perelmuter J., 1990, ApJ, 361, 1
- Sandage & Visvanathan (1978a) Sandage A., Visvanathan N., 1978a, ApJ, 223, 707
- Sandage & Visvanathan (1978b) Sandage A., Visvanathan N., 1978b, ApJ, 225, 742
- Schade et al. (1997) Schade D., Barrientos L.F., López-Cruz O., 1997, ApJ, 477, L17
- Sellwood & McGaugh (2005) Sellwood J.A., McGaugh S.S., 2005, ApJ, 634, 70
- Springel et al. (2005) Springel V., et al., 2005, Nature, 435, 629
- Treu et al. (2005) Treu T., Ellis R.S., Liao T.X., van Dokkum P.G., Tozzi P., Coil A., Newman J., Cooper M., Davis M., 2005, ApJ, 633, 174
- Trujillo et al. (2004a) Trujillo I., Burkert A., Bell E.F., 2004a, ApJL, 600, L39
- Trujillo et al. (2004b) Trujillo I., et al., 2004b, ApJ, 604, 521
- Tully & Fisher (1977) Tully R.B., Fisher J.R., 1977, A&A, 54, 661
- van de Ven et al. (2003) van de Ven G., van Dokkum P.G., Franx M., 2003, MNRAS, 344, 924
- van de Wel et al. (2006) van de Wel A., Franx M., van Dokkum P.G., Huang J., Rix H.-W., Illingworth G. D., 2006, ApJ, 636, L21
- van de Wel et al. (2005) van de Wel A., Franx M., van Dokkum P. G., Rix H.-W., Illingworth G. D., Rosati P., 2005, ApJ, 631, 145
- van Dokkum et al. (2006) van Dokkum P.G., van der Marel R.P., 2006, ApJ, accepted, astroph/0608587
- van Dokkum et al. (2001) van Dokkum P.G., Franx M., Kelson D.D., Illingworth G.D., 2001, ApJ, 553, L39
- van Dokkum & Franx (1996) van Dokkum P.G., Franx M., 1996, MNRAS, 281, 985
- Wilman et al. (2005) Wilman R.J., Gerssen J., Bower R.G., Morris S.L., Bacon R., de Zeeuw P.T., Davies R.L., 2005, Nature, 436, 227
- Wuyts et al. (2004) Wuyts S., van Dokkum P.G., Kelson D.D., Franx M., Illingworth G.D., 2004, ApJ, 605, 677
- Ziegler et al. (2005) Ziegler B., Thomas D., Böhm A., Bender R., Fritz A., Maraston C., 2005, A&A, 433, 519