A torque reversal of 4U 1907+09
Abstract
Aims. We present an analysis of the accreting X-ray pulsar system 4U 1907+09 based on INTEGRAL data. The main focus of this analysis is a study of the timing behavior of this source. In addition we also show an analysis of the 5–90 keV spectrum.
Methods. The data were extracted using the official INTEGRAL software OSA 5.1. Timing analysis was performed using epoch folding and pulsar pulse phasing.
Results. We have measured 12 individual pulse periods for the years 2003 to 2005. We confirm earlier RXTE results that during 2003 the spin down became slower and show furthermore that after this phase 4U 1907+09 started to spin up with in 2004. The similarity of the pulse period histories of 4U 1907+09 and 4U 162626 suggests that accretion onto an oblique rotator, as recently proposed by Perna et al., is a possible explanation for this change.
Key Words.:
stars: individual (4U 1907+09) – X-rays: binaries – stars: neutron – Accretion, accretion disks1 Introduction
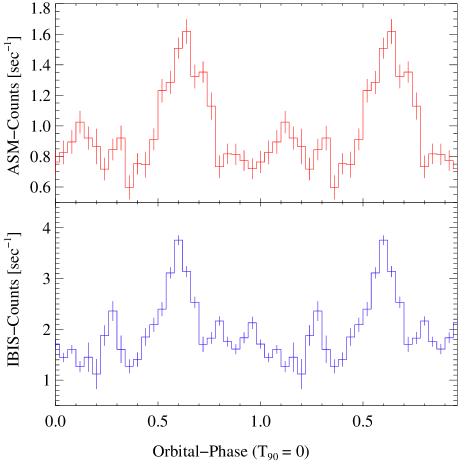
The wind-accreting High Mass X-ray Binary system 4U 1907+09 (Giacconi et al., 1971) consists of a neutron star in an eccentric () 8.3753 d orbit (in ’t Zand et al., 1998) around its companion, which has been identified optically with a highly reddened mag star (Schwartz et al., 1980). Using interstellar atomic lines of Na i and K i, Cox et al. (2005) set a lower limit of 5 kpc for the distance. According to this value a lower limit of the X-ray luminosity above 1 keV is given by (in ’t Zand et al., 1997). Cox et al. (2005) also confirm earlier suggestions (Schwartz et al., 1980; Marshall & Ricketts, 1980; van Kerkwijk et al., 1989) that the stellar companion is a O8–O9 Ia supergiant with an effective temperature of 30500 K, a radius of 26 , a luminosity of , and a mass loss rate of . Note that the presence of X-ray flaring seen twice per neutron star orbit (Marshall & Ricketts, 1980, see also Fig. 1) had led some authors (e.g., Makishima et al., 1984; Iye, 1986; Cook & Page, 1987) to the suggestion of a Be star companion, however, this classification would require a distance of 1.5 kpc, which is in contradiction to the significant interstellar extinction measured in optical observations (van Kerkwijk et al., 1989).
Similar to other accreting neutron stars, the X-ray continuum of 4U 1907+09 can be described by a power-law spectrum with an exponential turnover at 13 keV (Mihara, 1995; in ’t Zand et al., 1997; Cusumano et al., 1998). The spectrum is modified by strong photoelectric absorption with a column – (Schwartz et al., 1980; Marshall & Ricketts, 1980; Makishima et al., 1984; Cook & Page, 1987; Chitnis et al., 1993; Cusumano et al., 1998). As the absorbing material is situated in the dense stellar wind, is strongly variable over the orbit. The column is maximal between the end of the primary X-ray flare and the start of the secondary flare (Fig. 1) of the orbital light curve (Roberts et al., 2001). Fluorescence in the absorbing material gives rise to an Fe K line at 6.4 keV with an equivalent width of 60 eV (Cusumano et al., 1998). At higher energies, the spectrum exhibits cyclotron resonant scattering features (CRSF) at 19 keV and 40 keV (Makishima et al., 1992; Mihara, 1995; Cusumano et al., 1998).
With a pulse period of s, 4U 1907+09 is a slowly rotating neutron star. Since the discovery of the pulsations by Makishima et al. (1984) the neutron star has exhibited a steady linear spin down with an average of from s in 1983 to 440.76 s in 1998 (in ’t Zand et al., 1998). Recently, Baykal et al. (2005) reported a decrease in , which in 2002 was and therefore 0.5 times the long term value.
In this paper we report on an analysis of INTEGRAL observations of 4U 1907+09 performed since 2003. In Sect. 2 we describe the INTEGRAL data reduction, followed by a discussion of the broad-band X-ray spectrum of the source (Sect. 3). We then present the results of the long term X-ray timing analysis (Sect. 4.1), showing that the source underwent a torque reversal towards a spin up (Sect. 4.2). We summarize and discuss our results in Sect. 5.
2 Observation and data reduction
In this paper we present the analysis of INTEGRAL observations of 4U 1907+09. The International Gamma-Ray Astrophysics Laboratory (INTEGRAL; Winkler et al. 2003) was launched in October 2002. The two main instruments IBIS (15 keV–10 MeV; Ubertini et al. 2003) and SPI (20 keV–8 MeV; Vedrenne et al. 2003) are supplemented in the X-rays by an auxiliary instrument with a smaller field of view, the X-ray monitor JEM-X (3 keV–35 keV; Lund et al. 2003). For our analysis we used data from IBIS and JEM-X.
The Imager on Board the INTEGRAL Satellite (IBIS) is a coded mask telescope with a fully coded field of view (FCFOV) of and full width at half maximum (FWHM) angular resolution (Ubertini et al., 2003; Brandt et al., 2003). Here, we used data from its upper layer, the INTEGRAL Soft Gamma-Ray Imager (ISGRI), which covers an energy range from 15 keV–1 MeV with an energy resolution of 8% at 60 keV (Lebrun et al., 2003; Gros et al., 2003). 4U 1907+09 is detected below 90 keV. The Joint European X-ray Monitor (JEM-X) consists of two identical coded mask instruments with a FCFOV of diameter and angular resolution (FWHM), each (Lund et al., 2003). Due to erosion of the microstrip anodes inside the JEM-X detectors which leads to a loss in sensitivity, only one of the two JEM-X detectors is operating at any given time while the other is switched off.
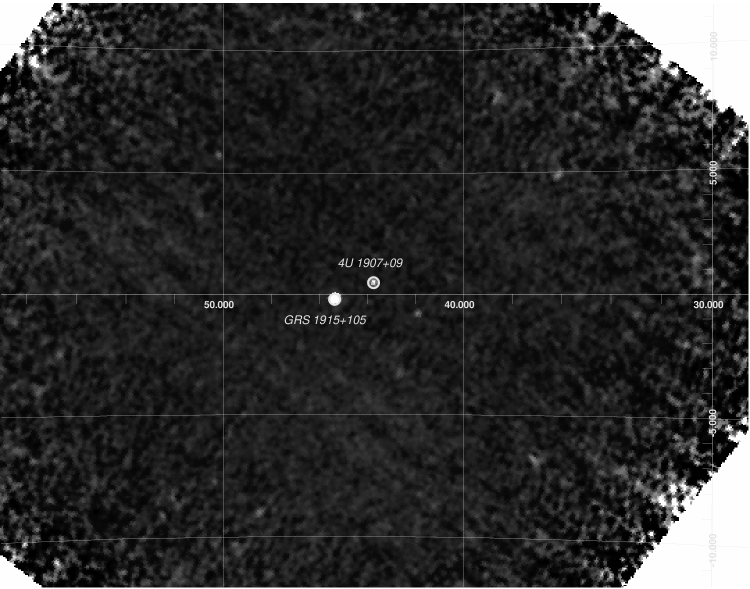
For our analysis we took into account all public data up to INTEGRAL orbit (revolution) 250 as well as data from the INTEGRAL Galactic Plane Scans (GPS) and the Galactic Central Radian Deep Exposure (GCDE). In addition we also used private data from a monitoring campaign on the Galactic microquasar GRS 1915+105 (PI J. Rodriguez). To avoid systematic effects that start to become important for larger off-axis angles, we constrained the maximum off-axis angle between the satellite’s optical axis and 4U 1907+09 to for IBIS and for JEM-X according to the respective FCFOVs of the instruments. In total, the analyzed data are spread over almost three years with a total on source time of 2280 ksec for IBIS. The log of the observations is given in Table 2. We used the Off-line Scientific Analysis Software, OSA 5.1, in our analysis. In the analysis of the coded mask data we also took into account the presence of GRS~1915+105, 4U 1901+03, 4U 1909+07, and IGR~J19140+0951, by forcing the OSA to consider 4U 1907+09 and these four sources.
Background subtracted light curves were obtained using ii_light, a tool distributed with the OSA to generate high resolution light curves. While the standard OSA tools build lightcurves by deconvolving shadowgrams for each requested energy band and time bin to obtain the light curves, which is only possible if the signal to noise ratio in the shadowgram is high, ii_light uses the Pixel Illuminated Fraction (PIF) to create light curves. For 4U 1907+09, this approach allows us to extract light curves with a resolution of 1 s. The count rates found by ii_light show no systematic difference between the single pointings. Tests based on observations of the Crab nebula and pulsar (Kreykenbohm et al., 2006) and the fact that the count rates of 4U 1907+09 are not affected by the very variable flux of the nearby source GRS 1915+105 (Fig. 2) confirm the stability of our extraction method. The light curves were barycentered and corrected for the orbital motion of the neutron star using the ephemeris of in ’t Zand et al. (1998), as given in Table 1. Orbital phase 0 is at .
| Parameter | Value |
|---|---|
| MJD 50134.76 | |
| 8.3753 d | |
| 83 lt-s | |
| Eccentricity | 0.28 |
| Observation | Revolution | Date | On Source Time (IBIS) | Mean Count Rate | |
|---|---|---|---|---|---|
| MJD | ksec | cps in 20–40 keV | |||
| 1 | 48 | 52704.1–52705.4 | 100.61 | 0.78–0.93 | 1.260.10 |
| 2 | 57 | 52731.1–52732.3 | 72.12 | 0.00–0.14 | 2.440.13 |
| 3 | 59 | 52738.3–52739.6 | 107.13 | 0.86–0.02 | 1.660.11 |
| 4 | 62 | 52746.7–52747.9 | 72.78 | 0.86–0.01 | 2.760.13 |
| 5 | 67 | 52762.9–52763.4 | 33.48 | 0.80–0.86 | 2.120.19 |
| 6 | 68 | 52764.6–52766.5 | 61.66 | 0.00–0.22 | 1.920.14 |
| 7 | 69 | 52767.8–52769.5 | 107.41 | 0.38–0.59 | 1.660.11 |
| 8 | 70 | 52771.2–52771.7 | 32.71 | 0.79–0.85 | 1.870.19 |
| 9 | 135 | 52965.7–52966.9 | 104.37 | 0.01–0.16 | 1.500.12 |
| 10 | 172 | 53075.9–53076.2 | 23.03 | 0.17–0.21 | 1.390.23 |
| 11 | 174 | 53082.6–53083.0 | 23.09 | 0.97–0.01 | 2.260.24 |
| 12 | 176 | 53089.1–53089.6 | 30.83 | 0.74–0.81 | 1.070.20 |
| 13 | 177 | 53091.0–53092.0 | 51.80 | 0.97–0.09 | 1.300.15 |
| 14 | 186 | 53117.0–53117.7 | 37.18 | 0.07–0.16 | 2.370.18 |
| 15 | 187 | 53120.7–53122.0 | 65.47 | 0.52–0.67 | 3.700.14 |
| 16 | 188 | 53123.2–53125.4 | 75.72 | 0.82–0.08 | 2.550.13 |
| 17 | 189 | 53126.3–53128.5 | 62.89 | 0.19–0.45 | 1.460.14 |
| 18 | 193 | 53138.1–53140.5 | 185.49 | 0.60–0.88 | 3.600.09 |
| 19 | 231 | 53253.4–53254.0 | 33.69 | 0.36–0.43 | 1.320.19 |
| 20 | 242 | 53285.4–53285.6 | 19.16 | 0.18–0.21 | 2.020.26 |
| 21 | 243 | 53288.9–53289.2 | 21.24 | 0.60–0.64 | 2.270.24 |
| 22 | 246 | 53296.4–53297.6 | 100.89 | 0.49–0.64 | 2.790.11 |
| 23 | 248 | 53303.9–53305.0 | 144.48 | 0.27–0.52 | 1.780.09 |
| 24 | 249 | 53305.7–53308.0 | 141.95 | 0.61–0.87 | 1.540.09 |
| 25 | 250 | 53309.1–53311.0 | 100.83 | 0.02–0.23 | 0.970.12 |
| 26 | 255 | 53324.3–53325.5 | 98.74 | 0.82–0.97 | 1.600.11 |
| 27 | 295 | 53443.0–53444.1 | 99.40 | 0.99–0.14 | 1.370.11 |
| 28 | 305 | 53472.9–53474.1 | 106.13 | 0.57–0.72 | 3.110.11 |
| 29 | 315 | 53503.6–53504.8 | 72.15 | 0.24–0.37 | 1.880.17 |
| 30 | 361 | 53640.4–53641.6 | 91.67 | 0.57–0.71 | 3.160.11 |
3 Spectral Analysis
For the spectral analysis we applied systematic errors of 1% and 5% for IBIS and JEM-X2, respectively, and used data taken in the energy ranges 18–90 keV and 5–20 keV. Because of the switch over from JEM-X2 to JEM-X1 after revolution 171, we only used data taken before that revolution to avoid cross-calibration uncertainties between the two JEM-X detectors. This resulted in a total exposure time of 200 ksec for JEM-X2. For ISGRI we used all public data up to revolution 250 resulting in an exposure time of 1258 ksec. We modeled the spectrum using an absorbed power-law, which is modified by the Fermi-Dirac cutoff (Tanaka, 1986):
| (1) |
This continuum model alone could not describe the data adequately (, see Tab. 3), as strong absorption line like features at 19 keV and 40 keV remain (Fig. 3). These features have been identified as cyclotron resonant scattering features (CRSFs) by Makishima et al. (1992) and have also been reported by Mihara (1995) and Cusumano et al. (1998). The addition of a line at 36.0 keV with a width of 3.7 keV (Table 3) with a Gaussian optical depth profile (for definition, see Coburn et al., 2002) to the baseline continuum model results in a improved fit ( for 47 degrees of freedom). The -test probability that this improvement is achieved just by chance is (see, however, Protassov et al. 2002). Modeling both features with Gaussians at 39.8 keV and 18.9 keV further improves significantly to . The -Test probability for this case as opposed to the case without lines is , confirming the unambiguous detection of the cyclotron lines. For this model we also added the Fe-line which has been seen, e.g., in the BeppoSAX data (Cusumano et al., 1998). The best fit value for the line energy is . The width of the line could not be constrained by our data, so we fixed it to 0 eV, corresponding to an equivalent width of 135 eV.
To exclude the possibility that the CRSFs are due to incorrect modeling of the continuum, we also used other continuum models111We did not use the highecut model due to the artificial features introduced in the fit residuals by the abrupt onset of the cutoff (Kretschmar et al., 1997; Kreykenbohm et al., 1999). including the NPEX model, which consists of negative and positive power laws with a common exponential cutoff factor (Mihara, 1995):
| (2) |
Using an absorbed NPEX model, we obtain and also observe line like features at 19 and 40 keV. Again we first fitted only one feature at 44.4 keV, resulting in a . Fitting these features with two Gaussians at 42.0 keV and 18.7 keV improves the fit significantly resulting in (-Test: ). See Table 4 for the complete set of model parameters. With the NPEX model it was not possible to constrain the Fe-line, however the upper limit for a line with the same energy and sigma as in the Fermi-Dirac cutoff model is , consistent with the results obtained for the continuum with a Fermi-Dirac cutoff. The continuum and line parameters measured with INTEGRAL are consistent with the BeppoSAX results (Cusumano et al., 1998). Our measurements also confirm the BeppoSAX result that in this source the second line is deeper than the fundamental line, a fact that can be explained by “photon spawning”, i.e., Compton scattering with multiple photon emission where a photon with energy results in two photons with energy (Alexander & Mészáros, 1989). From our spectral fitting we obtain an average flux of in the 20–40 keV band.

| fdcut | |||
| without line | with 1 line | with 2 lines | |
| [] | |||
| [keV] | |||
| [keV] | |||
| [keV] | – | – | |
| – | – | ||
| [keV] | – | – | |
| [keV] | – | ||
| – | |||
| [keV] | – | ||
| [keV] | – | – | |
| [eV] | – | – | (fixed) |
| [] | – | – | |
| npex | |||
| without line | with 1 line | with 2 lines | |
| [] | |||
| [] | |||
| [] | |||
| [keV] | |||
| [keV] | – | – | |
| – | – | ||
| [keV] | – | – | |
| [keV] | – | ||
| – | |||
| [keV] | – | ||
4 Timing Analysis
4.1 The X-ray light curve of 4U 1907+09
The X-ray light curve of 4U 1907+09 shows a clearly pulsed signal with a period of 441 s. The mean count rates in the 20–40 keV band for our observations are shown in Table 2. The variations in count rate largely reflect the orbital phase dependent variability (Fig. 1).
4U 1907+09 is also known to exhibit flares on a timescale of hours (Makishima et al., 1984; in ’t Zand et al., 1998; Mukerjee et al., 2001). We observed four such flares with count rate increases of at least over its normal level (Fig. 4). Three of them, in revolutions 187, 193, and 305, are associated with the main peak in the orbital lightcurve (Fig. 1) while the flare observed in revolution 188 is linked to the secondary peak. Table 5 shows an overview of the properties of these flares.
| Revolution | Center of Flare | Duration | Peak Rates | |
|---|---|---|---|---|
| MJD | sec | IBIS | ||
| 187 | 53121.65 | 7000 | 0.63 | 18.09 |
| 188 | 53125.03 | 5000 | 0.03 | 12.11 |
| 193 | 53138.21 | 7000 | 0.61 | 22.56 |
| 305 | 53472.93 | 2500 | 0.57 | 13.88 |
During flares, in ’t Zand et al. (1998) and Mukerjee et al. (2001) also reported the detection of transient 18.2 s and 14.4 s quasi-periodic oscillations (QPOs). We therefore considered to calculate dynamical power spectra for the flare light curves to search for similar oscillations, however, simulated light curves showed that our INTEGRAL data are not sensitive enough to detect a QPO at the reported levels.


4.2 Pulsar Period and Pulse Profiles
It is possible to track the evolution of the pulse period of 4U 1907+09 for more than 20 years. Since the first measurements, the source showed a steady spin down rate of (in ’t Zand et al., 1998). A recent analysis of RXTE data, however, taken during MJD 51980–52340 showed a spin down rate which is 0.5 times lower than the previous value (Baykal et al., 2005). Using our INTEGRAL data, we can extend the pulse period evolution to the years 2003–2005 (MJD 52739–53504).
To measure the pulse period of 4U 1907+09 we first performed epoch folding (Leahy et al., 1983) on each revolution separately. Using these periods we derived pulse profiles for each revolution using the respective period. The pulse profiles were then fitted by a sum of sine functions to determine the position of the trailing edge (see for example Fig 7 at phase 1.0) of the pulse to obtain absolute pulse arrival times and the differences between the arrival times of adjacent revolutions. From these time differences the approximate number of pulse cycles between those absolute times was determined. For sufficiently well sampled observations, those values are close to an integer number. These integer numbers are then taken to count the cycles throughout those well sampled subsets, and a model can be constructed to calculate expected pulse arrival times (trailing edges). The observed times can then be compared with the calculated times and a polynomial fit to the observed times yields values for the period and its derivative. Care was taken that within subsets no miscounting was possible. Between subsets the time gaps are too large such that they cannot be bridged uniquely and no statement about the period development during the gaps can be made. Using this procedure we were able to derive 12 periods with sufficient accuracy (see Table 6).
Fig. 5 shows the long-time history of the period evolution based on all available data. The line indicates the historic spin down trend with from in ’t Zand et al. (1997). The recent periods obtained by Baykal et al. (2005) show a clear deviation from the historic spin down trend. The periods obtained from INTEGRAL (shown as diamonds), not only confirm this change of the trend but show a complete trend reversal from the historic long term spin down trend to a spin up trend from MJD 53131 onwards (see Figs. 5 and 6).
We tried several models to fit this overall period evolution222For this analysis we excluded the two period measurements by IXAE (Mukerjee et al., 2001) as outliers. Including them resulted in values increased by a factor of 5.. The description of the data by three distinct episodes with a linear spin down from MJD 45576 to MJD 50290 (), a parabolic turnover from MJD 50290 to MJD 53022 of the form with , and , and a linear spin up with from MJD 53022 onwards resulted in for 34 degrees of freedom. Modeling the period evolution of 4U 1907+09 with four distinct episodes of different, but constant, results in a slightly better ( for 34 dof, see Figs. 5 and 6). The four episodes are the historic spin down with (MJD 45576 to MJD 50610), the turnover with (MJD 50610 to MJD 52643) and (MJD 52643 to MJD 53131), and finally the spin up with .
| Date | Instrument | Pulse Period | Reference |
|---|---|---|---|
| MJD | s | ||
| 45576.5 | Tenma | M84 | |
| 45850.7 | EXOSAT | C87 | |
| 48156.6 | Ginga | M95 | |
| 50134.8 | RXTE | I98 | |
| 50302.0 | IXAE | M01 | |
| 50424.3 | RXTE | B05 | |
| 50440.4 | RXTE | B01 | |
| 50460.9 | RXTE | B05 | |
| 50502.1 | RXTE | B05 | |
| 50547.1 | RXTE | B05 | |
| 50581.1 | RXTE | B05 | |
| 50606.0 | RXTE | B05 | |
| 50631.9 | RXTE | B05 | |
| 50665 | IXAE | M01 | |
| 50665.5 | RXTE | B05 | |
| 50699.4 | RXTE | B05 | |
| 50726.8 | RXTE | B05 | |
| 50754.1 | RXTE | B05 | |
| 50782.5 | RXTE | B05 | |
| 51021.9 | RXTE | B01 | |
| 51080.9 | RXTE | B01 | |
| 51993.8 | RXTE | B05 | |
| 52016.8 | RXTE | B05 | |
| 52061.5 | RXTE | B05 | |
| 52088.0 | RXTE | B05 | |
| 52117.4 | RXTE | B05 | |
| 52141.2 | RXTE | B05 | |
| 52191.4 | RXTE | B05 | |
| 52217.2 | RXTE | B05 | |
| 52254.3 | RXTE | B05 | |
| 52292.0 | RXTE | B05 | |
| 52328.8 | RXTE | B05 | |
| 52739.3 | INTEGRAL | this work | |
| 52767.1 | INTEGRAL | this work | |
| 53083.9 | INTEGRAL | this work | |
| 53121.1 | INTEGRAL | this work | |
| 53133.4 | INTEGRAL | this work | |
| 53253.6 | INTEGRAL | this work | |
| 53291.3 | INTEGRAL | this work | |
| 53314.0 | INTEGRAL | this work | |
| 53324.7 | INTEGRAL | this work | |
| 53443.4 | INTEGRAL | this work | |
| 53473.3 | INTEGRAL | this work | |
| 53503.8 | INTEGRAL | this work |

Using the derived periods, pulse profiles for all revolutions were determined (Fig. 7) by folding the light curves with the best respective periods. No change in the shape of the pulse profile is detectable, and the INTEGRAL pulse profiles before and after the reversal of are consistent with each other. In addition, we also obtained energy resolved pulse profiles (see Fig. 8 for an example). Again, the evolution of the pulse profile from below 30 keV to high energies is identical for all revolutions: the profile exhibits a single peak at all energies with only a small secondary hump, indicating the potential presence of a second peak at energies 20 keV, where a clear double peaked pulse profile was observed previously (Makishima et al., 1984; Cook & Page, 1987; in ’t Zand et al., 1998). At energies above 60 keV, the source gets too faint and no pulsed emission is observable.


5 Summary and Discussion
Since 2003, 4U 1907+09 was observed frequently with INTEGRAL. In this paper, we presented the results of the timing analysis of 2280 ksec of IBIS data and of the spectral analysis of 1258 ksec of IBIS and 200 ksec of JEM-X2 data. Two cyclotron lines at 19 keV and 40 keV are detected, consistent with earlier Ginga and BeppoSAX results (Mihara, 1995; Cusumano et al., 1998). Assuming a gravitational redshift of (assuming and ), from these CRSF observations a -field strength of can be inferred. Four flares in the X-ray lightcurves with durations between 2500 s and 7000 s were observed, three of which are associated with the primary flare in the orbital lightcurve of 4U 1907+09.
In addition to these confirmations of earlier results, our INTEGRAL data show, for the first time, a clear spin up phase in 4U 1907+09 (Table 6 and in Figs. 5 and 6). After almost 20 years of constant spin down at a rate of , with the available data being consistent with , in 2002 and 2003 first indications for a decrease in the magnitude of spin down were detected (Baykal et al., 2005). As shown in Sect. 4.2, the new INTEGRAL data show a torque reversal from MJD 53131 onwards, with the source now exhibiting a spin up with a rate of . So far, the INTEGRAL results appear to be consistent with (the upper limit for during the spin up is ).
The traditional interpretation of spin up in X-ray binaries with a strongly magnetized, disk-accreting neutron star is that the accretion disk is truncated at the inner edge of the disk by the magnetic field of the neutron star (see, e.g., Ghosh et al., 1977; Ghosh & Lamb, 1979a, b, and references therein). For prograde disks, the magnetic coupling between the accretion disk and the neutron star and the transfer of angular momentum from the accreted matter onto the neutron star will lead to a torque onto the neutron star resulting in spin up. The general expectation of these models is that the accretion disk is close to equilibrium, i.e., the Alfvén or magnetospheric radius, , where the accretion flow couples to the magnetic field, is assumed to be close to the corotation radius, , where the disk’s Kepler frequency equals the rotational frequency of the neutron star. For accretion to occur, , as otherwise the onset of the centrifugal barrier (the “propeller effect”) prevents the material from falling onto the neutron star (Illarionov & Sunyaev, 1975).
Most accreting neutron star systems, such as Her~X-1 or Vela X-1, show a secular spin up or spin down trend onto which short, large magnitude episodes of spin down or spin up are superimposed (Bildsten et al., 1997). These shorter episodes are often interpreted to be due to short term variations in , which give rise to short-term torque fluctuations. In contrast to these systems, GX 1+4, 4U 162667, and 4U 1907+09 showed decade-long phases where did not change its sign. GX~1+4 was seen to spin up with a very short characteristic timescale, years, from the early 1970s until the source flux dropped below detectability in the EXOSAT era of the early 1980s. From 1985 onwards the source reemerged with a strong spin down (Makishima et al., 1988; Mony et al., 1991; Chakrabarty et al., 1997). Recent INTEGRAL observations show that this spin down has continued until at least 2004 (Ferrigno et al., 2006). A second source with a long phase of unchanged sign of is the ultracompact low mass X-ray binary 4U 1626$-$67, which was spinning up between 1977 and 1989, followed by a torque reversal and an extended spin down phase starting in 1991 (Chakrabarty et al., 1997). In contrast to GX 1+4, no luminosity drop was seen during the torque reversal and with years the characteristic spin up and spin down timescales are significantly larger. Provided that the torque reversal of 4U 1907+09 described in this paper does not change back in the next years, in its overall period behavior, 4U 1907+09 resembles 4U 162667: both sources have several thousands of years and no change in luminosity was observed during the torque reversal. On the other hand, however, 4U 1907+09 is a high mass X-ray binary with a much longer orbital period, and thus shares similarities with the low mass X-ray binary GX 1+4, and furthermore 4U 1907+09 switched from spin down to spin up, while GX 1+4 and 4U 162667 switched from spin up to spin down. Common for the three sources is that the magnitude of is similar for the spin up and the spin down.
With the simple magnetic torquing model outlined above, the long distinct episodes of roughly constant and the magnitude and sign of are difficult to explain: As discussed above, for systems close to equilibrium it is expected that . In reality, however, this is not the case. In the case of 4U 1907+09, it was first pointed out by in ’t Zand et al. (1998) that the magnetospheric radius inferred from the cyclotron line measurements is km, while km. Moving out to would require a magnetic field of , which is two orders of magnitude larger than the magnetic field deduced from the observed cyclotron lines. Alternatively, could be significantly lower than the value inferred from the X-ray luminosity of the system. Assuming the efficiency of accretion is comparable to other systems, however, a low would imply a significantly smaller distance to 4U 1907+09 than allowed by its optical reddening, which seems equally unlikely. in ’t Zand et al. (1998) argued that the presence of quasi-periodic oscillations (QPOs) and the long term systematic trend in the spin down are strong indicators for the presence of a accretion disk in the system with a small inner disk radius. In analogy to GX 1+4 (Chakrabarty et al., 1997, and references therein), these authors show that a transient retrograde disk with a duty cycle of 1–5% could provide a sufficiently strong torque to explain the observed spin down. This torquing would coincide with a short term increase of source luminosity. in ’t Zand et al. (1998) speculate that the X-ray flares indicate the presence of the retrograde disk, since a switch to a retrograde disk would imply an increase in X-ray luminosity. They point out, however, that the 1000 s duration of the flares seen in their RXTE data is too small with respect to the required duty cycle for a retrograde disk. We note that the INTEGRAL results show flare durations of several ksec duration (Tab. 5), which is more in line with the expected duty cycle. Furthermore, the folded lightcurve of 4U 1907+09 indicates a brightening of the source around phase 0.6 (Fig. 1). With duration, this flare is long enough to easily accommodate the required duty cycle of the retrograde disk and to explain the observed . We note, however, that not all of the brightening seen in Fig. 1 is due to the flares identified by us as removing these flares from the data still results in a clear peak at phase 0.6 in the folded lightcurve. Part of the brightening could therefore be also due to an enhanced during this phase of the elliptical orbit of the neutron star, although we cannot firmly exclude the presence of smaller flares which would not be picked up due to our conservative definition of a flare.
While the model of a retrograde disk can explain the magnitude of , it is more difficult to reconcile the torque reversal found with INTEGRAL with this model. First of all, as discussed above, the four intervals of different represent distinct episodes of different torques on the neutron star. In the retrograde disk model, it is difficult to understand why the characteristic spin up and spin down timescales appear so similar. Furthermore, these three phases would then correspond to different duty cycles of the retrograde disk, resulting in a change in observed flux. Such a behavior has been observed, e.g., in GX 1+4, where torque and luminosity are correlated during the spin down phase (Chakrabarty et al., 1997). No such correlations are observable in 4U 1907+09, where the flux has not appreciably changed during the INTEGRAL and the pointed RXTE observations (see also Baykal et al., 2005). In addition, an analysis of the orbit-averaged 2–12 keV RXTE ASM lightcurves also does not reveal a change in the soft X-ray behavior of the source, and neither is a change in the X-ray light curve with orbital phase observed.
The INTEGRAL observations also rule out the application of the torque reversals put forward by Murray et al. (1999) to explain GX 1+4. In this model, the accretion disk is assumed to consist of several rings with opposite rotation. Between these rings a gap is created such that a torque reversal should be accompanied by a minimum in the accretion luminosity. The model predicts a change in pulse profile from “leading-edge bright” during the spin down to “trailing-edge bright” during the spin up. Both, a minimum in luminosity and a change in the shape of the pulse profile are observed in GX 1+4 (Greenhill et al., 1999), but neither effect is present in 4U 1907+09 (see discussion above and Fig. 7).
Recently, Perna et al. (2006) presented a new Ansatz to explain torque changes in accreting neutron stars, which does not require the presence of retrograde disks. This model makes use of the fact that X-ray pulsars are oblique rotators, i.e., the neutron star’s magnetic field is tilted by an angle with respect to the axis of rotation of the neutron star. Assuming the accretion disk is situated in the neutron star’s equatorial plane, for a ring of matter in the accretion disk, the magnetic field strength then depends on the azimuthal angle and thus the boundary of the magnetosphere is asymmetric. As shown by Perna et al. (2006), such a configuration can lead to regions in the disk where the propeller effect is locally at work, while accretion from other regions is not inhibited (i.e., on a ring on the disk, there are some regions with and other regions with ). This results in a nonlinear dependence of the accretion luminosity from the through the outer parts of the disk. A nontrivial consequence of this more realistic accretion geometry is that for values of greater than a critical value, , limit cycles are present, where cyclic torque reversal episodes are possible without a change in . For typical parameters. is between and . We stress that the existence of the limit cycles depends only on and on the pulsar’s polar magnetic field, , and no variation of external parameters is required to trigger torque reversals. This fact is a big advantage of this model over the models discussed above.
Perna et al. (2006) show that their model can explain the principal observed properties of GX 1+4, including the luminosity drop during torque reversal, except for the observed correlation between torque and luminosity during the spin down phase. For 4U 162667, assuming G and , all observed properties of the spin history of 4U 162667 including the large and values of before and after the torque reversal and the virtually unchanged luminosity of the source can be explained (in the model, the required change in luminosity is only 5%). For these model parameters, the limit cycle of 4U 162667 is predicted to have a long period.
The similarity between the pulse histories of 4U 1907+09 and 4U 162667 suggests that a similar model would also work for the former source. We stress, however, that further quantitative work, which is outside the scope of this paper, is clearly required. Specifically, from a theoretical point of view we note that the model of Perna et al. (2006) does not yet take changes in due to the orbital eccentricity into account and that the current version of the model assumes the disk to be flat and in the equatorial plane of the neutron star, while more realistic disks onto magnetized objects can be expected to be warped and precessing (e.g., Pfeiffer & Lai, 2004, and therein). From an observational point of view, the donor stars in both systems are very different, with 4U 162667 being a low mass and 4U 1907+09 being a high mass system. Finally, we also emphasize that the torque reversal in 4U 162667 was from a spin up to a spin down, while for 4U 1907+09 it was from a spin down to a spin up. Since the torque reversal episodes are cyclic, however, we do not expect this latter difference to be of major importance.
In conclusion, the torque reversal of 4U 1907+09 with no associated drop in luminosity and no change in the shape of the pulse profile seem to be difficult to reconcile with models explaining the large through the presence of a retrograde disk. On the other hand, the proposal of Perna et al. (2006) to explain torque reversals through accretion onto an oblique rotator seems to be able to explain the long term constancy of trends in 4U 1907+09 and 4U 162667, the large magnitude of , and the constancy of X-ray flux over the torque reversal, although further and more detailed theoretical studies are required. As a prediction of the model for systems such as 4U 1907+09 and 4U 162667 is that torque reversal episodes are rare events, further monitoring of the pulse period of 4U 1907+09 is required to determine whether this change is a sign of a long term torque reversal or whether we are just observing a short deviation from a long term spin down trend.
Acknowledgements.
We acknowledge the support of the Deutsches Zentrum für Luft- und Raumfahrt under grant numbers 50OR0302, 50OG9601, and 50OG0501, and by National Aeronautics and Space Administration grant INTEG04-0000-0010. This work is based on observations with INTEGRAL, an European Space Agency (ESA) project with instruments and science data centre funded by ESA member states (especially the PI countries: Denmark, France, Germany, Italy, Switzerland, Spain), Czech Republic and Poland, and with the participation of Russia and the USA.References
- Alexander & Mészáros (1989) Alexander, S. G. & Mészáros, P. 1989, ApJ, 344, L1
- Baykal et al. (2001) Baykal, A., İnam, Ç., Ali Alpar, M., in ’t Zand, J., & Strohmayer, T. 2001, MNRAS, 327, 1269
- Baykal et al. (2005) Baykal, A., İnam, S. Ç., & Beklen, E. 2005, MNRAS, submitted (astro-ph/0512176)
- Bildsten et al. (1997) Bildsten, L., Chakrabarty, D., Chiu, J., et al. 1997, ApJS, 113, 367
- Brandt et al. (2003) Brandt, S., Budtz-Jørgensen, C., Lund, N., et al. 2003, A&A, 411, L243
- Chakrabarty et al. (1997) Chakrabarty, D., Bildsten, L., Finger, M. H., et al. 1997, ApJ, 481, L101
- Chakrabarty et al. (1997) Chakrabarty, D., Bildsten, L., Grunsfeld, J. M., et al. 1997, ApJ, 474, 414
- Chitnis et al. (1993) Chitnis, V. R., Rao, A. R., Agrawal, P. C., & Manchanda, R. K. 1993, A&A, 268, 609
- Coburn et al. (2002) Coburn, W., Heindl, W. A., Rothschild, R. E., et al. 2002, ApJ, 580, 394
- Cook & Page (1987) Cook, M. C. & Page, C. G. 1987, MNRAS, 225, 381
- Cox et al. (2005) Cox, N. L. J., Kaper, L., & Mokiem, M. R. 2005, A&A, 436, 661
- Cusumano et al. (1998) Cusumano, G., di Salvo, T., Burderi, L., et al. 1998, A&A, 338, L79
- Ferrigno et al. (2006) Ferrigno, C., Segreto, A., Santangelo, A., et al. 2006, A&A, submitted
- Ghosh & Lamb (1979a) Ghosh, P. & Lamb, F. K. 1979a, ApJ, 232, 259
- Ghosh & Lamb (1979b) Ghosh, P. & Lamb, F. K. 1979b, ApJ, 234, 296
- Ghosh et al. (1977) Ghosh, P., Pethick, C. J., & Lamb, F. K. 1977, ApJ, 217, 578
- Giacconi et al. (1971) Giacconi, R., Kellogg, E., Gorenstein, P., Gursky, H., & Tananbaum, H. 1971, ApJ, 165, L27
- Greenhill et al. (1999) Greenhill, J. G., Galloway, D. K., & Murray, J. R. 1999, Proc. Astron. Soc. Aust., 16, 240
- Gros et al. (2003) Gros, A., Goldwurm, A., Cadolle-Bel, M., et al. 2003, A&A, 411, L179
- Illarionov & Sunyaev (1975) Illarionov, A. F. & Sunyaev, R. A. 1975, A&A, 39, 185
- in ’t Zand et al. (1998) in ’t Zand, J. J. M., Baykal, A., & Strohmayer, T. E. 1998, ApJ, 496, 386
- in ’t Zand et al. (1997) in ’t Zand, J. J. M., Strohmayer, T. E., & Baykal, A. 1997, ApJ, 479, L47
- Iye (1986) Iye, M. 1986, PASJ, 38, 463
- Kretschmar et al. (1997) Kretschmar, P., Kreykenbohm, I., Staubert, R., et al. 1997, in AIP Conf. Proc., Vol. 410, Proc. 4th Compton Symposium, ed. C. D. Dermer, M. S. Strickman, & J. D. Kurfess, Woodbury, 788–792
- Kreykenbohm et al. (1999) Kreykenbohm, I., Kretschmar, P., Wilms, J., et al. 1999, A&A, 341, 141
- Kreykenbohm et al. (2006) Kreykenbohm, I. et al. 2006, A&A, to be submitted
- Leahy et al. (1983) Leahy, D. A., Darbro, W., Elsner, R. F., et al. 1983, ApJ, 266, 160
- Lebrun et al. (2003) Lebrun, F., Leray, J. P., Lavocat, P., et al. 2003, A&A, 411, L141
- Lund et al. (2003) Lund, N., Budtz-Jørgensen, C., Westergaard, N. J., et al. 2003, A&A, 411, L231
- Makishima et al. (1984) Makishima, K., Kawai, N., Koyama, K., et al. 1984, PASJ, 36, 679
- Makishima et al. (1992) Makishima, K., Mihara, T., Nagase, F., & Murakami, T. 1992, in Proc. 28th Yamada Conference: Frontiers of X-ray Astronomy, ed. Y. Tanaka & K. Koyama, Frontiers Science Series (Tokyo: Universal Academy Press), 23
- Makishima et al. (1988) Makishima, K., Ohashi, T., Sakao, T., et al. 1988, Nat, 333, 746
- Marshall & Ricketts (1980) Marshall, N. & Ricketts, M. J. 1980, MNRAS, 193, 7P
- Mihara (1995) Mihara, T. 1995, PhD thesis, RIKEN, Tokyo
- Mony et al. (1991) Mony, B., Kendziorra, E., Maisack, M., et al. 1991, A&A, 247, 405
- Mukerjee et al. (2001) Mukerjee, K., Agrawal, P. C., Paul, B., et al. 2001, ApJ, 548, 368
- Murray et al. (1999) Murray, J. R., de Kool, M., & Li, J. 1999, ApJ, 515, 738
- Perna et al. (2006) Perna, R., Bozzo, E., & Stella, L. 2006, ApJ, 639, 363
- Pfeiffer & Lai (2004) Pfeiffer, H. P. & Lai, D. 2004, ApJ, 604, 766
- Protassov et al. (2002) Protassov, R., van Dyk, D. A., Connors, A., Kashyap, V. L., & Siemiginowska, A. 2002, ApJ, 571, 545
- Roberts et al. (2001) Roberts, M. S. E., Michelson, P. F., Leahy, D. A., et al. 2001, ApJ, 555, 967
- Schwartz et al. (1980) Schwartz, D. A., Griffiths, R. E., Bowyer, S., Thorstensen, J. R., & Charles, P. A. 1980, AJ, 85, 549
- Tanaka (1986) Tanaka, Y. 1986, in Radiation Hydrodynamics in Stars and Compact Objects, ed. D. Mihalas & K.-H. A. Winkler, IAU Coll. No. 89 (Heidelberg: Springer), 198
- Ubertini et al. (2003) Ubertini, P., Lebrun, F., Di Cocco, G., et al. 2003, A&A, 411, L131
- van Kerkwijk et al. (1989) van Kerkwijk, M. H., van Oijen, J. G. J., & van den Heuvel, E. P. J. 1989, A&A, 209, 173
- Vedrenne et al. (2003) Vedrenne, G., Roques, J.-P., Schönfelder, V., et al. 2003, A&A, 411, L63
- Winkler et al. (2003) Winkler, C., Courvoisier, T. J.-L., Di Cocco, G., et al. 2003, A&A, 411, L1