Sensitivity of the NEMO telescope to neutrinos from microquasars
Abstract
We present the results of Monte Carlo simulation studies of the capability of the proposed NEMO telescope to detect TeV muon neutrinos from Galactic microquasars. In particular we determined the number of the detectable events from each known microquasar together with the expected atmospheric neutrino and muon background events. We also discuss the detector sensitivity to neutrino fluxes expected from microquasars, optimizing the event selection in order to reject the atmospheric background, and we show the number of events surviving the event selection.
1 INTRODUCTION
Microquasars are Galactic X-ray binary systems which exhibit relativistic jets, observed in the radio band [1]. Several authors propose microquasar jets as sites of acceleration of charged particles up to energies of about eV, and of high energy neutrino production. According to present models, neutrinos could be produced both in p [2, 3] and pp interaction scenarions [4, 5, 6, 7].
The aim of this paper is to study the possibility to detect neutrinos from known microquasars with the proposed NEMO-km3 telescope [8]. In particular, for each microquasar we simulated the number of expected events according to present models. We also simulated the expected background from atmospheric neutrinos and muons.
We applied an event selection in order to reject the atmospheric background. The event selection is a combination of different criteria, chosen optimizing the detector sensitivity to neutrino fluxes coming from each microquasar. Eventually we calculated the expected number of events surviving the selection referring to 1 year of data taking.
2 DETECTOR LAY-OUT
The NEMO-km3 telescope, simulated in this paper, is a square array of towers with a distance between towers of 140 m. In this configuration each tower hosts 72 PMTs (with a diameter of 10”), namely 5832 PMTs for the whole detector with a total geometrical volume of km3. We considered an 18 storey tower; each storey is made of a 20 m long beam structure hosting two optical modules (one downlooking and one looking horizontally) at each end (4 OMs per storey). The vertical distance between storeys is 40 m. A spacing of 150 m is added at the base of the tower, between the anchor and the lowermost storey.
The detector response is simulated using the simulation codes developed by the ANTARES Collaboration [9]. In the simulation codes, the light absorption length, measured in the site of Capo Passero ( m at 440 nm [10]), is taken into account. Once the sample of PMT hits is generated, spurious PMT hits, due to the underwater optical noise (40K decay), are introduced, with a rate of 30 kHz for 10” PMTs, corresponding to the average value measured in Capo Passero site.
3 EXPECTED NEUTRINO EVENTS FROM MICROQUASARS
For each microquasar, a number of interacting neutrinos was simulated in the energy range 1 - 100 TeV in order to reproduce the neutrino fluxes calculated by Distefano et al. [3]. The generation spectral index is chosen to be , in order to guarantee a good event statistics at the highest energies. The simulated events are then weighted to the theoretical fluxes and the number of expected events is computed and reported in Tab. 1. Results refer to an integration time equal to the duration of the considered burst for the transient sources and to one year for the steady sources.
For microquasar LS 5039, events were generated in the energy range 0.1 - 1 TeV to simulate neutrinos events according to the model proposed by Aharonian et al. [5]. In Tab. 2 the number of muon events from LS 5039 is reported. The simulations refer to a power-law neutrino spectrum, , with energy cutoff TeV and 100 TeV, and and 2, respectively. For the four combinations of parameters and , an average neutrino energy flux erg/cm2 s ( TeV) was simulated.
For microquasar Cygnus X-3, events were generated in the energy range 0.1 - 1 TeV and events with energies 100 - 1000 TeV to simulate Bednarek’s theoretical fluxes [4]. In Tab. 3 we give the number of muon events from Cygnus X-3, considering different values of the the spectral index and for the Lorentz factor cut-off of the spectrum of nuclei generating the neutrinos. The case of neutrons injected by mono-energetic nuclei having a Lorentz factor is also considered (see [4] for details).
Other models, present in literature, are not considered here because they refer to microquasars outside the field of view of the NEMO telescope [6] or because the predicted neutrino fluxes are too low to be detected by a km3 telescope [7].
| Steady Microquasars | (days) | |||
| LS 5039 | 365 | 0.2 | 0.1 | 0.1 |
| Scorpius X-1 | 365 | 0.8 | 0.2 | 0.1 |
| SS433 | 365 | 205.0 | 76.0 | 0.1 |
| GX 339-4 | 365 | 185.0 | 68.0 | 0.1 |
| Cygnus X-1 | 365 | 2.0 | 0.5 | 0.1 |
| Bursting Microquasars | ||||
| XTE J1748-288 | 20 | 2.2 | 0.8 | 0.3 |
| Cygnus X-3 | 3 | 3.4 | 0.8 | 0.1 |
| GRO J1655-40 | 6 | 1.7 | 0.6 | 0.1 |
| GRS 1915+105 | 6 | 0.4 | 0.1 | |
| Circinus X-1 | 4 | 0.2 | 0.1 | 0.1 |
| XTE J1550-564 | 5 | |||
| V4641 Sgr | 0.3 | 1.4 | 0.1 | |
| GS 1354-64 | 2.8 | 0.1 | ||
| GRO J0422+32 | 120 | 0.11.5 | 0.4 | 0.1 |
| XTE J1118+480 | 30150 | 2.412.0 | 1.04.8 | 0.2 |
| (TeV) | ||||
|---|---|---|---|---|
| 1.5 | 10 | 7.0 | 1.7 | 0.2 |
| 1.5 | 100 | 15.0 | 4.9 | 0.1 |
| 2.0 | 10 | 4.3 | 1.0 | 0.3 |
| 2.0 | 100 | 9.0 | 2.6 | 0.1 |
| Cygnus X-3 | REG. II | REG. III | REG. II | REG. III | |
|---|---|---|---|---|---|
| 2.0 | 1.8 | 0.4 | 0.4 | 0.1 | |
| 5.2 | 5.0 | 1.1 | 1.1 | 0.1 | |
| 0.3 | 0.2 | 0.1 | 0.1 | ||
| mono-energetic | 4.5 | 0.7 | 0.1 |
3.1 SIMULATION OF THE BACKGROUND
A sample of atmospheric neutrinos have been generated using the ANTARES event generation code, based on a weighted generation technique [9]. The events were generated in the energy range GeV, with a spectral index and a isotropic angular distribution. The events were then weighted to to the sum of the Bartol flux [11] and of prompt neutrino rqpm model [12] flux. So doing, we compute a number of detected atmospheric neutrino events per year of data acquisition.
Atmospheric muons are generated at the detector, applying a weighted generation technique. We generated a sample of muons, in the energy range 1 TeV 1 PeV, with a generation spectral index . We also generated events in the range 100 GeV - 1 TeV, with a generation spectral index . Muons are generated with an isotropic angular distribution. The events are weighted to the Okada parameterization [13], taking into account the depth of the Capo Passero site ( m) and the flux variation inside the detector sensitive height ( m). According to the Okada parameterization, the expected number of reconstructed muon events is about per year. Our statistics cover only a few days. Considering that reconstructed events have a flat distribution in Right Ascension (RA), we can project the simulated events in a few degrees bin RA, centered in the source position. So doing, we get statistics of atmospheric muons corresponding to a time year at all source declinations.
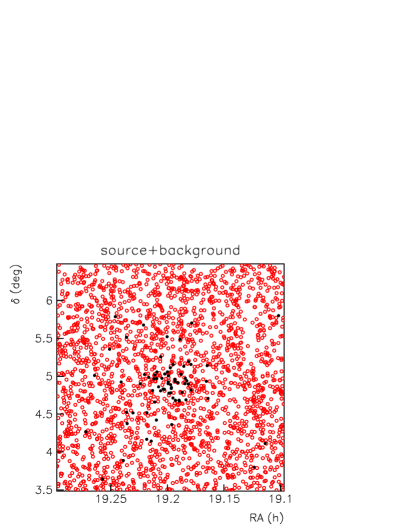
At the reconstruction level, the fraction of background events is too high and exceeds the expected signal also in the case of the most intense microquasars. As an example we present the case of microquasars SS443 (=+04∘ 58’ 58”.0, RA=19h 11m 49s.6), considering an observation time of 1 year and an angular bin of around the source position in the sky. The result for SS433 is shown in Fig. 1 in which are represented events from the source and from atmospheric background (only up-ward going reconstructed tracks are considered). Source and background events are selected with a hit-or-miss procedure. This procedure consists in comparing, for each event, the weight with a number randomly generated in the range . If the event is accepted, if not the event is rejected.

4 SENSITIVITY TO MUON NEUTRINOS FROM MICROQUASARS
4.1 Calculation of the detector sensitivity
The detector sensitivity was calculated according to the Feldman and Cousins approach [14]. The 90% c.l. sensitivity to a neutrino flux coming from a point-like source is given by
| (1) |
where is the 90% c.l. average upper limit for an expected background with known mean value and no true signal [14], is an arbitrary point source flux inducing a mean signal .
4.2 Selection criteria for background rejection
The used reconstruction algorithm is a robust track fitting procedure based on a maximization likelihood method [9]. In this work, we used, as a goodness of fit criterion, the variable:
| (2) |
where is the log-likelihood per degree of freedom () and is the total number of compatible solutions found by the reconstruction program. In particular, events are selected if the variable is greater than a given value . This quality cut is here applied together with other selection criteria as listed in the following:
-
•
the number of hits , used to reconstruct the muon track, must be greater than a given value ;
-
•
the muon must be reconstructed with , in order to reject down-going events;
-
•
only events reconstructed in a circular sky region centered in the source position and having a radius of are considered.
The optimal values of , , and are chosen to optimize the detector sensitivity.
4.3 Results
The detector sensitivity was calculated for a livetime of 1 year, simulating a neutrino flux with spectral index in the energy range 1 - 100 TeV and taking into account both atmospheric neutrino and muon background. The study was carried out for each microquasar, since the sensitivity is a function of the source astronomical declination.
In Tab. 4 we give the sensitivity for each microquasar, and the corresponding , and . The dependence of the sensitivity on the source declination is shown in Fig. 2.
| Steady Microquasars | (deg) | (deg) | (erg/cm2 s) | |
|---|---|---|---|---|
| LS 5039 | 101 | -7.3 | 0.9 | |
| Scorpius X-1 | 104 | -7.7 | 0.7 | |
| SS433 | 115 | -8.0 | 0.8 | |
| GX 339-4 | 96 | -7.4 | 0.5 | |
| Cygnus X-1 | 103 | -7.5 | 0.7 | |
| Bursting Microquasars | ||||
| XTE J1748-288 | 102 | -7.6 | 0.9 | |
| Cygnus X-3 | 101 | -7.3 | 0.8 | |
| GRO J1655-40 | 101 | -7.4 | 0.7 | |
| GRS 1915+105 | 100 | -7.4 | 0.8 | |
| Circinus X-1 | 90 | -7.3 | 0.9 | |
| XTE J1550-564 | 90 | -7.1 | 0.9 | |
| V4641 Sgr | 102 | -7.4 | 0.9 | |
| GS 1354-64 | 90 | -7.5 | 1.0 | |
| GRO J0422+32 | 103 | -7.5 | 0.8 | |
| XTE J1118+480 | 102 | -7.5 | 0.7 |

In Tab. 5 are summarized the detector sensitivities for microquasar LS 5039, assuming neutrino fluxes with spectral indices and 2, in the energy range 0.1 TeV and and 100 TeV.
| (TeV) | (deg) | (deg) | (erg/cm2 s) | ||
|---|---|---|---|---|---|
| 1.5 | 10 | 101 | -7.3 | 1.0 | |
| 1.5 | 100 | 101 | -7.3 | 0.9 | |
| 2.0 | 10 | 97 | -7.4 | 1.0 | |
| 2.0 | 100 | 101 | -7.3 | 0.9 |
5 EXPECTED NUMBER OF EVENTS
We applied the event selection cuts given in Tab. 4 and 5 to determine the expected number of events from theoretical models considered in this paper. In Tab. 1 we give the number of selected neutrino events from each microquasar, according to the neutrino fluxes given by Distefano et al. [3]. In the same table we compare these results with the atmospheric neutrino and muon background in 1 year of data taking. In this analysis, it is assumed that transient sources cause one burst per year, i.e. the number of source events produced in the interval is related to 1 year observation time.
The search for neutrino events in coincidence with microquasar radio outbursts could restrict the analysis period to the flare duration , reducing the background. Such an analysis technique, already used by AMANDA [15], can improve the detector sensitivity to neutrinos from transient sources. Referring to the bursts considered in Tab. 1 and integrating over the time interval , we expect about background events per burst.
For the microquasar LS 5039 we considered the flux predicted by Aharonian et al. [5]. The expected number of selected events is given in Tab. 2; the comparison with the atmospheric background shows that an evidence could be expected in a few years of data taking.
In Tab. 3 we quote the expected number of events from microquasar Cygnus X-3, according to the Bednarek model [4]. Since the model predicts a neutrino flux with a spectral index close to 2 and since the main event contribution is in the energy range 1 - 100 TeV, we used the same event selection parameters quoted in Tab. 4. Except the case of and , the number of events exceeds the expected background and the signal could be detected in a few years of data taking.
6 CONCLUSIONS
The possibility to detect TeV neutrinos from Galactic microquasars with the proposed NEMO-km3 underwater Čerenkov neutrino telescope has been investigated.
A Monte Carlo was carried out to simulate the expected neutrino-induced muon fluxes produced by point-like sources and by atmospheric neutrinos. The expected atmospheric muon background was also simulated.
We computed the detector sensitivity for each microquasar, optimizing the event selection in order to reject the background. Finally, we applied the event selection and calculated the number of surviving events.
Our results show that, assuming reasonable scenarios for TeV neutrino production, the proposed NEMO telescope could identify microquasars in a few years of data taking, with a discovery potential for at least few cases above the 5 level, or strongly constrain the neutrino production models and the source parameters.
References
- [1] S. Chaty, Proc. of Rencontres de Moriond, Very High Energy Phenomena in the Universe, La Thuile, Italy, March 12-19, 2005 (astro-ph/0506008).
- [2] A. Levinson, E. Waxman, Phys. Rev. Lett. (2001) 87.171101.
- [3] C. Distefano, D. Guetta, E. Waxman, A. Levinson, ApJ 575 (2002) 378.
- [4] W. Bednarek, ApJ 631 (2005) 466.
- [5] F.A. Aharonian et al., J. Phys. Conf. Ser. 39 (2006) 408 (astro-ph/0508658).
- [6] H.R. Christiansen et al., Phys.Rev. D73 (2006) 063012.
- [7] G.E. Romero and M. Orellana, A&A 439 (2005) 237.
- [8] P. Piattelli for the NEMO Collaboration, in these proceedings.
- [9] Y. Becherini for the ANTARES Collaboration, Nucl. Instr. and Meth. A (2006) in press. Proceedings of Very Large Volume neutrino Telescopes - VLVnT2, Catania, November 8 - 11, 2005.
- [10] G. Riccobene et al., Astrop. Phys. (2006) submitted.
- [11] V. Agrawal et al., Phys. Rev. D53 (1996) 1314.
- [12] E.V. Bugaev et al., Phys. Rev. D58 (1998) 054001.
- [13] A. Okada, Astrop. Phys. 2 (1994) 393.
- [14] G.J. Feldman & R.D. Cousins, Phys. Rev. D 57 (1998) 3873.
- [15] M. Ackermann et al., IceCube Collaboration, Proc. of 29th ICRC ger-ackermann-M-abs1-og25-oral, Pune, India, (2005), http://icrc2005.tifr.res.in/.