Deep imaging survey of the environment of Centauri
Abstract
Context. Centauri is our closest stellar neighbor, at a distance of only 1.3 pc, and its two main components have spectral types comparable to the Sun. This is therefore a favorable target for an imaging search for extrasolar planets. Moreover, indications exist that the gravitational mass of Cen B is higher than its modeled mass, the difference being consistent with a substellar companion of a few tens of Jupiter masses.
Aims. We searched for faint comoving companions to Cen B. As a secondary objective, we built a catalogue of the detected background sources.
Methods. We used the NACO adaptive optics system of the VLT in the , , and bands to search for companions to Cen B. This instrument allowed us to achieve a very high sensitivity to point-like sources, with a limiting magnitude of at 7” from the star. We complemented this data set with archival coronagraphic images from the HST-ACS instrument to obtain an accurate astrometric calibration.
Results. Over the observed area, we did not detect any comoving companion to Cen B down to an absolute magnitude of 19-20 in the and bands. However, we present a catalogue of 252 background objects within about 15” of the star. This catalogue fills part of the large void area that surrounds Cen in sky surveys due to the strong diffused light. We also present a model of the diffused light as a function of angular distance for the NACO instrument, that can be used to predict the background level for bright star observations.
Conclusions. According to recent numerical models, the limiting magnitude of our search sets the maximum mass of possible companions to 20-30 times Jupiter, between 7 and 20 AU from Cen B.
Key Words.:
Techniques: high angular resolution, Stars: individual: Cen, planetary systems, solar neighbourhood, Astronomical data bases: miscellaneous, Infrared: stars1 Introduction
Our closest stellar neighbor, the Cen visual triple star (pc), is an extremely attractive target for an extra-solar planet search. The main components, Cen A (HD 128620) and B (HD 128621), are G2V and K1V solar-like stars, (e.g. have solar-like asteroseismic oscillation frequencies), while the third member is the red dwarf Proxima (M5.5V). In all imaging planet searches, the main difficulty is in retrieving the planetary signal in the bright point-spread function (hereafter PSF) from the star. The proximity of Cen is a clear advantage as it allows a faint companion to be easily separated angularly from the star itself down to orbital distances as close as a few astronomical units. After a discussion of the potential for companions around Cen (Sect. 2), we present our adaptive optics observations (Sect. 3) and the existing data from the HST archive (Sect. 4), followed by the catalogue of the detected sources (Sect. 5) and a discussion (Sect. 7).
2 Why search for companions around Cen ?
Two factors led us to consider the possibility of a planetary mass companion orbiting around Cen B: the mass discrepancy between models and the dynamical mass of B on one hand, and the existence of chaotically stable orbits at intermediate distances from the star on the other hand.
2.1 The mass of Cen B
Thévenin et al. (thevenin02 (2002), hereafter T02) have proposed a model of Cen B that reproduces well both the asteroseismic observables and the high-precision radius measurement obtained using long-baseline interferometry (Kervella et al. kervella03 (2003); Bigot et al. bigot06 (2006)). This model yields a mass of for Cen B, in agreement with the study by Guenther & Demarque (guenther00 (2000)). Simultaneously, Pourbaix et al. (pourbaix02 (2002), hereafter P02) have measured the radial velocity of this star with an overall precision of a few m.s-1 and deduced a dynamical mass of . The difference between the model mass and the dynamical mass of B reaches Jupiter masses (hereafter ). No such difference is observed for Cen A, for which the agreement is excellent between the measured properties of Cen A and the model from T02, computed using the mass measured by P02.
In order to explain the 3 difference between the modeled and measured mass of B, a possible scenario is that the implicit assumption made by P02 of a two-body system is incorrect due to the existence of a companion orbiting Cen B. We note that these authors have introduced a correction of the radial velocity of B, as they find an offset with respect to the data obtained by Kamper & Wesselink (kamper78 (1978)). This correction may mask the signature of a long-period, low-mass companion orbiting B. The contribution of Proxima to the radial velocity of the main pair is negligible (due to its large distance from the A-B pair). Alternatively, a companion could also orbit the A-B pair on a very long period orbit and currently be located closer to B. Its gravitational contribution would make B appear heavier in the A-B interaction. This is however less probable, as the mass of this companion would have to be significantly higher than the proposed to compensate for its increased distance.
In summary, an brown dwarf (hereafter BD) within ” from Cen B (or up to 50-100” if orbiting around the pair) could be a viable explanation for the mass discrepancy between P02 and T02. This hypothesis is also favored by the fact that the Cen system is metal-rich and Cen A is Li-poor, as expected for stars hosting massive planets (Santos et al. santos03 (2003); Israelian et al. israelian04 (2004)).
Table 1 lists the relevant physical properties of Cen A and B, and the astrometric and orbital parameters of the pair are given in Table 2. The position of the barycenter is computed from the Hipparcos astrometric solution of components A and B using the masses of Table 2. This gives a perfect consistency with the Hipparcos data, but with an accuracy limited by the poor astrometric solution of the B component. Another solution would have been to use the astrometric solution of component A and the orbital elements of the system, whose uncertainty is hard to evaluate. The difference between the two approaches is about 0.02 arcsec, so it can be used as a good estimate of the uncertainty of the astrometric position of the barycenter in the ICRS frame at epoch J 1991.25.
| Cen A | Cen B | |
| Other names | HD 128620 | HD 128621 |
| HIP 71683 | HIP 71681 | |
| -0.01 | 1.33 | |
| -1.16 | -0.01 | |
| -1.39 | -0.49 | |
| -1.50 | -0.60 | |
| Spectral Type | G2V | K1V |
| (K)a | ||
| a | ||
| a |
-
a
From Morel et al. (morel00 (2000)) and references therein.
| Barycenter RA (epoch 1991.25, ICRS)a | 14:39:40.216 |
|---|---|
| Barycenter Dec (epoch 1991.25, ICRS)a | -60:50:13.58 |
| Proper motion RA (mas) | -3642.95 |
| Proper motion Dec (mas) | 694.75 |
| Radial velocity (km/s) | -20 |
| Galactic long. (∘) | 315.73 |
| Galactic lat. (∘) | -0.68 |
| Parallax (mas)b | |
| Semi-major axis (”)c | |
| Period (yr)c | |
| Excentricity c | |
| Inclination (∘)c | |
| Long. of ascending node (∘)c | 204.82 |
| Longitude of pericenter (∘)c | 231.80 |
| Reference epochc | 1955.59 |
| ()d | 1.10 |
| ()d | 0.91 |
2.2 Orbital stability
Presently, at least 15 examples of extrasolar planets are known to orbit binary star members: 16 Cyg B, And, Boo, etc… (Eggenberger, Udry & Mayor eggenberger03 (2003); Eggenberger et al. eggenberger04 (2004); Mugrauer et al. mugrauer05 (2005)). The 40 yrs period binary Cep is also very likely the host of a 1.3 planet on a 1.8 AU orbit (Cochran et al. cochran02 (2002)). Wiegert & Holman (wiegert97 (1997)) have identified how stable orbits can be found within 2” of Cen B (interior planets) or at distances of up to 50” (exterior planets, orbiting the pair). As a further incentive, it has been demonstrated that the Kozai resonance (Holman et al. holman97 (1997); Innanen et al. innanen97 (1997)) can prevent the ejection of a binary star companion through chaotic variations in the excentricity of its orbit. This mechanism is invoked by Mazeh et al. (mazeh97 (1997)) to explain the presence of the planet around 16 Cyg B. High relative inclinations favor this mechanism, and it can also be observed in the Solar system through the secular perturbations introduced by Jupiter on asteroids (Kozai kozai62 (1962)). Such a dynamical, chaotic behavior could stabilize the orbit of a BD around Cen B beyond the maximum angular separation found by Wiegert & Holman (wiegert97 (1997)). Recently, a hot Jupiter was detected around the primary star of the triple system HD 188753 (Konacki et al. konacki05 (2005)). The semi-major axis of the primary-secondary orbit is AU, only half of Cen A-B ( AU). Moreover, any angular separation can exist for a companion in orbit around the Cen pair. This is such a favorable target for deep imaging of its environment that it stands out as an important step in testing the results of these numerical simulations.
3 NACO adaptive optics imaging
3.1 Observations
We have chosen to adapt our observation technique depending on the angular distance to the star. Very close to the two stars, within a radius of about 20”, adaptive optics (subsequently AO) imaging allows us to reach the highest sensitivity thanks to the concentration of the companion light within the Airy disk. The contrast between the companion and the diffused light background is much more favorable than for atmosphere-limited imaging. At distances of more than 20”, the diffused light is less of a problem, and classical (non-AO) imaging is the best solution. Moreover, the degradation of the AO correction quality at such large distances from the star would not bring a significant improvement in the sensitivity. We will present our wide-field imaging observations of the environment of Cen in a forthcoming paper.
We thus observed the environment of Cen B using the Nasmyth Adaptive Optics System (NAOS, Rousset et al. rousset00 (2000); Rousset et al. rousset03 (2003)) of the Very Large Telescope (VLT), coupled to the CONICA infrared camera (Lenzen et al. lenzen98 (1998)). The combination of these two devices is abbreviated as NACO. NAOS is equipped with a tip-tilt mirror and a deformable mirror controlled by 185 actuators, as well as two wavefront sensors: one for visible light and one for the infrared domain. For our observations, we exclusively used the visible light wavefront sensor. The detector is a pixels ALADDIN InSb array. As its name indicates, NACO is installed at the Nasmyth focus of the Unit Telescope 4 (Yepun), the easternmost of the four 8 m telescopes of the VLT. Our observations were obtained shortly after the recoating of the primary mirror, which was executed in October 2003, in order to benefit from the best possible uniformity in reflectivity. This excellent state of the primary mirror coating allowed us to minimize the PSF light leaks, and consequently to obtain the best sensitivity. The NACO instrument offers two coronagraphic modes, based on a classical Lyot coronagraph or an innovative four-quadrant phase mask (Rouan et al. rouan00 (2000)), but due to the extreme brightness of Cen, the rejection level was insufficient for preventing the saturation of the detector. As a consequence, we preferred to use the direct imaging mode and keep the two stars outside the detector. This was achieved simply by offsetting the NACO field of view.
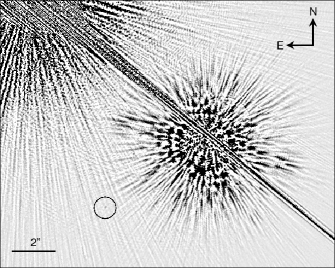
The first series of observations were obtained between February 18 and April 10, 2004. We obtained repeated short exposures of four fields arranged in a cross around B and (accidentally) one field East of A using the S13 mode of CONICA and broadband filters. The pixel scale in this mode is mas/pix (Masciadri et al. masciadri03 (2003)), giving a field of view of 13.6”13.6”. This small scale results in an excellent sampling of the PSF, with pix/PSF, an important advantage when distinguishing the point-like sources from the speckle cloud based on their dimension and shape. For all fields, the AO reference star was Cen B.
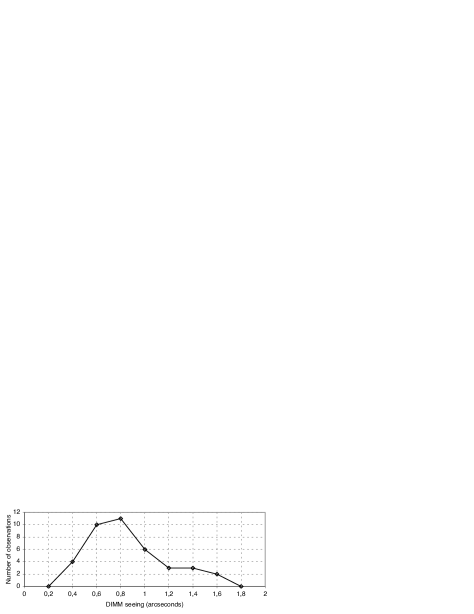
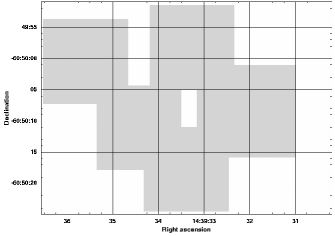
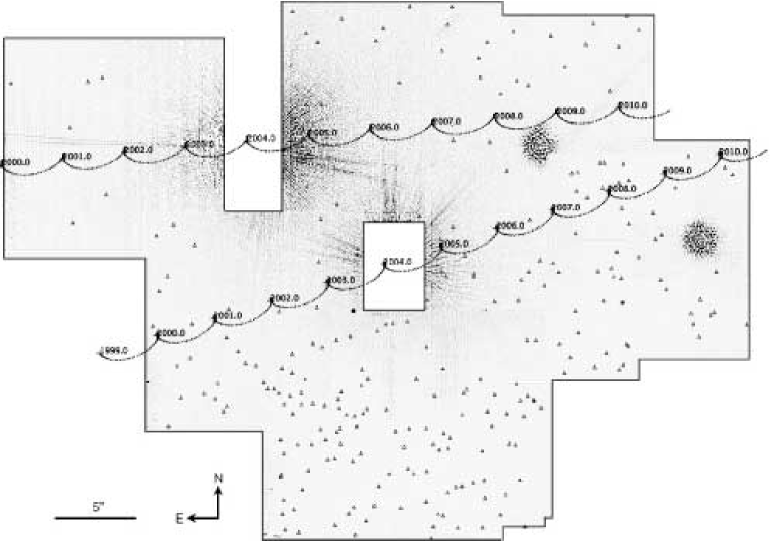
We repeated the same observations one year later in order to identify the proper-motion companions, using the filter only because all the sources identified in the and bands were also detected in . One image of the southern field was obtained in July 2004, but due to operational constraints, the remaining observations were conducted in February-March 2005. All observations were obtained using the Fowler-sampling, high-sensitivity mode of CONICA. The individual exposures were limited to 5.0 s in the band and 3.5 s in the and bands. The complete observation log is presented in Tables 3, 4, and 5, together with the seeing111available at http://archive.eso.org/asm/ambient-server observed in the visible by the DIMM (Sarazin & Roddier sarazin90 (1990); Martin et al. martin00 (2000)). Our NACO images were obtained in general under good seeing conditions, many of them at or below the 0.7” level in the visible (Fig. 1). This is a clear advantage in detecting very faint sources as the coherent energy (encircled in the core of the diffraction-limited PSF) can then rise up to 70% or more. In each field, the total integration time for each epoch varies between 10 and 20 minutes. Depending on the location around Cen, up to four epochs are available. The resulting total coverage in the , and bands is presented in Fig. 2. The and band data cover a comparatively smaller area and only one epoch was obtained in the band due to the relatively lower sensitivity compared to and . When only one epoch was obtained, the search for comoving companions is not possible (see also Sect. 6).
| Field | Date | UTa | (s)c | (”)d | AMe | |
|---|---|---|---|---|---|---|
| West B | 2004-02-18 | 7:09 | 360 | 0.48 | 1.38 | |
| West B | 2004-02-18 | 7:15 | 392 | 0.49 | 1.37 | |
| West B | 2004-02-18 | 7:21 | 322 | 0.49 | 1.35 | |
| South B | 2004-02-18 | 8:10 | 480 | 0.51 | 1.28 | |
| South B | 2004-02-18 | 8:15 | 525 | 0.56 | 1.28 | |
| South B | 2004-02-18 | 8:20 | 518 | 0.51 | 1.27 | |
| North B | 2004-02-18 | 9:03 | 320 | 0.52 | 1.24 | |
| North B | 2004-02-18 | 9:08 | 500 | 0.45 | 1.24 | |
| North B | 2004-02-18 | 9:14 | 500 | 0.54 | 1.24 | |
| East B | 2004-02-19 | 8:33 | 480 | 1.07 | 1.26 | |
| East B | 2004-02-19 | 8:54 | 525 | 0.92 | 1.25 | |
| East B | 2004-02-19 | 8:59 | 518 | 0.75 | 1.24 | |
| West B | 2004-02-20 | 6:47 | 360 | 0.72 | 1.41 | |
| West B | 2004-02-20 | 6:52 | 392 | 0.68 | 1.40 | |
| West B | 2004-02-20 | 6:59 | 322 | 0.86 | 1.38 | |
| South B | 2004-02-20 | 7:39 | 480 | 1.03 | 1.31 | |
| South B | 2004-02-20 | 7:44 | 525 | 1.03 | 1.30 | |
| South B | 2004-02-20 | 7:50 | 518 | 0.85 | 1.30 | |
| North B | 2004-02-20 | 8:38 | 480 | 0.74 | 1.25 | |
| North B | 2004-02-20 | 8:43 | 750 | 0.71 | 1.25 | |
| North B | 2004-02-20 | 8:49 | 740 | 0.71 | 1.25 | |
| East B | 2004-02-26 | 7:58 | 160 | 1.62 | 1.26 | |
| East B | 2004-02-26 | 8:03 | 175 | 1.28 | 1.26 | |
| East B | 2004-02-26 | 8:08 | 175 | 1.53 | 1.26 | |
| East A | 2004-03-12 | 7:59 | 175 | 1.37 | 1.24 | |
| East A | 2004-03-12 | 8:02 | 320 | 1.35 | 1.24 | |
| East A | 2004-03-12 | 8:04 | 175 | 1.35 | 1.24 | |
| East B | 2004-04-10 | 5:14 | 480 | 0.61 | 1.26 | |
| East B | 2004-04-10 | 5:23 | 525 | 0.58 | 1.25 | |
| East B | 2004-04-10 | 5:29 | 518 | 0.57 | 1.25 |
-
a
Average time of the observation sequence.
-
b
Selected broadband filter.
-
c
Total exposure time.
-
d
DIMM seeing measured in the visible (m).
-
e
Airmass.
| Field | Date | UT | (s) | (”) | AM | |
|---|---|---|---|---|---|---|
| South B | 2004-07-25 | 1:29 | 1008 | 0.99 | 1.37 | |
| West B | 2005-02-07 | 7:24 | 535.5 | 1.10 | 1.44 | |
| West B | 2005-02-09 | 8:22 | 535.5 | 1.05 | 1.31 | |
| South B | 2005-02-09 | 8:50 | 756 | 1.27 | 1.27 | |
| West B | 2005-02-09 | 9:46 | 535.5 | 0.95 | 1.24 | |
| East B | 2005-03-28 | 5:21 | 567 | 0.63 | 1.30 | |
| South B | 2005-03-29 | 4:04 | 756 | 0.87 | 1.45 | |
| North B | 2005-03-29 | 4:31 | 216 | 0.76 | 1.38 |
| Field | Date | UT | (s) | (”) | AM | |
|---|---|---|---|---|---|---|
| West B | 2005-07-13 | 23:30 | 787.5 | 0.75 | 1.24 | |
| West B | 2005-07-13 | 23:53 | 756 | 0.82 | 1.24 |
3.2 Data processing
The processing was achieved using the IRAF package (v.2.12). The images obtained on each night were dark-subtracted and flat-fielded with standard infrared astronomical techniques. No sky subtraction was done, as the inhomogeneous diffused light from Cen largely dominates the sky background level, even in the band (see Sect. 3.4). We interpolated the bad pixels and mosaicked the dither pattern using the bright sources visible in each field as references. The observed drift rate remains below 30 mas.hr-1 for all fields (less than 2.5 pixels, or half the FWHM of the PSF). This is a remarkable performance for such a large and massive instrument and telescope configuration. For the northern field in the band, no source was detected in each individual frame, so the registration was achieved using the offsets measured on the and band images. This procedure is justified by the fact that the observed relative drifts were identical in the three bands. In any case, no source was detected in the northern field in the combined band image. Bright artefacts (“ghosts”) are present in the images of the fields located to the west of both stars. They are probably caused by reflections and interferences in the semi-reflective beam splitters used to separate the visible light (used for wavefront sensing) from the infrared.
3.3 Astrometric calibration
The astrometric referencing of narrow-field NACO images of a fast-moving source such as Cen (yr) is not a straightforward task. It is made all the more difficult as all direct images of the pair are heavily saturated. As a consequence, there are no astrometric reference stars sufficiently close to the pair to attach the NACO images to a solid astrometric reference.
We thus based our absolute astrometric calibration on the computed positions of the Cen B star using the initial Hipparcos position at J1991.25 to determine the ICRS astrometric position of the barycenter. Then the positions of Cen B are computed at any other epoch with the orbital elements from Pourbaix (pourbaix00 (2000)) and proper motion measurements from the Hipparcos satellite (ESA esa97 (1997)). These positions take into account the combined effect of the parallactic apparent displacement, proper motion, and orbital motion of the pair. It should be noted that, even though the resulting apparent displacement is particularly complicated, the accuracy of the available astrometric elements is such that they do not limit the astrometric calibration of our images. As an illustration of the complexity of the apparent motion of Cen A and B, Fig. 4 shows the ICRS positions of the two stars on the sky for the period 1999-2010.
To transfer the reference coordinates of Cen B to the detected
background sources, we used as an intermediate step the HST-ACS coronagraphic
images publicly available from the ST-ECF archive facility. These images present
the advantage of simultaneously showing an attenuated image of the occulted
Cen B, as well as several background sources that are detectable
on our NACO images. We chose the brightest of these sources, which is also the nearest
to Cen B, numbered 167 in our catalogue (Table Deep imaging survey of the environment of Centauri).
This ACS image was obtained on 15 June 2004, for which date we computed the ICRS
position of B to be
14:39:32.953 -60:50:08.65,
thus giving the following coordinates for star #167:
14:39:33.567 -60:50:11.57.
Knowing the absolute sky coordinates of each star, a ”world
coordinate system” (wcs) was defined for each image based on the measured
position, the pixel scale of the camera, and the orientation of the field of view
( axis aligned along the north-south direction). The relative astrometric accuracy
over the HST-ACS field is better than 5 mas, therefore introducing a negligible
uncertainty in the coordinate transfer.
We would like to stress here that the wcs used for all our images is linked to the computed position of Cen B on 15 June 2004. Any modification of the computed astrometric position of for this date can be transferred to the source catalogue using a simple translation. Given the small size of the field, we expect an absolute astrometric accuracy better than ” from this very simple astrometric reduction. However, the relative position accuracy of the different sources within the same NACO field is much better, with an estimated ” (2 pixels). The orientation of true north of the S13 camera of NACO was found to be extremely stable and accurate by Chauvin et al. (chauvin05 (2005)), with an undetectable deviation of less than 0.1∘ from the true north-south direction over a period of more than one year (Nov. 2002-Mar. 2004). The uncertainty of the scale is estimated to be less than 0.2%, giving at most one pixel over a field of 30 arcsec.
3.4 Diffused light
The main limitation to the sensitivity of imaging close to bright sources is caused by diffused light. It is mostly created inside the telescope and the instrument by imperfect optics and baffling. For the preparation of adaptive optics observations of bright sources, it is important to know the properties of the diffused light to prevent saturation of the detector.
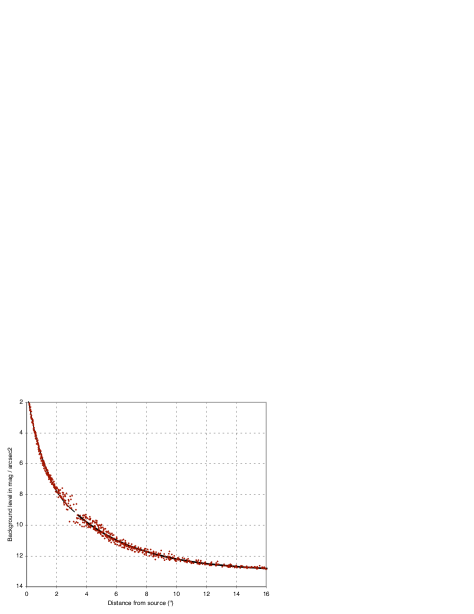
To study its profile in our images, we considered the field located south of Cen B, thereby avoiding the contamination by the light from Cen A, which is particularly strong in the northern and eastern fields. A difficulty in measuring the diffused light is that a number of artefacts create local biases. For instance, the large spikes produced by the secondary spider and the ghost reflections visible in the western images should not be included in the background estimation. We thus sampled the background level manually to avoid these artefacts. The result was a series of samples in each band, with the angular distance from Cen B and the camera counts (in ADUs). These measurements were then converted to magnitudes per squared arcsec taking into account the exposure time ( s in , 3.5 s in and ), the pixel size (”), and the photometric zero point for the night (ZPJ=23.95, ZPH=23.85, ZPKs=22.95). In order to obtain a calibrated model that can be applied to other sources, we normalized the resulting magnitudes to a zero magnitude source using the apparent magnitudes (B) of Cen B listed in Table 1. The expression of the measured sky-backgound contrast (in mag.arcsec-2) is therefore:
| (1) |
We subsequently computed a least-square fit to our data using an exponential model of the form:
| (2) |
As shown in Fig. 5, this type of model is a good match to the observed distribution. The resulting best-fit values of the coefficients are listed for each band in Table 6. The profiles obtained in the three bands are very similar, and they show a relative flux level with respect to the central source of mag.arcsec-2 at a distance of 3”. To extend our diffused background model closer to the central star, we took advantage of the unsaturated acquisition images (left part of Fig. 5). It is interesting to note that the estimated brightness at a large distance from the star tends asymptotically to mag/arcsec2, which is close to the typical Paranal sky brightness level in the band.
| (”) | (”) | (”) | (”) | |
|---|---|---|---|---|
| -7.281 | -7.969 | -8.035 | -9.068 | |
| -0.163 | -0.194 | -0.228 | -0.638 | |
| 13.226 | 13.247 | 13.018 | 10.305 |
3.5 Source extraction and photometry
The greatest difficulty in extracting sources from the diffused light of Cen is to separate the background inhomogeneities from the true point-like sources. We first high-pass-filtered the combined images using the ring median filter of IRAF (Secker secker95 (1995)). By adjusting the ring radius precisely to the radius of the PSF, it is possible to isolate the smooth, low spatial frequency diffused light and remove it from the image. This filtering allows a much more robust identification of the point-like sources. With only 252 sources in total, a visual identification was found to be more efficient than an automated detection algorithm. We used the band images for this identification, as all sources detected in and were also detected in this band.
The difficulty with automated source identification is to adapt the sensitivity to the rapidly changing background level depending on the distance to the star. The identification of the sources was thus achieved using the blinking of the ring median-filtered versions of the combined NACO images obtained in the , , and bands. The availability of images obtained through several filters is a big advantage, as the fixed speckle cloud scales with the observation wavelength.
We derived aperture photometry for the detected sources using IRAF. We also attempted the PSF-fitting technique, but due to the large perturbations of the PSF shape by high spatial-frequency speckles close to the two stars, the result of the star subtraction was not satisfactory. We chose tight apertures of 24, 12, and 10 pixels in diameter (0.32”, 0.16”, and 0.13”), respectively for the , , and bands, in order to reduce our sensitivity to the background fluctuations. By using such small apertures, we became more sensitive to the quality of the AO correction; but thanks to the brightness of the source and the generally good seeing, the Strehl ratio was relatively stable over our observations. The background level itself was estimated from the median flux of a ring of 50, 30, and 20 pixels in diameter (respectively for , , and ) and 10 pixels in thickness (in all cases).
The computation of the aperture correction was achieved on one of the brightest sources of our catalogue in the western field (star #27 in Table Deep imaging survey of the environment of Centauri). This source is located far enough (12”) from Cen B so that the local background can be considered as flat. The resulting aperture correction of , consistent in all three bands, was applied to the derived magnitudes. The photometric zero points were taken from ESO’s routine instrument monitoring program. This is justified by the fact that the nights during which our observations were obtained were all of photometric quality. Considering the inhomogeneity of the background over which the photometry is measured, the contribution from the uncertainty to the photometric zero points is negligible. The airmass corrections were neglected: using the 2MASS values determined by Nikolaev et al. (nikolaev00 (2000); , , mag/airmass, relative to unity airmass), they are always smaller than 0.05 magnitudes in all three bands. In order to account for the Strehl ratio fluctuations, background inhomogeneity, and aperture correction uncertainty, a conservative systematic error was added to the statistical error bars listed in Table Deep imaging survey of the environment of Centauri: mag on the band magnitudes (due to the relatively stronger diffused background) and mag on the and magnitudes.
3.6 Sensitivity
The definition of the sensitivity of our search for companions around a binary star like Cen is more difficult than for a single star. The presence of the combined diffused light from Cen A and B in the NACO fields complicates the estimation of limiting magnitudes, as they become dependent on the position relative to the two bright stars.
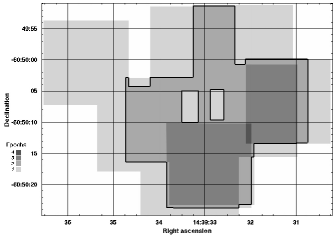
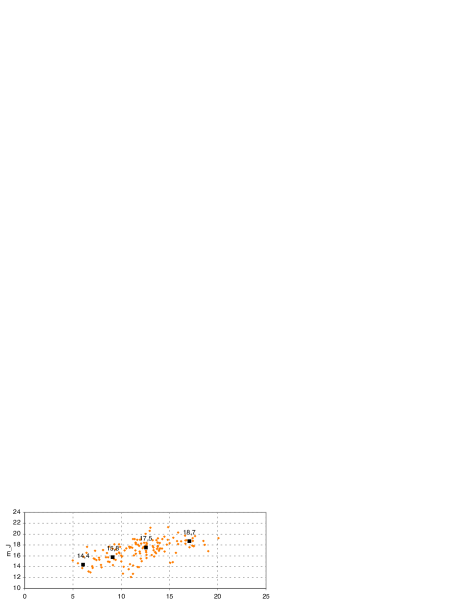
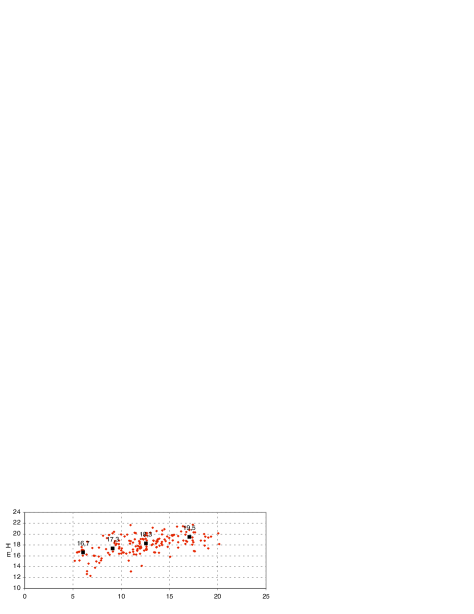
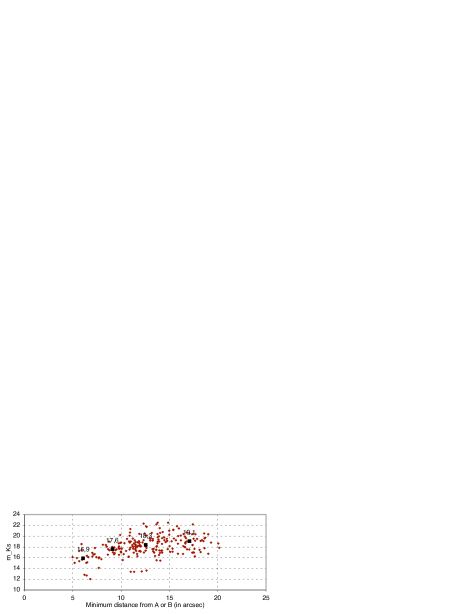
We thus preferred to take advantage of the significant number of detected sources to derive a posteriori statistical properties and estimate the true sensitivity of our imaging survey. As shown in Fig. 6, the magnitudes of the faintest sources at angular distances larger than 10” from A and B are in the band and in the and bands. Note that several very faint and/or close-in sources, while they were clearly detected in the images, could not be measured by aperture photometry. To define our practical limiting magnitude, we chose to consider the median magnitude of the detected sources. This definition has the advantage of giving an empirical, statistically meaningful definition of the sensitivity, which can be expressed as a function of the distance to the two bright stars by computing the median within angular distance bins. Figure 6 shows the median of the detected object magnitudes in the , and bands for four angular distance bins: ”, ”, ”, and ” as solid squares. The retained angular distance is the minimum of the source distances to A and B so as to account for the “saddle” shape of the diffused light from the two stars. In all bands, the limiting magnitudes at large angular distances are in the range. They decrease to , , and at 6”.
We can compare these sensitivities with previous AO studies of the environment of bright stars. Using the same NACO instrument, Chauvin et al. (chauvin05 (2005)) obtained a depth of around HIP 6856 () using an exposure of s. With our typical exposures of s, we are affected by additional readout noise, but the longer total exposure time compensates for this loss. On the bright single star Vega ( in all bands), Metchev et al. (metchev03 (2003)) used the PALAO system installed at the 5 m Hale reflector at Mount Palomar in the , and bands. With limiting magnitudes of at 20” and at 10”, their study is slightly less sensitive than ours, but this can be explained by the smaller aperture. Macintosh et al. (macintosh03 (2003)) observed the same star using the Keck AO system and reach a deeper at 20”, at 10”, and at 7”, using a s exposure. These figures are comparable to our results, although Vega is fainter by about 0.5 mag than Cen B in the infrared. From these comparisons, it appears that NACO is a well-suited instrument for studying the environment of bright stars, as its diffused light signature is relatively low (see also Sect. 3.4). In addition, the structure of the fixed-pattern speckle halo created by the monolithic primary mirror of the VLT-UT4 telescope appears smoother than with the Keck telescope’s segmented primary mirror, thus making the identification of close companions easier.
4 HST archive data
As a complement to our NACO images, we searched the ESO/ST-ECF archive for images of Cen. We subsequently analyzed the available data, that were obtained using three HST instruments: ACS, NICMOS and WFPC2. In this Section, we present briefly our results.
4.1 ACS
A series of images was obtained centered on Cen A star in September 2003 using the Advanced Camera for Surveys (ACS) onboard the Hubble Space Telescope, and these observations were repeated in January 2004 to check for the presence of proper motion companions. The same repeated series of images were obtained for Cen B behind the coronagraphic mask in June 2004 and August 2004. In each case, eight images were recorded at eight wavelengths between and 1024 nm, with the FR914M broad ramp filter wheel (bandwidth of 9%).
Using the coronagraphic mode of this instrument, the principle of the foreseen data analysis was to use the fact that the PSF of the instrument changes homothetically with the wavelength to remove most of the fixed-pattern speckle noise. As the position of the potential companions does not depend on the wavelength, their signature can be extracted more efficiently from the speckle noise than with a single image. This method is a particular application of the spectral deconvolution technique developed by Sparks & Ford (sparks02 (2002)). However, only one star of the Cen pair at a time can be aligned with the coronagraphic spot. This results in a considerable amount of diffused light from the other, non-masked star, which also scales with the wavelength but with a different homothetic center. The application of the spectral deconvolution method is also made difficult by the slight undersampling of the PSF and by the availability of narrow-band filters instead of the continuous spectral coverage provided by a dispersive spectro-imaging instrument.
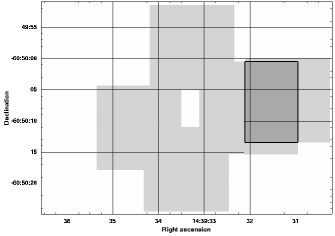
The pre-processing was achieved using the automated pipeline available at the HST archive. The images were subsequently co-added and filtered using the same procedure as the NACO images (Sect. 3.5). An extract of the Cen B centered co-added coronagraphic image is presented in Fig. 3. Over a total field comparable to our NACO images, the number of objects detected in the ACS images is less than 10% of the NACO catalogue, corresponding to the brightest objects. We therefore limited our use of the ACS images to the definition of an accurate astrometric coordinate system (see Sect. 3.3).
4.2 NICMOS
The HST-NICMOS instrument (Thompson et al. thompson98 (1998)) is based on an infrared HgCdTe 256x256 pixel array sensitive over the 0.8-2.5 m range. Two series of exposures were taken through four filters on 19 October 1998 ( Cen B) and 22 October 1998 ( Cen A). The star images were positioned on the detector surface without a coronagraphic mask, producing heavy saturation within a radius of 2-3 arcsec around each star. The absence of a second observation makes it impossible to ascertain the comoving nature of potential companions. The complexity of the HST-NICMOS PSF (Krist et al. krist98 (1998)) limits the sensitivity close to the star. Being too distant in time, there is no overlap between our NACO fields and these HST-NICMOS data. For these reasons, we decided not to include the NICMOS data in the present study.
4.3 WFPC2
The Wide Field and Planetary Camera 2 (WFPC2) is a two-dimensional imaging photometer that covers the spectral range between 115 to 1050 nm. Several accepted GTO and open time proposals, in particular by Ford et al. and Henry et al. in HST Cycles 4 to 7 resulted in a large amount of collected data. A total of 11 images centered on Cen A were obtained in 1995 over two epochs (around May and August) in the F547M, F555W, F814W, and F850LP filters. In 1997, another series of 10 images was recorded, this time through the F953N and F1042M filters. The same sequences were also obtained with the WFPC2 field centered on Cen B. As for the NICMOS data, these observations are too far in time from our NACO images, and there is almost no overlap between the fields. Therefore, we preferred not to include them in this study.
5 Catalogue of the detected sources
Table Deep imaging survey of the environment of Centauri lists the positions and magnitudes of all the sources detected in the NACO images of Cen. The right ascension and declination refer to the ICRS and are not corrected for possible parallax. The epoch is J2004.5, corresponding to the mean observation time for stars observed in successive frames. As explained earlier, the typical positional uncertainty is not larger than 0.1 arcsec. The relatively high surface density of the detected objects can be explained by the fact that Cen lies almost exactly in the Galactic plane and in a direction close to the Galactic center. This catalogue fills part of a long-standing “hole” in sky atlases, due to the diffused light from Cen.
6 Proper-motion companion search
The very fast proper motion of Cen should allow its comoving companions to be identified quickly. However, this is also a drawback due to the particularly dense star field around this binary star. The identification of the companion is not a trivial task because of the combination of the unknown orbital motion of the putative companion with the large proper motion and parallactic displacement of Cen. Considering that Cen moves an average of approximately one NACO pixel per day, the best strategy would to observe the fields repeatedly with a time separation of 2 to 3 weeks. Unfortunately, due to scheduling constraints, our observations could not follow this scheme, and our first and second epochs were separated by about 10 months. The second and third series were separated by 5 months. Over these durations, the displacement of Cen was considerable, resulting in a rather poor overlap of the different fields. Moreover, the diffused light from the two stars resulted in a moving zone of decreased sensitivity over part of the field.
In order to systematically search for statistically significant proper-motion companions, we applied the following procedure:
-
1.
We converted the intensity images into SNR images, using the local background noise (mostly made of residual speckles). This allowed us to select only the sources that present an SNR of more than 3 per pixel, compared to the local noise, and a PSF shape (first a priori). For each epoch and each color, we therefore obtained a map of all point-like sources above the local noise.
-
2.
The sources that could be identified at the same position on the sky at different epochs are background sources, so they were eliminated from our sample.
-
3.
The second a priori knowledge that we can use is that any companion to Cen will move on a Keplerian orbit. Therefore, its maximum orbital motion rate is set by the third Kepler law and can be expressed as a function of the angular distance from the star:
(3) where is the distance of the star, its mass, and the universal gravitational constant. A numerical application for Cen results in the following maximum orbital motion:
(4) where is in arcsec/yr and in arcsec. Between two measurement epochs, we can therefore define a ”possible orbital motion disk”, centered on each identified point source, whose radius depends on the time lapse between the two epochs. The intersection of these disks with the list of identified sources in the following epoch allowed us to significantly reduce the number of candidate companions to just a few.
-
4.
Eventually, the careful examination of the time evolution of the positions of the residual candidate companions allows the unphysical orbits to be rejected.
From this selection process, we could not identify any comoving companion within our overlapping regions. For only one source we were able to obtain a significant detection (more than 4 per pixel above the local noise) at epoch 2005.104, while no source was apparent at epoch 2004.137. Its ICRS coordinates are 14:39:32.118 -60:50:08.60, and its magnitude is estimated at . However, we could not identify any counterpart of this source within the “orbital circle” of angular radius , as defined in step 3 of our identification procedure. This source could be a distant variable star or a faint solar system object. We have not included it in the catalogue due to its unconfirmed nature.
7 Discussion
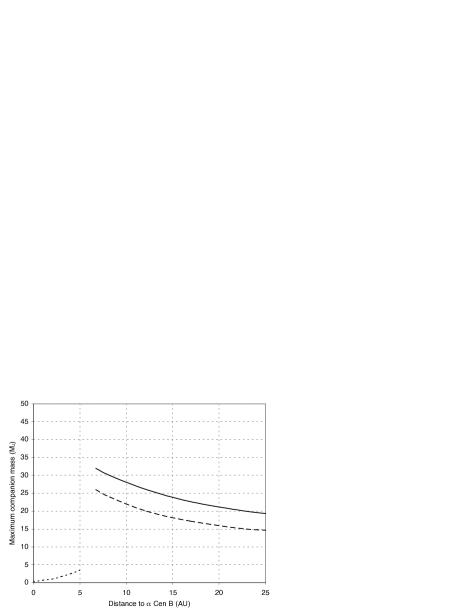
Massive substellar objects, as opposed to terrestrial planets, are detectable at very large distances from their parent star, as their magnitude is set by their intrinsic emission rather than by the reflected light. The age of the Cen system is 5 Gyr, as determined by Thévenin et al. (thevenin02 (2002)) and confirmed by the interferometric diameters of the two stars (Kervella et al. kervella03 (2003)). Assuming a mass of 30 , a 5 Gyr-old giant planet has absolute magnitudes of and , from evolutionary models by Baraffe et et al. (baraffe03 (2003)). At the distance of Cen (1.3 pc), this translates into apparent magnitudes and , which were within reach of our NACO imaging search down to an angular separation of ” from Cen B (Fig. 6). Figure 7 gives the limiting sensitivity of our search in terms of companion mass, based on model magnitudes in the band from Baraffe et et al. (baraffe03 (2003)), and the median magnitudes given in Fig. 6 (bottom). These are conservative estimates, considering that many sources that are fainter by up to two magnitudes have been detected in our images.
Murdoch et al. (murdoch93 (1993)) searched Cen A and B for the radial velocity signature of BD companions with orbital periods days, but with a negative result. Using improved measurements obtained over a period of 5.5 years, Endl et al. (endl01 (2001)) concluded that no planet more massive than a few Jupiter masses, in projected value, is orbiting either Cen A or B within 4 AU. If we follow the conclusions of Hale (hale94 (1994)) that the equatorial planes of A and B are probably coplanar with the binary orbit plane, and if we accept the hypothesis that exoplanets orbit in the equatorial plane of their parent star, then this projected mass value becomes a solid mass limit. The band search with the HST by Schroeder et al. (schroeder00 (2000)), which did not detect any companion, was limited to a sensitivity of , corresponding to 40 . Note however that the third star of the Cen system Proxima probably does not host giant planets. This and other low mass stars were extensively scrutinized for any radial velocity variation, but did not show any (Kürster et al. kurster03 (2003)). Moreover, speckle-interferometry and imaging surveys (Leinert et al. leinert97 (1997); Oppenheimer et al. oppenheimer01 (2001)) failed to identify companions down to the BD masses around several low mass stars. Within our sensitivity and coverage limitations, our negative result leads toward the modeling results of Wiegert & Holman (wiegert97 (1997)), who conclude that stable companion orbits may not exist beyond about 3 AU from each component of the Cen pair.
8 Conclusion
We have obtained deep adaptive-optics images of the close environment of Cen A and B. From these images, we did not identify any comoving companion, but we assembled a catalogue of 252 faint background objects. Within the explored area, this negative result sets an upper mass limit of 20-30 to the possible substellar companions orbiting Cen B. If companions of Cen B exist, they are likely to orbit close to the star (within 5 AU) and to be less massive than a few times Jupiter (from radial velocity surveys). They could also be fainter than the current imaging search-limiting magnitude, but from Baraffe et al. (baraffe03 (2003)), a 5 Gyr-old, intermediate-mass exoplanet (5 ) around Cen has an apparent magnitude of , and , fully out of reach of the deepest imaging searches. Stars younger than Cen could be more favorable targets, as the brightness of massive exoplanets is predicted to decrease steeply with time. However, the faintness of the detected background sources confirms the capabilities of modern adaptive optics instruments like NACO for exploring the close environment of very bright stars and for searching for massive exoplanets.
Acknowledgements.
Based on observations made with the ESO Telescopes at Cerro Paranal Observatory under the Director’s Discretionary Time (DDT) programs 272.C-5010, 273.C-5041 and 275.C-5027. We are grateful to ESO’s Director General Dr. C. Cesarsky for this generous allocation of telescope time. We also wish to thank F. Namouni for fruitful discussions. This work made use of observations obtained with the NASA/ESA Hubble Space Telescope, obtained from the data archive at the Space Telescope Institute. STScI is operated by the Association of Universities for Research in Astronomy, Inc. under the NASA contract NAS 5-26555. This research made use of the SIMBAD and VIZIER databases at the CDS, Strasbourg (France), and of NASA’s Astrophysics Data System Bibliographic Services.References
- (1) Baraffe, I., Chabrier, G., Barman, T. S., Allard, F., & Hauschildt, P. H. 2003, A&A, 402, 701
- (2) Bigot, L., Kervella, P., Thévenin, F., & Ségransan, D. 2006, A&A, 446, 635
- (3) Chauvin, G., Lagrange, A.-M., Lacombe, F., et al. 2005, A&A, 430, 1027
- (4) Cochran, W. D., et al. 2002, DPS, 34, 4202
- (5) Eggenberger, A., et al. 2003, in Scientific Frontiers in Research of Extrasolar Planets, ASP Conf., Deming & Seager, eds.
- (6) Eggenberger, A., Udry, S., & Mayor, M. 2004, A&A, 417, 353
- (7) Endl, M., Kürster, M., Els, S., Hatzes, A. P., & Cochran, W. D. 2001, A&A, 374, 675
- (8) ESA, 1997, The Hipparcos and Tycho Catalogues, ESA SP-1200
- (9) Guenther D.B. & Demarque P., 2000, ApJ, 531, 503
- (10) Hale, A. 1994, AJ, 107, 306
- (11) Holman, M., Touma, J., & Tremaine, S. 1997, Nature, 386, 254
- (12) Innanen, K. A., et al. 1997, AJ, 113, 1915
- (13) Israelian, G., Santos, N., Mayor, M., & Rebolo R. 2004, A&A, 414, 601
- (14) Kamper, K. W., & Wesselink, A. J. 1978, AJ, 83, 1653
- (15) Kervella, P., Thévenin, F., Ségransan, D., et al. 2003, A&A, 404, 1087
- (16) Konacki, M. 2005, Nature, 436, 230
- (17) Kozai, Y. 1962, AJ, 67, 591
- (18) Krist, J. E., Golimowski, D. A., Schroeder, D. J., & Henry, T. 1998, PASP, 110, 1046
- (19) Kürster, M., Endl, M., Rouesnel, F., et al. 2003, A&A, 403, 1077
- (20) Leinert, Ch., Henry, T., Glindemann, A., & McCarthy, D. W. 1997, A&A, 325, 159
- (21) Lenzen, R., Hofmann, R., Bizenberger, P., & Tusche, A. 1998, Proc. SPIE 3354, 606
- (22) Macintosh, B. A., Becklin, E. E., Kaisler, D., Konopacky, Q., & Zuckerman, B. 2003, ApJ, 594, 538
- (23) Martin, F., Conan, R., et al. 2000, A&A Suppl. Ser., 144, 39
- (24) Masciadri, E., Brandner, W., Bouy, H. et al. 2003, A&A, 411, 157
- (25) Mazeh, T., Krymolowski, Y., & Rosenfeld, G. 1997, ApJ, 477, L103
- (26) Metchev, S. A., Hillenbrand, L. A., & White, R. J. 2003, ApJ, 582, 1102
- (27) Morel, P., Provost, J., Lebreton, Y., Thévenin, F., & Berthomieu, G. 2000, A&A, 363, 675
- (28) Mugrauer, M., Neuhauser, R., Seifahrt, A., Mazeh, T., & Guenther, E. 2005, A&A, 440, 1051
- (29) Murdoch, K. A., Hearnshaw, J. B., & Clark, M. 11993, ApJ, 413, 349 (1993)
- (30) Nikolaev, S., Weinberg, M., Skrutskie, et al. 2000, AJ, 120, 3340
- (31) Oppenheimer, B. R., Golimowski, D. A., Kulkarni, S. R., et al. 2001, AJ, 121, 2189
- (32) Pourbaix, D. 2000, A&A Suppl. Ser. 145, 215
- (33) Pourbaix, D., Nidever, D., McCarthy, C., et al. 2002, A&A, 386, 280
- (34) Rouan, D., Riaud, P., Boccaletti, A., Clénet, Y., & Labeyrie, A. 2000, PASP, 112, 1479
- (35) Rousset, G., Lacombe, F., Puget, P., et al. 2000, Proc. SPIE, 4007, 72
- (36) Rousset, G., Lacombe, F., Puget, F., et al. 2003, Proc. SPIE 4839, 140
- (37) Santos, N. C., Israelian, G., Mayor, M., Rebolo, R., & Udry, S. 2003, A&A, 398, 363
- (38) Sarazin, M., & Roddier, F. 1990, A&A, 227, 294
- (39) Schroeder, D. J., Golimowski, D. A., Brukardt, R. A., et al. 2000, AJ, 119, 906
- (40) Secker, J. 1995, PASP, 107, 496
- (41) Söderhjelm, S., 1999, A&A 341, 121
- (42) Sparks, W. B. & Ford, H. 2002, ApJ, 578, 543
- (43) Thévenin, F., Provost, J., Morel, P., et al. 2002, A&A, 392, L9
- (44) Thompson, R.I., M. Rieke, G. Schneider, D.C. Hines, & M.R. Corbin, 1998, ApJL , 492, L95
- (45) Wiegert, P. A. & Holman, M. 1997, AJ, 113, 1445
[x]cccccc
Position and photometry of the sources detected
around Cen. The coordinates are for J2004.5 and
refer to the ICRS.
(h:m:s) (∘:’:”)
\endfirstheadcontinued.
# (h:m:s) (∘:’:”)
\endhead1 14:39:30.257 -60:50:12.43
2 14:39:30.375 -60:50:03.19
3 14:39:30.442 -60:50:02.73
4 14:39:30.511 -60:50:09.16
5 14:39:30.531 -60:50:11.63
6 14:39:30.560 -60:50:11.80
7 14:39:30.650 -60:50:10.84
8 14:39:30.658 -60:50:13.15
9 14:39:30.705 -60:50:12.36
10 14:39:30.727 -60:50:11.71
11 14:39:30.747 -60:50:02.05
12 14:39:30.857 -60:50:03.98
13 14:39:30.935 -60:50:10.22
14 14:39:30.973 -60:50:06.87
15 14:39:30.982 -60:50:09.65
16 14:39:31.024 -60:50:07.15
17 14:39:31.046 -60:50:05.55
18 14:39:31.164 -60:49:54.27
19 14:39:31.166 -60:50:08.27
20 14:39:31.247 -60:50:06.23
21 14:39:31.249 -60:50:03.54
22 14:39:31.253 -60:50:13.74
23 14:39:31.266 -60:49:53.41
24 14:39:31.269 -60:50:13.63
25 14:39:31.296 -60:50:14.85
26 14:39:31.296 -60:50:02.54
27 14:39:31.304 -60:50:11.06
28 14:39:31.309 -60:50:05.24
29 14:39:31.313 -60:50:09.55
30 14:39:31.331 -60:50:15.18
31 14:39:31.334 -60:50:03.68
32 14:39:31.335 -60:49:55.34
33 14:39:31.349 -60:50:07.94
34 14:39:31.376 -60:50:09.47
35 14:39:31.394 -60:50:08.96
36 14:39:31.398 -60:50:03.96
37 14:39:31.407 -60:49:58.04
38 14:39:31.436 -60:50:14.15
39 14:39:31.456 -60:50:02.46
40 14:39:31.461 -60:50:10.91
41 14:39:31.469 -60:50:04.00
42 14:39:31.492 -60:50:02.44
43 14:39:31.509 -60:50:09.13
44 14:39:31.536 -60:50:15.01
45 14:39:31.550 -60:49:53.86
46 14:39:31.599 -60:50:04.59
47 14:39:31.614 -60:49:55.21
48 14:39:31.674 -60:50:12.89
49 14:39:31.679 -60:50:03.02
50 14:39:31.690 -60:50:04.19
51 14:39:31.697 -60:50:06.79
52 14:39:31.701 -60:50:11.55
53 14:39:31.730 -60:50:03.09
54 14:39:31.741 -60:50:14.40
55 14:39:31.788 -60:49:56.54
56 14:39:31.793 -60:50:15.38
57 14:39:31.835 -60:50:13.58
58 14:39:31.842 -60:50:09.19
59 14:39:31.888 -60:50:08.63
60 14:39:31.906 -60:49:54.64
61 14:39:31.960 -60:50:10.06
62 14:39:31.989 -60:50:17.53
63 14:39:31.997 -60:50:08.50
64 14:39:32.029 -60:50:13.35
65 14:39:32.049 -60:50:17.08
66 14:39:32.084 -60:50:05.95
67 14:39:32.093 -60:50:09.17
68 14:39:32.095 -60:49:57.70
69 14:39:32.100 -60:50:16.77
70 14:39:32.105 -60:50:13.34
71 14:39:32.122 -60:50:24.82
72 14:39:32.132 -60:50:18.03
73 14:39:32.154 -60:50:09.65
74 14:39:32.160 -60:50:17.06
75 14:39:32.165 -60:50:21.96
76 14:39:32.178 -60:50:10.91
77 14:39:32.191 -60:49:57.41
78 14:39:32.196 -60:50:16.04
79 14:39:32.203 -60:50:19.80
80 14:39:32.222 -60:49:54.39
81 14:39:32.256 -60:50:19.74
82 14:39:32.276 -60:50:17.89
83 14:39:32.276 -60:50:02.93
84 14:39:32.285 -60:50:22.85
85 14:39:32.329 -60:49:58.21
86 14:39:32.330 -60:50:24.11
87 14:39:32.379 -60:50:16.73
88 14:39:32.381 -60:50:10.99
89 14:39:32.401 -60:50:18.66
90 14:39:32.419 -60:50:01.17
91 14:39:32.439 -60:50:17.77
92 14:39:32.441 -60:49:55.03
93 14:39:32.459 -60:50:23.06
94 14:39:32.468 -60:50:21.98
95 14:39:32.481 -60:50:24.86
96 14:39:32.484 -60:50:20.17
97 14:39:32.497 -60:50:15.77
98 14:39:32.499 -60:49:57.24
99 14:39:32.512 -60:49:56.03
100 14:39:32.553 -60:50:09.28
101 14:39:32.555 -60:50:09.43
102 14:39:32.561 -60:50:22.14
103 14:39:32.615 -60:50:16.36
104 14:39:32.631 -60:50:08.17
105 14:39:32.640 -60:50:16.60
106 14:39:32.648 -60:50:17.94
107 14:39:32.653 -60:50:22.34
108 14:39:32.686 -60:50:24.89
109 14:39:32.704 -60:50:22.37
110 14:39:32.726 -60:50:01.05
111 14:39:32.729 -60:50:06.40
112 14:39:32.738 -60:49:52.85
113 14:39:32.755 -60:50:19.36
114 14:39:32.771 -60:50:20.01
115 14:39:32.775 -60:50:22.75
116 14:39:32.777 -60:49:53.95
117 14:39:32.789 -60:50:09.45
118 14:39:32.811 -60:50:19.09
119 14:39:32.815 -60:50:24.17
120 14:39:32.816 -60:50:15.12
121 14:39:32.824 -60:50:09.15
122 14:39:32.824 -60:49:55.56
123 14:39:32.840 -60:50:07.19
124 14:39:32.847 -60:50:20.09
125 14:39:32.855 -60:50:24.07
126 14:39:32.887 -60:50:16.77
127 14:39:32.896 -60:50:24.83
128 14:39:32.898 -60:50:19.76
129 14:39:32.913 -60:50:25.54
130 14:39:32.945 -60:50:10.90
131 14:39:32.951 -60:50:21.44
132 14:39:32.954 -60:50:13.79
133 14:39:32.958 -60:50:23.30
134 14:39:32.958 -60:50:18.80
135 14:39:33.014 -60:50:05.71
136 14:39:33.038 -60:50:15.74
137 14:39:33.061 -60:50:21.57
138 14:39:33.092 -60:49:52.87
139 14:39:33.099 -60:50:18.78
140 14:39:33.109 -60:50:21.29
141 14:39:33.114 -60:50:12.22
142 14:39:33.141 -60:50:19.90
143 14:39:33.167 -60:50:23.69
144 14:39:33.179 -60:49:57.53
145 14:39:33.212 -60:50:18.95
146 14:39:33.237 -60:50:12.29
147 14:39:33.265 -60:50:21.57
148 14:39:33.288 -60:50:17.69
149 14:39:33.292 -60:50:12.37
150 14:39:33.317 -60:49:54.18
151 14:39:33.333 -60:50:00.36
152 14:39:33.353 -60:50:22.36
153 14:39:33.368 -60:50:12.77
154 14:39:33.379 -60:49:54.96
155 14:39:33.392 -60:50:23.52
156 14:39:33.444 -60:50:15.73
157 14:39:33.453 -60:50:17.61
158 14:39:33.460 -60:50:24.45
159 14:39:33.486 -60:50:17.87
160 14:39:33.495 -60:50:15.18
161 14:39:33.502 -60:50:16.15
162 14:39:33.506 -60:50:20.31
163 14:39:33.538 -60:50:18.66
164 14:39:33.551 -60:50:25.31
165 14:39:33.555 -60:50:18.03
166 14:39:33.562 -60:50:23.63
167 14:39:33.567 -60:50:11.57
168 14:39:33.571 -60:50:20.84
169 14:39:33.591 -60:50:13.11
170 14:39:33.606 -60:50:24.01
171 14:39:33.624 -60:50:17.95
172 14:39:33.665 -60:49:53.58
173 14:39:33.669 -60:50:16.53
174 14:39:33.676 -60:50:19.72
175 14:39:33.680 -60:50:18.78
176 14:39:33.687 -60:50:17.54
177 14:39:33.696 -60:50:17.01
178 14:39:33.707 -60:50:05.00
179 14:39:33.709 -60:50:19.01
180 14:39:33.713 -60:50:13.35
181 14:39:33.725 -60:50:24.73
182 14:39:33.727 -60:50:20.64
183 14:39:33.785 -60:50:20.70
184 14:39:33.803 -60:50:19.48
185 14:39:33.811 -60:50:17.41
186 14:39:33.831 -60:50:13.80
187 14:39:33.836 -60:49:58.82
188 14:39:33.841 -60:50:05.90
189 14:39:33.845 -60:50:18.84
190 14:39:33.861 -60:50:08.55
191 14:39:33.868 -60:49:55.04
192 14:39:33.876 -60:50:11.32
193 14:39:33.909 -60:50:13.59
194 14:39:33.910 -60:50:17.24
195 14:39:33.919 -60:50:19.77
196 14:39:33.945 -60:50:21.36
197 14:39:33.956 -60:50:03.90
198 14:39:33.965 -60:49:54.50
199 14:39:33.968 -60:49:58.86
200 14:39:33.976 -60:50:15.80
201 14:39:33.999 -60:50:22.55
202 14:39:34.005 -60:50:17.33
203 14:39:34.006 -60:50:16.59
204 14:39:34.028 -60:50:25.17
205 14:39:34.037 -60:50:19.77
206 14:39:34.068 -60:50:23.75
207 14:39:34.077 -60:50:17.89
208 14:39:34.079 -60:49:53.16
209 14:39:34.083 -60:50:15.38
210 14:39:34.083 -60:50:14.19
211 14:39:34.101 -60:50:16.77
212 14:39:34.144 -60:50:24.99
213 14:39:34.152 -60:50:17.32
214 14:39:34.153 -60:50:20.33
215 14:39:34.155 -60:50:23.22
216 14:39:34.163 -60:50:24.03
217 14:39:34.168 -60:50:15.10
218 14:39:34.175 -60:50:21.65
219 14:39:34.181 -60:50:21.76
220 14:39:34.182 -60:50:19.49
221 14:39:34.191 -60:50:11.60
222 14:39:34.193 -60:50:16.60
223 14:39:34.235 -60:50:16.35
224 14:39:34.290 -60:50:16.34
225 14:39:34.322 -60:50:15.95
226 14:39:34.389 -60:50:14.93
227 14:39:34.476 -60:50:14.77
228 14:39:34.538 -60:50:14.05
229 14:39:34.616 -60:50:11.46
230 14:39:34.631 -60:50:17.45
231 14:39:34.634 -60:50:13.18
232 14:39:34.661 -60:50:17.75
233 14:39:34.709 -60:50:16.04
234 14:39:34.732 -60:50:16.97
235 14:39:34.826 -60:50:16.65
236 14:39:34.906 -60:50:07.49
237 14:39:34.928 -60:50:12.36
238 14:39:34.941 -60:50:14.45
239 14:39:35.022 -60:50:16.89
240 14:39:35.055 -60:50:14.96
241 14:39:35.082 -60:50:06.27
242 14:39:35.124 -60:50:18.65
243 14:39:35.131 -60:50:09.45
244 14:39:35.202 -60:50:10.35
245 14:39:35.224 -60:50:06.92
246 14:39:35.256 -60:50:12.48
247 14:39:35.648 -60:50:04.41
248 14:39:35.682 -60:49:57.24
249 14:39:35.802 -60:49:57.48
250 14:39:35.929 -60:50:06.15
251 14:39:35.956 -60:50:00.28
252 14:39:36.451 -60:49:57.58