Faint X-ray Structure in the Crab Pulsar-Wind Nebula
Table 1: The Chandra Observation
Table 2: Power-law Fits
Table 3: Magnetic Fields and Lifetimes
Abstract
We report on a Chandra observation of the Crab Nebula that gives the first clear view of the faint boundary of the Crab’s X-ray-emitting Pulsar Wind Nebula, or PWN. There is structure in all directions. Fingers, loops, bays, and the South Pulsar Jet all indicate that either filamentary material or the magnetic field are controlling the relativistic electrons. In general, spectra soften as distance from the pulsar increases but do not change rapidly along linear features. This is particularly true for the Pulsar Jet. The termination of the Jet is abrupt; the E side is close to an [O III] optical filament which may be blocking propagation on this side. We argue that linear features have ordered magnetic fields and that the structure is determined by the synchrotron lifetime of particles diffusing perpendicular and parallel to the magnetic field. We find no significant evidence for thermal X-rays inside the filamentary envelope.
1 The Crab Pulsar Wind Nebula
The Crab Nebula was one of the first extrasolar sources known to emit X-rays. It was detected with a rocket-borne detector on 1962 October 12 (Gursky et al. 1963), recognized in data from a flight on 1963 April 29 (Bowyer et al. 1964a) and observed again during a 1964 July 7 lunar occultation. The occultation showed the X-ray source to have an extent of and to be located at the center of the optical nebula (Bowyer et al. 1964b). The morphology of the source has since been measured with increasingly better resolution by a second lunar occultation (Palmieri et al. 1975; Wolff et al. 1975) and imaging telescopes on Einstein (Harnden & Seward 1984; Brinkmann, Aschenbach, & Langmeier 1985), ROSAT (Hester et al. 1995), and Chandra (Weisskopf et al. 2000; Hester et al. 2002). The Crab Pulsar appears as an unresolved source somewhat SE of the bright center and the pulsar rotational energy loss of ergs s-1 supplies energy to the surrounding nebula which, in turn, radiates ergs s-1 over the electromagnetic spectrum - from radio to gamma rays. The nebula’s spectrum is nonthermal throughout; a photon power law with slope of -1.25 from radio to infrared and a steeper slope of -2 at the higher energies. The power law spectrum and optical and X-ray polarization (Hiltner 1957; Weisskopf et al. 1976) show that the diffuse emission surrounding the pulsar is synchrotron radiation from highly energetic electrons moving in a magnetic field. This pulsar-wind nebula, or PWN, is the brightest PWN in our galaxy.
The X-ray photon spectrum of the Crab PWN, , in the photon energy range keV is a power law characterized by and has been steady enough to serve as an in-flight calibration source (Toor & Seward 1974). As photon energy increases, the PWN gets smaller and gradually increases (Strickman, Johnson, & Kurfess 1979; Hillas et al. 1998). In the 1-10 kev band only 5% of the radiation is from the pulsar itself. Most of the PWN X-rays come from a torus (Brinkmann, Aschenbach, & Langmeier 1985) surrounding the pulsar and is thought to be in the equatorial plane of the spinning neutron star. A jet aligned with the pulsar spin axis is prominent and there are X-rays from the immediate surroundings. The bright torus consists of many outward moving rings and knots (Hester et al. 1995, 2002). There also appears to be an outward flow but the details of energy transfer are sketchy. Mori et al. (2004) have derived spectra of X-rays from the torus and jet and, because they are similar, propose that the acceleration of electrons by the pulsar is the same in both radial and axial directions.
The transfer of energy from the pulsar to the PWN and then to the EM spectrum was outlined by Rees & Gunn (1974) and by Kennel & Coroniti (1984) using MHD models and spherical symmetry. The relativistic wind from the pulsar is thought to expand freely until it terminates in a shock wave, which is necessary because the synchrotron nebula is confined in the cage of optical filaments expanding at a velocity km/s. The bright X-ray ring closest to the pulsar is presumably the location of the relativistic shock. At this shock the particles are accelerated into a power-law spectrum (deduced from the EM power-law spectrum). After the shock, particles flow outward radiating to form the observed PWN and the outward flow slows to match the expansion velocity at the outer filamentary shell. All seaches of a larger volume have found no direct evidence for a larger shell (Frail et al. 1995; Seward, Gorenstein, & Smith 2006). As energy is lost, the synchrotron spectrum softens and indeed the size of the continuum nebula increases as wavelength of observation increases.
An ad hoc 2 -dimensional adaptation of the Kennel-Coroniti solution by Shibata et al. (2003) and two-dimension MHD simulations with prescribed radial energy flux density and magnetic field by Komissarov and Lyubarsky (2003) and Del Zanna et al. (2006) predict axial and equatorial features similar to those of the nebula. Both groups emphasize that the flow and magnetic field structure are complex with departures from spherical symmetry disrupting the classic beauty of the Rees & Gunn and Kennel & Coroniti pictures. Plasma flow is outward in the equatorial and polar regions but azimuthal and even inward in other sectors. Shibata et al. And Komissarov and Lyubarsky note that a more realistic description of the Crab s X-ray features will require a full 3-dimensional simulation that allows the development of instabilities and a disordered magnetic field structure.
However as discussed by Begelman (1998) these models do provide a good description of the Crab s gross features - a bubble inflated by a mixture of relativistic particles and toroidal magnetic field injected by the central pulsar in the form of a relativistic wind. The bubble is a confined cylindrical structure in which magnetic and particle pressure vary with cylindrical radius. Begelman further notes that this is also a good description of a plasma pinch with current flowing in the axial direction - the so-called Z-pinch - which is subject to instabilities. These instabilities could produce a chaotic structure with loops and field reversals that could lead to additional particle acceleration in the outer regions of the nebula, consistent with the conclusions of Shibata et al. (2003) and Komissarov and Lyubarsky (2003).
The present paper describes an X-ray observation of the outer edge of the PWN, a region intermediate between that controlled by the pulsar and that controlled by the slowly expanding filamentary network. There, X-rays are fading away either because of a gradual loss of energy by the radiating particles or by escape of the particles into a region with a lower magnetic field.
In these models, at any point, energy in the PWN is divided between magnetic field and relativistic particles. The flow is characterized by the magnetization parameter, = Poynting flux / particle kinetic energy flux. The magnetic field we use to calculate particle lifetime is not this Poynting field but the equipartition field, the field experienced by the particles without concern for direction or time variability.
It is generally assumed that, after the shock, the energy in the PWN is equally divided between field and particles and that the particle energy is equally shared between positive and negative particles, . The positive particles are probably positrons and radiate at the same rate as the electrons. If protons are present, the synchrotron emission rate is low and, because they have not yet been observed, their existence and fate are unknown.
The X-ray structure we report here does not convey much information about flow in the central bright part of the nebula. There the pulsar controls the geometry and flow in the equatorial region where expanding rings are observed and the initial collimation of the southern jet. Farther out and closer to the optical filamentary shell where the pulsar wind is stopped conditions are controlled by the slowly expanding material. Although there is pressure from the PWN and consequent instabilities, it is the geometry of the filaments that determines the nature of the PWN here. However, magnetic fields also play a large role. Strong nonthermal radio emission from the Crab’s optical filaments show that they have embedded fields and Fesen, Martin, & Shull (1992) have argued that the synchrotron nebula’s east and west “bays” are caused by a toroidal field which is a relic of the progenitor star. We have observed the region intermediate between that controlled by the pulsar and that controlled by the envelope and we find that there is order in the flow. Conditions are not chaotic and magnetic fields seem likely to play an important role.
2 The Chandra Observation
Because the Crab is so bright in X-rays and because the Chandra
telemetry response
is limited, a direct ACIS observation of the Crab would result in
a factor of 6 deadtime.
To avoid this, we excluded the bright central region
from our observation. The observation was
a 40 ks exposure using 3 ACIS-S and 2 ACIS-I chips with the
X-ray nebula centered on the S3 chip, but with the center region of
the chip excluded from the telemetry. Thus, with dead time only a
few percent, a 40 ks exposure was
obtained of the faint outer part of the PWN. Table 1
gives the details of the observation. This was one of two observations to
search for thermal emission and to study the Crab halo
(Seward, Gorenstein, & Smith 2006).
| Observation number | Date | Live Time | ACIS chip |
|---|---|---|---|
| 500432/4607 | 27 Jan 2004 | 37250 | S3 |
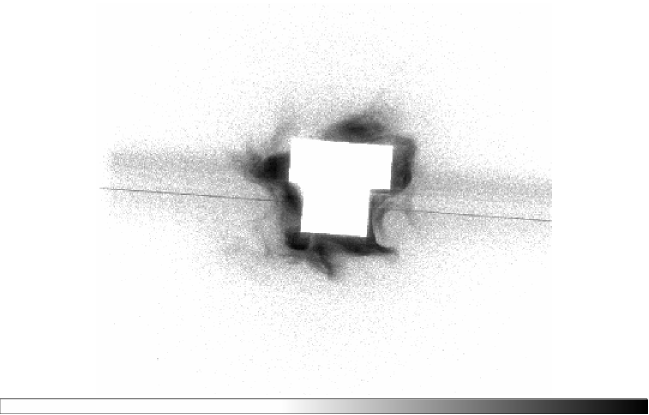
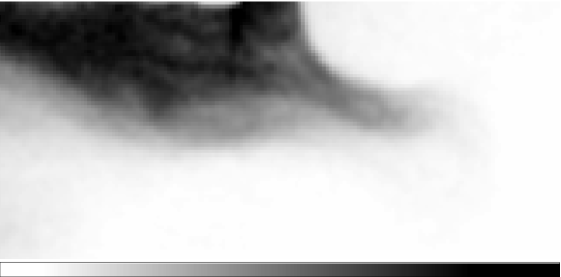
This paper concerns only data taken from chip S3. Figure 1 shows the raw image. Note the excluded region at the center and the decrease in intensity at the boundary of this region caused by dither of the pointing direction. Also note the prominent charge transfer streak (an artifact of the ACIS detector) which makes spectral measurements difficult east and west of the central bright region.
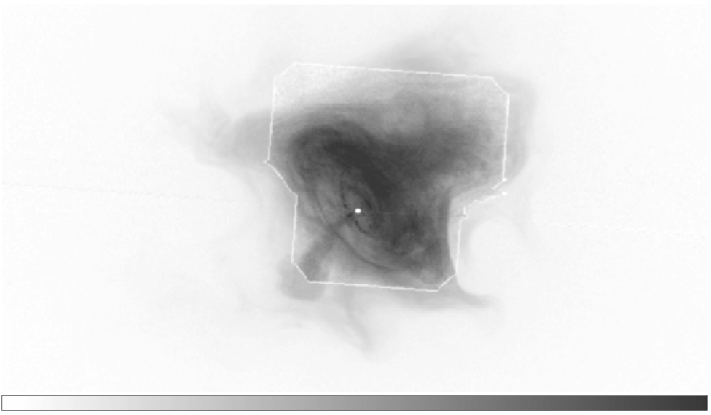
Figures 2 & 3 shows the data after subtraction of the charge transfer streak. In order to show the complete PWN, a short observation of the bright Crab (obsid 1997, live time = 3972 s) has been added. A 2 pixel gap has been left between the 2 observations to avoid false impressions due to time variability or normalization problems. The difference in surface brightness between the brightest and faintest parts of the PWN is a factor of .
We divided the data in 2 energy bands, 0.4-2.1 keV and 2.1-8.0 keV. Transmission through the ISM is small below 0.4 keV, there is an abrupt change in the Chandra mirror reflectivity at 2.1 keV and charged particle background is appreciable above 8 keV. Structure at the edge of the PWN is much more prominent in the lower energy band because the spectra of features at the boundary are soft. While only the 0.4-2.1 keV data are shown in the figures, energies from 0.9 to 8.0 keV were used for the spectral analysis.
3 Results
3.1 X-ray Structure
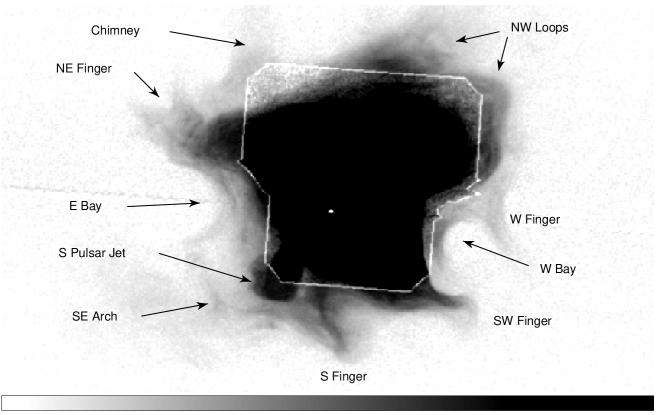
Hester et al (1995) defined and identified faint features at the edge of the Crab PWN as seen in a ROSAT observation. We see in Figure 2 all of the features noted by Hester et al. (in their Fig. 5 ) and more. We have enough counts to define structure and to extract and fit spectra. Since we see the same features 12 years after the ROSAT observation, these are not transient but time variability is certainly not excluded.
Starting in the southeast and proceeding counterclockwise we see: the termination of the south pulsar jet, a bright finger extending due south, a bright finger extending due west which is partially an extension of the bright ring/torus structure in the central nebula, an indentation, the West Bay, with faint interior wisp, a faint wisp encircling the north edge of this bay, the faint Northwest boundary (sometimes called the ”umbrella”) which is perhaps the termination of a northern pulsar jet and which appears to consist of a number of closed loops attached to the inner nebula, a very faint cloud north of this, a faint finger pointed north approximately aligned with the optical [O III] “chimney” of filaments, two stubby fingers pointed northeast curving slightly north and with striations at the base, another indentation the East Bay, an arch of emission standing out from the nebula which may be part of a loop structure connected to the inner nebula, and an amorphous faint cloud of emission to the east of this arch.
3.2 Comparison with Optical Structure
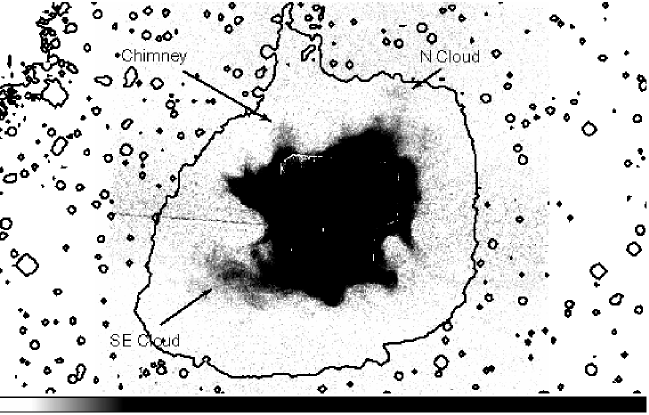
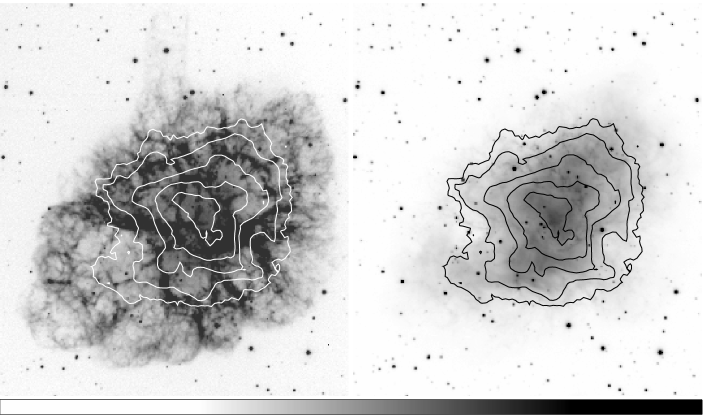
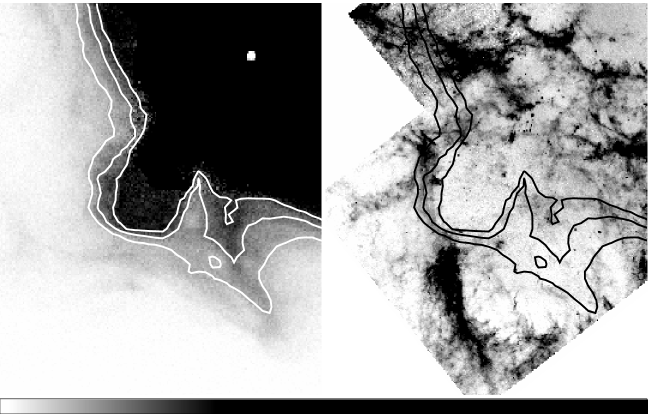
Figures 4 and 5 show X-ray surface brightness contours overlaid on the optical continuum and on [O III] emission respectively. Contours are drawn to show particular features. There is continuum optical emission associated with every X-ray feature. The Jet and the S Finger are optically bright. There is continuum emission in the SE where the X-ray SE Cloud is located which reinforces the nonthermal origin implied by power-law fits to the X-ray spectra.
Faint X-ray contours to the north roughly follow the shape of the brightest [O III]] filaments, particularly in the Northwest. The Jet is bounded by [O III]] filaments on the NE side. The S and SE Fingers extend between [O III] filaments. There is very faint [O III] emission bounding part of the S Finger.
3.3 X-ray Spectra
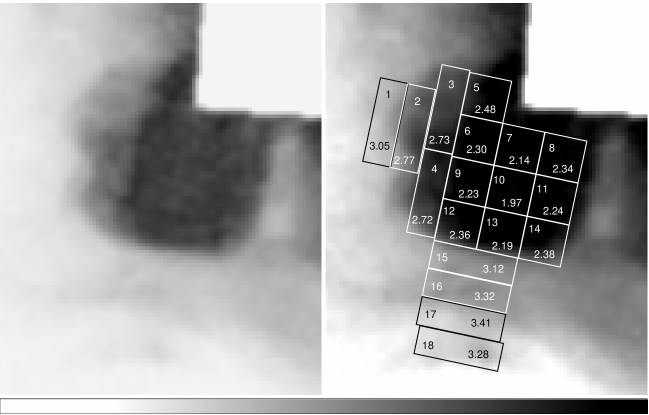
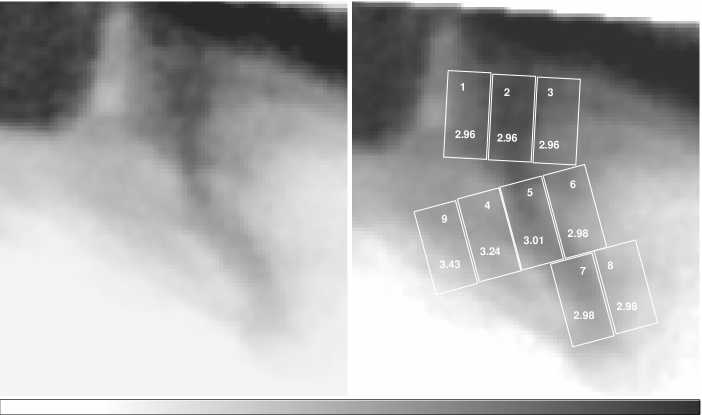
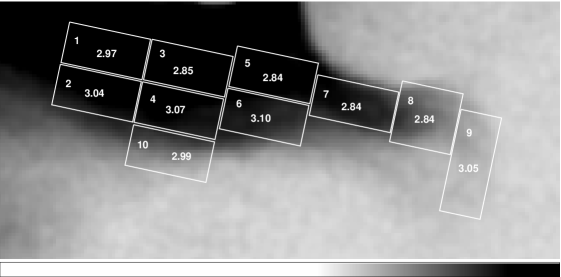
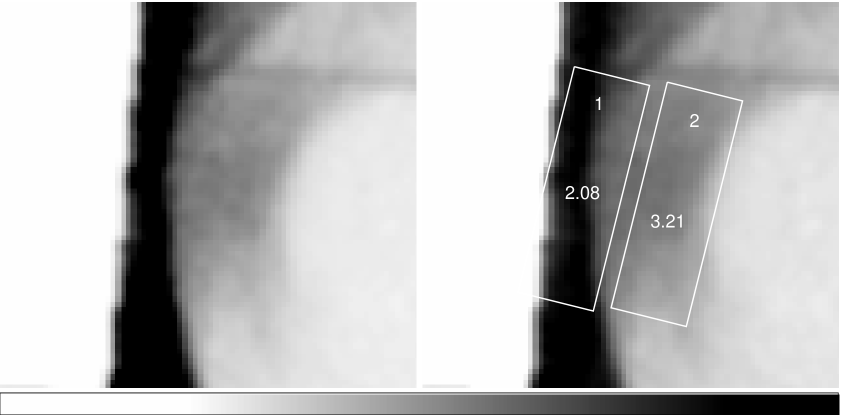
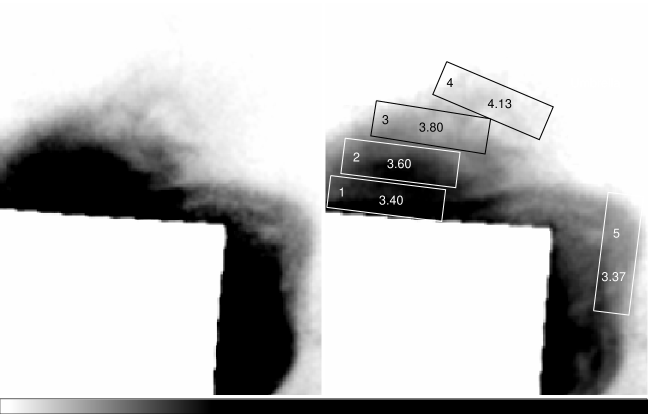
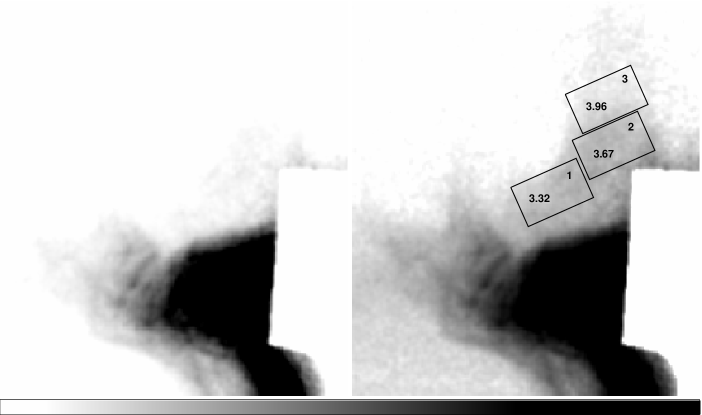
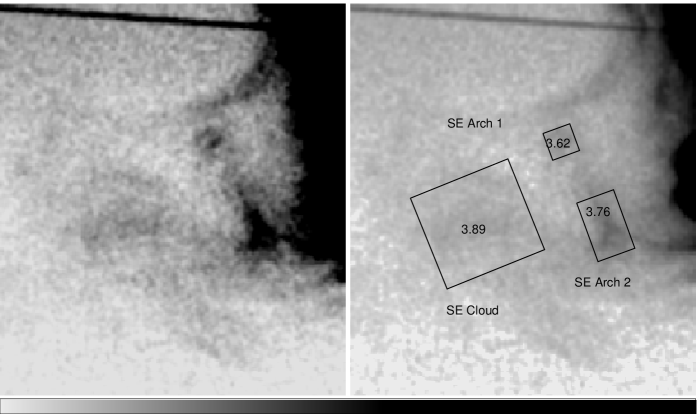
Figures 6-10 show overlays of regions where data were extracted for spectral analysis. The CIAO software, version 3.2, was used for extraction and spectral fitting and the DS9 software for imaging. Analysis was sometimes difficult because of pileup effects and because of difficulty in choosing proper background regions. Backgrounds are not negligible. The brightest regions analyzed have background contributions of 10%. In the faintest regions, the signal:background of the SE Cloud was 0.7:1 and that of the N Cloud 0.2:1 (see Fig. 3). Parameters for spectral fits are listed in Table 2. Uncertainties given are formal 1 from the SHERPA fitting algorithm. Systematic uncertainty arising from choice of background region was investigated by repeating some spectral fits using different background regions. The resultant change in best-fit photon index, , was within the formal error.
The spectrum of the Crab and the pulsar can be derived free from pileup effects using events from the charge-transfer (CT) streak. Results obtained from a region just outside the edge of the PWN are also listed in Table 2. The photon spectral index of is a bit softer than the photon index of , the standard derived from observations in the period 1964-1972 (Toor and Seward 1974), measured by Willingale et al. (2001), and by Kirsch et al. (2006) with XMM. The average column density, which was allowed to vary, is in good agreement with measured by Willingale et al. but is 25% higher than the measured by Kirsch et al.
Since the soft outermost part of the PWN and the soft dust-scattered halo are not included in the CT-streak, the measured photon index might be expected to be harder than the previously-measured average but our photon index is a bit softer than average. Our measured photon index for the Pulsar is compared with measured by Willingale et al. and by Kirsch et al., again softer. We took the comparison of the CT-streak spectra with other results as indicating that the calibration of the ACIS instrument and CIAO software are such that derived power-law indices should be good to within . For all spectral fits, was fixed at atoms cm-2 even though sometimes slighty better fits could be obtained with higher and somewhat higher photon spectral index.
The pileup fraction was appreciable for the brighter regions. A CIAO program developed by Davis (2001) was used to remove pileup effects and we list the pileup fraction calculated by this program for each spectrum. Fits are good when this fraction is below 15%. The pileup correction becomes more difficult as count rate increases. Because we observed that the correction failed first at the lowest energies, we restricted our analysis to the energy range 0.9-8.0 keV.
The selection of background regions was driven by the bright scattering halo which extends over the entire ACIS field. For most regions of interest, adjacent regions are also part of the PWN and are unsuitable for use as background. In most cases, we selected a region outside the PWN but at the same radial distance from the scattering center (the center of the halo), located 14′′ northwest of the pulsar at R.A. = , Dec. = (epoch 2000). Extraction boxes shown in the figures were generally aligned along the circumferences of circles centered on this point. Decreased exposure due to dither into the central hole in the field was taken into account for regions at the edge of the excluded area. We did not fit spectra to data where the exposure correction was more than a factor of two except for the bright edge of the W Bay. The CT streak introduces another large background in the east and west and spectral analysis was attempted at only one place in the area covered by the CT streak, i.e., the W Bay where a steep falloff allowed background from the streak to be measured with little change in radial distance.
3.4 Estimates of Magnetic Field Strength
Using standard formulae (Woan 2000) for synchrotron power and characteristic frequency, , and averaging over the angle between electron velocity vector and field line, the electron lifetime, , is
where is in units of Gauss and is in keV.
Assuming all particles are either electrons or positrons and that all power is radiated at ( for this observation), the magnetic field for a given region can be calculated from the X-ray luminosity, , and the volume, . The parameter = is the ratio of magnetic field energy density to particle energy density.
where is 0.3-3.0 keV X-ray luminosity in ergs s-1, is volume in cm3, is critical energy in keV, and is a factor accounting for particles that radiate in other wavebands. We use = 400 for the Crab which covers from radio to -ray energies. With the usual assumption that = 1, .
Anticipating the discussion to follow, magnetic fields and lifetimes of representative regions have been derived and are listed in Table 3. Hillas et al. (1998) have calculated the field required to explain the observed TeV spectrum. These TeV -rays are the result of Compton scattering of IR photons by the electrons that produce few-keV synchrotron emission. They derive a central field of Gauss, a factor of 3.5 less than the average equipartition field calculated above, and thus one might expect longer lifetimes than those listed in Table 2.
4 Discussion
The X-ray spectrum of the entire Crab Nebula is observed to be a power law with photon index close to 2.1 (Toor & Seward 1974, Weisskopf et al. 2000, Willingale et al. 2001, Mori et al. 2004, Kirsch et al. 2006). Furthermore, the photon index is 1.9 in the central bright Torus and steepens to 2.3-3.0 in the outer regions. This is generally explained by the so-called “synchrotron burn-off”. After acceleration at the shock, in the vicinity of the brightest inner rings, the relativistic plasma diffuses outward radiating as it goes and forming the PWN. The size of the PWN is observed to increase with decreasing photon energy as expected if the radiative lifetime of the diffusing particles determines the size of the nebula (see Equation 1).
Our observation covers the edge of the synchrotron nebula where the particle energy is dropping through the X-ray range. With the exception of the S Pulsar Jet, all the features to be discussed have soft spectra with indices ranging from 2.8 to 4.4. The index of observed at the base of these features implies a considerable loss over particles in the bright torus. As the outward propagation of the plasma continues, the degree of softening differs in different regions. For example, the Pulsar Jet is the most extreme case and shows little softening along its length. Likewise X-rays from the S and SW fingers have an almost constant photon spectral index along the length of these features. In contrast, in the W Bay and in the N Loop regions the photon spectral index increases rapidly as one proceeds away from the center.
4.1 S Pulsar Jet
In Figure 2 we made use of a previous Chandra observation of the bright center of the Crab to show the connection of our image with the inner part of the Pulsar jet. *We note that in the simulations of Komissarov and Lyubarsky (2003) and Del Zanna et al. (2004, 2006), the jet is formed downstream of the termination shock and thus does not, strictly speaking, originate from the pulsar. However, it is produced by the pulsar, so we will refer to it as the “pulsar jet”. The discontinuity in brightness where the images are joined is partially from pileup in our observation but also probably from time variability in brightness of the jet. Figure 6 shows the outer of the pulsar jet which has broadened considerably since leaving the vicinity of the pulsar. X-rays from the core of the jet are hard and there is little softening until the S termination is reached.
Mori et al. (2004) show spectral indices from this region derived from a sum of the shorter Chandra exposures. Although there are not as many events, pileup effects are less severe in their data. They find that the photon index is 2.0 for the last half of the jet with spectral softening at the sides. They point out that soft emission from the sheath and projection implies a core spectrum harder than measured. In our data, the pileup correction is greatest in the core of the jet. Since we derive about the same photon spectral index as Mori et al. in this area, we know that our pileup algorithm (which is not well calibrated for a power-law spectrum) can be used for the jet region and for regions of lesser brightness.
This feature is apparently a channel which contains the energetic plasma from the jet. There are distinct boundaries East, West, and South. At the South edge the X-ray brightness drops a factor of 3 in a distance of (0.13 ly). Although radiating strongly over the length of the jet, there is little change in the spectrum in the core of the jet.
The spectrum abruptly softens South of this termination point implying energy loss of particles crossing the termination. We note that this emission may be a projection and not associated with the Jet in which case there is no evidence for jet particles crossing the South boundary.
There is structure to the East side, where the spectrum softens after two steps in decreasing surface brightness. The Jet appears to be in a hole in the optical nebula. Figure 5 shows an [O III] filament aligned with the steps at the East boundary (This is not the brighter filament one end of which appears to just touch the S boundary). Lawrence et al. (1995) measure the velocity of this feature to be +700 km s-1 placing it in the near half of the expanding nebula. If interaction with this filament does indeed cause the step structure, the S Pulsar Jet must be moving somewhat towards us. This agrees with the finding of the theoretical models, in which the direction of the jet was determined from the enhanced brightness due to Doppler beaming.
4.2 Other Faint Outer Features
Other features are identified in Figures 2 & 3 and shown in detail in Figures 7 - 12. The S Finger is the southernmost protrusion. In contrast to the jet, there is no abrupt termination and X-ray emission fades gradually. Particles propagate South along this feature with little spectral change along the axis. There is some softening at the edges. One can imagine magnetic field lines stretching NS along this feature and particles losing energy most rapidly propagating perpendicular to the field away from the core. Alternately, the bright core might indicate the present position of an energy flow that changes direction and path within the electron lifetime. In this case, the softer radiation away from the core would be from particles deposited previously. Figure 5 shows very faint [O III] wisps bounding the sides of this feature, implying an interaction with the envelope in this area. This is the Hester et al. (1995) feature ‘OS’.
Directly West of this the SW finger starts following the direction of the inner loops but keeps heading west instead of turning north to circle the pulsar. The spectrum, appreciably softer than that of the Torus, changes little along the bright length of this feature but softens slightly in the transverse direction and at the very end. The bright core of this feature ends in a little loop. There is faint emission West and South of this. This is the Hester et al. (1995) feature ’OSW’. The striations at the base of this feature (Fig. 8) follow the rings of the bright torus (Fig. 2), as if the finger were drawn out of the torus structure.
The X-ray E and W Bays correspond to the well-known optical synchrotron bays (Fesen, Martin & Shull 1992). Spectral analysis is difficult because both are overlaid by the CT streak. We did make spectral fits to 2 regions in the W Bay as shown in Figure 9. The W Bay is formed by a sudden decrease (factor of 2) in emission as one proceeds outward. A fainter feature lies projected within this bay and this too ends with a sudden decrease (factor of 4) in emission. The softer spectrum of this feature shows that it is indeed a separate region and not a continuation of the first step seen in projection.
The W Finger is faint and wraps around the North side of the W Bay. It also seems to merge with faint structure at the northwest corner of the nebula.
The N Cloud is just North of the NW Loops and barely visible above background. There are too few events to define any structure but a rough spectral analysis was possible using a signal of 2000 events over 10,000 background events. Best fits are a power law with photon index or a thermal bremsstrahlung continuum with keV. There is no significant spectral structure indicating emission lines. Of all the X-ray features described here, it is the closest to the optical boundary and can be seen in Figure 3 just inside the [O III] edge of the nebula. In this area, Fesen, Martin, & Shull (1992) noted faint optical continuum emission outside the filamentary envelope. This can be seen in their Figure 8. It does not overlap with the N Cloud.
The NW Loops form the northwest edge of the nebula. This region is the area called the ’umbrella’ by Mori et al. (2004), and the ’counterjet’ by Hester et al (1995). The region is filled with faint striations or loops oriented roughly parallel to the circumference of the PWN. Our spectral extraction regions are oriented along this structure. The spectrum softens appreciably going outwards, indicating rapid energy loss. This is Hester et al. (1995) feature ’ON’.
The Chimney is a very faint finger pointed north [Hester et al. (1995) feature ’ONE’] and approximately at the base of the faint north-pointing optical [O III] “chimney” (van den Bergh 1970, Gull & Fesen 1982, Fesen & Gull 1986). The alignment of the axis is somewhat east of the optical chimney axis and the X-ray emission fades before reaching the base of the optical chimney. Contrary to the result for the S Finger, there is some spectral softening as one proceeds north, but uncertainty in the outermost spectral index is large. It is possible to imagine particles streaming north along this feature and then along the optical chimney but the connection between this feature and chimney is not seen in the X-rays, with weak evidence for an optical synchrotron connection as well (Woltjer & Veron-Cetty 1987).
The NE Finger has 2 striations across the base, each an 30% increase in surface brightness over adjacent emission. The feature then splits into 2 parts and fades. This could be 2 separate features seen in projection. Because this is faint and embedded in the CT streak, derived spectral parameters had large uncertainties and are not listed. Looking at Figure 2, one can imagine this feature to be a warped extension of the bright torus around the pulsar. The striations line up with the rings that have been observed to flow outward. Perhaps these are an extension of the ring phenomenon.
The SE Arch only appears below 2 keV in energy. It has three components which may or may not be connected. The northern side of the arch is a wisp which borders the S side of the E Bay. The structure is similar to that of the W Finger which wraps around the N side of the W Bay. The S side of the arch is possibly the E end of a feature which passes south of the Pulsar Jet termination and joins the S Finger. The E side of the arch consists of 2 elongated knots which may be associated with separate loops connecting to the inner nebula.
The SE Cloud is somewhat separated from the main PWN. The structure here is less ordered than that of other features. Although faint, it is clearly seen and a good spectrum was extracted. The spectrum follows the general rule that features farthest from the center have the softest spectra. The amorphous structure at first looked promising as a sought-after region of thermal emission but we found no lines in its spectrum which would identify the emission as thermal. A power law fit is good and the presence of optical continuum in this area leads to the conclusion that this is also synchrotron emission. This is Hester et al. (1995) feature OSE.
4.3 General
The Crab Nebula’s PWN is confined by the remnant’s optical filamentary envelope and the X-ray synchrotron features discussed here showcase places where the confining pressure is lowest. The E and W bays seem to wrap around massive optical filaments. The S Pulsar Jet seems formed by an [O III] filament on the E side. The S and SW Fingers are located in spaces between bright filaments. The northern edge of the PWN falls just inside the bright northern filaments and tracks their morphology.
We propose that the features such as jet, loops, fingers, are defined by or at least contain ordered magnetic fields. Electrons flow along the features more rapidly than perpendicular to the field lines.
We assume that the width of the filaments is determined by the distance an electron can diffuse perpendicular to the magnetic field in a synchrotron lifetime, (cf. The discussion of nonthermal filaments in supernova shock waves by Vink (04)). Using standard diffusion theory, the width, , is given by
(3)
where is the diffusion coefficient for diffusion perpendicular to the magnetic field. The general assumption (e.g., Vink 2004, Yamazaki et al. 2004, Reynolds 1998, and Jokipi 1987) is that
where is the mean free path in terms of gyro radii, , and . Then
(4)
= at 2 kpc.
For and , comparable to the observed fall-off distances.
The Chandra image data reveal rapid decreases in surface brightness at the end of the S Pulsar Jet, in the W Bay and along the N edge of the SW finger. In these regions, brightness drops a factor of in a distance of . This is likely an indication of the reduced diffusion length in a synchrotron lifetime for electrons diffusing perpendicular to the magnetic field.
Although the S and SW Fingers are probably shaped by the structure of the optically bright filamentary material, bulk plasma flow along these features with velocity c/2 would take years to traverse the length of the features, comparable to the particle lifetimes. Yet, the photon spectral index remains constant within the uncertainties listed in Table 2. The electrons have certainly lost energy coming from the inner nebula to the base of these fingers but there is little loss along the length. In the North and West, the flow is across field lines and, because the spectral index increases, the time required to do so must be a large fraction of the lifetime. Indeed, particle lifetimes may determine the extent of these features.
5 Summary
Using the Chandra X-ray image, we have examined a variety of features at the edge of the Crab Nebula’s PWN. We find no indication of thermal radiation and the power-law spectra indicate that ’synchrotron burnoff’ is the main mechanism for energy loss. This, of course, is well known as is the fact that spectra generally get softer as energy flows outward in the nebula. However, we find that this is also true on a fine scale and that losses are less along linear features. There is also an order in the flow between the inner pulsar-dominated and the outer filament-dominated regions. This flow is not chaotic and may be magnetically controlled. The dimensions of some outlying features can be understood in terms of particle lifetimes. Magnetic fields anchored in the filamentary envelope may play an important role in guiding the X-ray-emitting particles, starting at about half the distance from the pulsar to the outer boundary.
This work was supported by Chandra Grant GO4-5059X.
6 References
Begelman, M.C. 1998, ApJ, 493, 291
Bowyer, S., Byram, E., Chubb, T., & Friedman, H. 1964a, Nature, 201, 1307
Bowyer, S., Byram, E., Chubb, T., & Friedman, H. 1964b, Science, 146, 912
Brinkmann, W., Aschenbach, B., & Langmeier, A. 1985, Nature, 313 662
Davis, J.E. 2001, ApJ, 562, 575
Del Zanna, L. , Amato, E., Bucciantini, N. 2004, A&A, 421, 1063
Del Zanna, L. , Volpi, D., Amato, E., Bucciantini, N. 2006, A&A, 453, 621
Fesen, R.A. & Gull, T.R. 1986, ApJ, 306, 259
Fesen, R.A., Martin, C.L. & Shull, J.M. 1992, ApJ, 399, 599
Frail, D.A., Kassim, N.E., Cornwell, T.J., & Goss, W.M. 1995, ApJ, 454 L129
Gull, T.R. & Fesen, R.A. 1982, ApJ, 260, 75
Gursky, H., Giacconi, R. & Paolini, F. 1963, Phys Rev Letters, 11, 530
Harden, F.R. & Seward, F.D. 1984, ApJ 283, 274
Hester, J.J., et al. 1995, ApJ, 448, 240
Hester, J.J., Mori, K., Burrows, D., Gallagher, J.S., Graham, J.R., Halverson, M., Kader, A., Michel, F.C. & Scowen, P. 2002, ApJ Letters, 577, L49 , Hillas, A.M., et al. 1998, ApJ, 503,744
Hiltner, W.A. 1957, ApJ, 125, 300
Jokipii, J. 1987, ApJ 313, 842
Kennel, C.F. & Coroniti, F.V. 1984, ApJ 283, 710
Kirsch, M.G.F., Schonherr, G., Kendziorra, E., Freyberg, M.J., Martin, M., Wilms, J., Mukerjee, K., Breitfellner, M.G., Smith, M.J.S. & Staubert, R. 2006, A&A, to be published (astro-ph/0604097)
Komissarov, S.S., & Lyubarsky, Y.E. 2003, MNRAS, 344, L93
Lawrence, S.S., MacAlpine, G.M., Uomoto, A., Woodgate, B.E., Brown, L.W., Oliversen, R.J., Lowenthal, J.D. and Liu, C. 1995, AJ, 109, 2635
Mori, M., Burrows, D.N., Hester, J.J., Pavlov, G.G., Shibata, S., & Tsunemi, H. 2004, ApJ, 609, 186
Palmieri, T.M., Seward, F.D., Toor, A., & Van Flandern, T.C. 1975, ApJ, 202, 494
Rees, M.J. & Gunn, J.E. 1974, MNRAS 167, 1
Reynolds, S. 1998, ApJ 493, 375
Schaller, E. L., & Fesen, R. A., 2002, AJ, 123, 941
Seward, F.D., Gorenstein, P., & Smith, R.K. 2006, ApJ, 636, 873
Shibata, S., Tomatsuri, H., Shimanuki, M., Saito, K. & Mori, K. 2003, MNRAS, 346, 841
Strickman, M.S., Johnson, W.N., & Kurfess, J.D. 1979, ApJ Letters, 230, L15
Toor, A. & Seward, F.D. 1974, AJ, 79, 995
van den Berg, S. 1970, ApJ, Letters 170, L27
Vink, J. 2005, in High Energy Gamma-Ray Astronomy: 2nd International Symposium, Edited by Felix A. Aharonian, Heinz J. V lk, and Dieter Horns. 160-171 (astro-ph 0409517)
Weisskopf, M., Cohen, G., Kestenbaum, H., Long, K., Novick, R. &
Weisskopf, M., et al. 2000, ApJ Letters, 536, L81
Willingale, R., Aschenbach, B., Griffiths, R.G., Sembay, S., Warwick, R.S., Becker, W., Abbey, A.F., & Bonnet-Bidaud, J.-M. 2001, A&A, 365, L212
Woan, G., 2000, The Cambridge Handbook of Physics Formulas Cambridge University Press, Cambridge
Wolff, R.H., Kestenbaum, H.L., Ku, W., & Novick, R. 1975, ApJ, 202, L15
Woltjer, L., & Veron-Cetty, M.P. 1987, A&A, 172, 7
Yamazaki, R. et al. 2004, A&A. 416, 595
| region | photon | pileup | goodness | region | photon | pileup | goodness |
|---|---|---|---|---|---|---|---|
| index | fraction | of fit | index | fraction | of fit | ||
| jet 1 | 0.02 | 1.14 | swfing 1 | 0.18 | 2.08 | ||
| jet 2 | 0.09 | 1.01 | swfing 2 | 0.09 | 1.22 | ||
| jet 3 | 0.12 | 0.85 | swfing 3 | 0.12 | 1.95 | ||
| jet 4 | 0.12 | 1.26 | swfing 4 | 0.08 | 1.05 | ||
| jet 5 | 0.16 | 1.03 | swfing 5 | 0.11 | 1.91 | ||
| jet 6 | 0.17 | 1.42 | swfing 6 | 0.05 | 1.46 | ||
| jet 7 | 0.21 | 2.22 | swfing 7 | 0.07 | 1.28 | ||
| jet 8 | 0.17 | 1.88 | swfing 8 | 0.02 | 0.67 | ||
| jet 9 | 0.17 | 1.47 | swfing 9 | 0.00 | 0.88 | ||
| jet 10 | 0.20 | 2.58 | swfing 10 | 0.02 | 1.11 | ||
| jet 11 | 0.17 | 1.75 | |||||
| jet 12 | 0.13 | 1.71 | sfing 1 | 0.07 | 1.21 | ||
| jet 13 | 0.15 | 1.96 | sfing 2 | 0.10 | 1.23 | ||
| jet 14 | 0.11 | 1.37 | sfing 3 | 0.07 | 1.09 | ||
| jet 15 | 0.03 | 1.00 | sfing 4 | 0.03 | 0.91 | ||
| jet 16 | 0.03 | 0.75 | sfing 5 | 0.05 | 0.99 | ||
| jet 17 | 0.01 | 0.94 | sfing 6 | 0.03 | 0.93 | ||
| jet 18 | 0.00 | 0.93 | sfing 7 | 0.03 | 1.33 | ||
| sfing 8 | 0.03 | 1.03 | |||||
| chim 1 | 0.01 | 0.94 | sfing 9 | 0.02 | 0.79 | ||
| chim 2 | 0.01 | 0.89 | |||||
| chim 3 | 0.00 | 1.07 | wbay 1 | 0.11 | 1.86 | ||
| wbay 2 | 0.03 | 1.60 | |||||
| nwloop 1 | 0.07 | 1.19 | |||||
| nwloop 2 | 0.02 | 0.93 | secloud | 0.00 | 0.96 | ||
| nwloop 3 | 0.00 | 1.52 | search 1 | 0.00 | 0.65 | ||
| nwloop 4 | 0.03 | 1.58 | search 2 | 0.00 | 0.92 | ||
| nwloop 5 | 0.03 | 1.58 | |||||
| ave crab | 0.96 | ||||||
| ncloud | 0.00 | 0.87 | pulsar | 1.16 |
| region | field | lifetime | extent of region |
|---|---|---|---|
| ( Gauss) | (years) | (light years) | |
| PWN average | 5.8 | 6.7 | 1.9 ( radius) |
| bright Torus | 7.7 | 4.3 | 1.7 (radius) |
| NW Loops | 9.1 | 2.9 | 0.6 |
| Jet center, region 7 | 9.1 | 2.9 | 1.8 (length of jet) |
| bright inner ring | 10.8 | 2.6 | 0.08 (thickness of ring) |
| knot in bright inner ring | 15.3 | 1.5 | 0.07 (size of knot) |
| S Finger, region 5 | 6.2 | 5.9 | 1.3 (length of finger) |
| SW Finger, region 7 | 6.2 | 5.9 | 1.6 (length of finger) |