Luminosity Dependence in the Fundamental Plane Projections of Elliptical Galaxies
Abstract
We analyze the fundamental plane projections of elliptical galaxies as a function of luminosity, using a sample of galaxies drawn from Data Release 4 (DR4) of the Sloan Digital Sky Survey (SDSS). We separate brightest cluster galaxies (BCGs) from our main sample and reanalyze their photometry due to a problem with the default pipeline sky subtraction for BCGs. The observables we consider are effective radius (), velocity dispersion (), dynamical mass (), effective density (), and effective surface brightness (). With the exception of the - correlation, we find evidence of variations in the slope (i.e. the power-law index) of the fundamental plane projections with luminosity for our normal elliptical galaxy population. In particular, the radius-luminosity and Faber-Jackson relations are steeper at high luminosity relative to low luminosity, and the more luminous ellipticals become progressively less dense and have lower surface brightnesses than lower luminosity ellipticals. These variations can be understood as arising from differing formation histories, with more luminous galaxies having less dissipation. Data from the literature and our reanalysis of BCGs show that BCGs have radius-luminosity and Faber-Jackson relations steeper than the brightest non-BCG ellipticals in our sample, consistent with significant growth of BCGs via dissipationless mergers. The variations in slope we find in the Faber-Jackson relation of non-BCGs are qualitatively similar to that reported in the black hole mass-velocity dispersion (-) correlation. This similarity is consistent with a roughly constant value of over a wide range of early type galaxies, where is the stellar mass.
keywords:
galaxies: elliptical and lenticular, cD – galaxies: evolution – galaxies: formation – galaxies: fundamental parameters – galaxies: statistics1 INTRODUCTION
Early-type galaxies are observed to populate a tight plane – the fundamental plane (FP) – in the space defined by their effective radii, velocity dispersions, and surface brightnesses (Dressler et al. 1987; Djorgovski & Davis 1987; Bender et al. 1992; Burstein et al. 1997). Such a correlation is expected theoretically if early-type galaxies are in virial equilibrium. The observed plane is, however, tilted with respect to the simplest virial theorem expectation, which must be accounted for in galaxy formation models. This tilt could be caused by a variation in the dynamical mass-to-light ratio for elliptical galaxies as a result of a varying dark matter fraction (e.g., Padmanabhan et al. 2004; Boylan-Kolchin et al. 2005) or stellar population variations (e.g., Gerhard et al. 2001). Another explanation for the FP tilt could be non-homology in the surface brightness profiles of elliptical galaxies (e.g., Graham & Colless 1997; Trujillo et al. 2004).
Projections of the FP contain additional information about the properties of early type galaxies. These include, e.g., the Faber-Jackson (FJ) relation (Faber & Jackson, 1976) between velocity dispersion and luminosity and the radius-luminosity relation. Although the FP itself is quite tight over a wide range of early type galaxies (e.g., Bernardi et al. 2003a), there are a number of indications of variations in the FP projections themselves with galaxy luminosity (which we refer to as “variations in slope” or “curvature” in the FP projections). For example, the slope of the Faber-Jackson relation decreases in lower luminosity ellipticals (Tonry, 1981; Davies et al., 1983; Matković & Guzmán, 2005). In addition, Oegerle & Hoessel (1991) find that while brightest cluster galaxies (BCGs) lie on the same FP as lower mass ellipticals, their central velocity dispersions are roughly constant with increasing luminosity and their effective radii increase steeply with luminosity, significantly more so than for normal ellipticals. Lauer et al. (2006a) and Bernardi et al. (2006) have confirmed these differences in the FP projections of BCGs with larger data sets. These trends can be understood if dissipationless (gas-poor) mergers become increasingly important for luminous ellipticals (Boylan-Kolchin et al., 2006).
In addition to global correlations among the galaxy properties themselves, the masses of central black holes in early-type galaxies correlate well with the velocity dispersions (Ferrarese & Merritt, 2000; Gebhardt et al., 2000; Ferrarese et al., 2001; Tremaine et al., 2002), bulge concentrations (Graham et al., 2001), and stellar masses (Magorrian et al., 1998; Marconi & Hunt, 2003; Häring & Rix, 2004) of their host galaxies. Wyithe (2006) and Greene & Ho (2006) have argued that the relation steepens at high black hole masses and flattens at low masses, respectively. This is similar to the luminosity dependence in the FJ relation noted above. If supported by larger data sets, the similar luminosity dependence of the and FJ relations could have important implications for understanding the relationship between the formation of galaxies and their central massive black holes.
The purpose of the present paper is to quantify the variation in the FP projections with luminosity using the exquisite statistics made possible by the Sloan Digital Sky Survey (SDSS) Data Release 4 (DR4; Adelman-McCarthy et al. 2006). These variations have, until now, been largely overlooked by previous FP studies, because simple power-law assumptions were often made when fitting the data. This can be seen, for instance, in the sample of galaxies from Bernardi et al. (2003b), where hints of the variations we discuss are quite noticeable in the plots. In the next section we describe the data used in our analysis (§2). We also describe a problem in the standard pipeline SDSS photometry of BCGs that leads us to reanalyze the BCGs separately from the bulk of the “normal” elliptical galaxy population. Having defined our sample, in §3 we examine the observed FP projections and quantify curvature in these projections as a function of luminosity. We also use published photometry of nearby (non-SDSS) BCGs to discuss the relationship between our results and the properties of BCGs. In §4 we discuss our results and their connection to galaxy-BH correlations. Throughout this paper, we use a standard cosmology with .
2 DATA
The data used in this paper were obtained from the NYU Value Added
Galaxy Catalog (VAGC) (Blanton et al., 2005), which uses the SDSS Data Release 4 (Adelman-McCarthy et al., 2006). This
includes both the imaging and spectroscopic catalogs, as well as the
Sérsic (1963, 1968) model fitting parameters (Blanton et al., 2003b) in
5 bands (ugriz). We also use the VAGC -corrections (version
4_1_4) (Blanton et al., 2003a). SDSS magnitudes are calibrated
to the AB system (Oke & Gunn, 1983), in which a magnitude 0 object has the
same counts as a Jy source (this zero point has been
confirmed in the r band). We use SDSS magnitudes corrected to redshift . We restrict the sample to r , where r is the Petrosian (1976) r-band
extinction-corrected apparent magnitude. These bright and faint target
limits define a complete sample (target selection is done only in r). The faint limit is r in some parts of the sky, but
to be safe, we adopt 17.5. We also only consider galaxies with
redshift . The low redshift cutoff excludes galaxies
with large peculiar velocities. We primarily present results in the
r band, but note that the g and i bands show very
similar behavior. The u and z bands suffer from filter and
chip problems, as well as low signal levels, and so we do not consider
them.
In order to isolate elliptical galaxies, we use the following three main criteria. First, the Sérsic index in gri must satisfy , in order to isolate de Vaucouleurs (1948) profiles () over exponential profiles (). Second, we restrict the concentration index in r, where and are the Petrosian 50% and 90% light radii, respectively (for reasons explained shortly, we also require the concentration index in gri). The criterion separates early and late-type galaxies with a completeness of 82% (Nakamura et al., 2003; Shimasaku et al., 2001). The concentration is not corrected for seeing effects, and thus a compact galaxy observed under bad seeing conditions will have an underestimated concentration (Blanton et al., 2003b). The sample of Nakamura et al. (2003) has eyeball classifications, however, and the cutoff was chosen to separate early and late types with minimal cross-contamination. For comparison, the Sérsic index above does take into account the observed point spread function (PSF). In addition to the above cuts on the surface brightness profile, we also apply the colour criterion g-r, where g-r is the g-r colour -corrected to redshift 0.1. Blanton et al. (2003b) found that this criterion isolates early-type galaxies from spirals. We note that the three criteria above are not completely independent. The most restrictive is the concentration cut, followed by the Sérsic cut and the colour cut. Their combination allows us to remove marginal outliers, especially S0 galaxies, and thus focus on the normal elliptical population.
In addition to the primary selection criteria above, several additional criteria are used to remove bad points, notably using pipeline warning flags, requiring a median signal-to-noise (S/N) in the spectrum, eliminating galaxies with very high or low (unphysical) values for , requiring the de Vaucouleurs likelihood of the SDSS model fit to be greater than the exponential likelihood, and ensuring that all quantities have well-defined measurement errors. These quality restrictions remove roughly 7% of galaxies identified by our elliptical criteria. For reasons explained in §2.1, we also separate out all BCGs identified in the C4 catalog of Miller et al. (2005) from our main sample. The final sample (hereafter known as the main normal elliptical galaxy sample) consists of 79,482 galaxies.
The VAGC provides three different magnitude definitions for galaxies: a) a Petrosian magnitude, b) a magnitude derived from a Sérsic fit, and c) a magnitude derived from a de Vaucouleurs fit. We elect to use Petrosian magnitudes, converted into total “Sérsic”-like magnitudes using the concentration index and the relations of Graham et al. (2005) for SDSS data. In particular,
| (1) |
where is the total “Sérsic”-like magnitude, the Petrosian magnitude, and the concentration. and for SDSS data. These transformations effectively recover the magnitudes that would be obtained from an ideal Sérsic fit using only Petrosian quantities. The only assumption needed is that a galaxy’s profile is well modeled by a Sérsic function, although a Sérsic fit is not actually used. The Graham et al. (2005) relations also yield an effective radius (i.e., the half-light radius), using
| (2) |
where is the Petrosian half-light radius. and for SDSS data. The above transformation equations break down for , so we exclude such galaxies. This requirement removes less than 0.5% of galaxies, independent of luminosity, and does not effect our results.
The conversion to an effective Sérsic magnitude using Petrosian quantities is desirable because (1) de Vaucouleurs magnitudes presume that all ellipticals are well-modeled as a profile. In fact, however, the Sérsic index appears to increase mildly with increasing luminosity (see, e.g., Caon et al. 1993; Graham et al. 1996; Ferrarese et al. 2006; we also see the same trend in our data; see §3.2), and (2) Petrosian and Sérsic quantities themselves suffer from mild systematic errors. The fraction of total flux contained within the Petrosian aperture is a function of the profile shape (see Graham et al. 2005 for an in-depth discussion). For example, the Petrosian aperture contains % of the total flux for an exponential profile, but only % for a de Vaucouleurs profile. This introduces a luminosity-dependent error into the total magnitude definition, given the mild increase in Sérsic index with increasing luminosity. Sérsic magnitudes themselves do account for profile shape, and represent a total integrated luminosity. There are, however, systematic problems with VAGC Sérsic fits. As both Blanton et al. (2005) and Graham et al. (2005) explain, the Sérsic fluxes obtained from these fits are systematically underestimated, and become worse for increasing Sérsic index . At , the error is 10%. Sérsic fits are also more sensitive to the radial range over which the fit is carried out.
For the reasons above, we elect to present results using the total Sérsic-like magnitudes derived from Petrosian quantities. We note, however, that the entire analysis in this paper was repeated using the quantities obtained from the Sérsic and de Vaucouleurs fits. We find results similar to those presented here, in particular, the same trends in the FP projections (see §3.2).
The Sérsic-like Petrosian quantities we use do not take into account possible isophote ellipticity. The majority of galaxies in our sample, however, have axis ratios greater than , and there is no strong dependence on absolute magnitude. As a check, we applied a correction factor from West (2005) to our adopted radii and repeated our analysis below. Our measured FP projection slopes changed by at most , with all the same trends being present. Ellipticity therefore does not have an important effect on our results.
In order to correct for passive evolution of early-type galaxies over the redshift range probed by SDSS, we use the prescription of Lin et al. (1999) to correct all magnitudes;
| (3) |
where is the r-band absolute magnitude corrected for evolution, the observed absolute magnitude, the redshift, and the evolution parameter in magnitudes per redshift. We use the value of found by Bernardi et al. (2003b) for elliptical galaxies in the r band. Our net +evolution correction is very similar to that used by Wake et al. (2006) for luminous red galaxies in SDSS in the r band, where is the correction at redshift .
All galaxies in the main sample have a Petrosian , larger than the typical seeing for the SDSS survey, which is a full width at half maximum of 14 in the r band. Thus none of the measured radii are severely compromised by the PSF. As a quantitative check, we repeated our analysis of the FP projections imposing an additional cut that all galaxies have , and found quantitatively similar results.
We correct all velocity dispersions for aperture effects following Jørgensen et al. (1995) and Wegner et al. (1999). This corrects all measured velocity dispersions to a standard circular aperture with a radius equal to one-eighth the effective radius of the galaxy:
| (4) |
where and are the measured and corrected velocity dispersions respectively, the fiber radius from the SDSS (15), and the effective radius of the galaxy in arcseconds. We note that this correction assumes that all early-type galaxies have similar velocity dispersion profiles, regardless of . Bernardi et al. (2003c, b) provide a good discussion on this topic, but given that the correction depends very weakly on , these differences do not have any significant impact on our results.
Finally, we define the effective surface brightness of a galaxy as follows, -corrected and corrected for cosmological surface brightness dimming,
| (5) |
where is the extinction- and evolution-corrected apparent magnitude, the effective radius (in arcseconds), the redshift and the -correction at redshift .
2.1 Brightest Cluster Galaxies
As both Lauer et al. (2006a) and Bernardi et al. (2006) discuss, there is a problem with the standard SDSS photometry of luminous BCGs (see also http://www.sdss.org/dr4/help/known.html). The problem is that the default sky subtraction removes the outer low surface brightness flux from the galaxy, resulting in an underestimate of the luminosity and effective radii. We have independently come to the same conclusion. This problem is severe for BCGs because most of the luminosity is in low surface brightness emission. We were motivated to look into this problem by the lack of curvature in the initial Bernardi et al. (2003b) SDSS FP projections at high luminosity, relative to the local BCG samples of Oegerle & Hoessel (1991) and Lauer (private communication & Lauer et al. 2006a).
We identify BCGs in SDSS using the C4 catalog of Miller et al. (2005), which is based on DR2 data, complete to . Clusters are defined in C4 on the basis of position, redshift and colour, and the BCG is simply the brightest system in the cluster. In order to identify the C4 BCGs in the VAGC catalog, we use their declination and right ascension to find unique matches to within 1″ in the DR4 catalog. We were able to successfully match 744 out of 748 BCGs (some of which are duplicate objects), although 194 were too bright to be included in the spectroscopic survey (i.e., brighter than the fiber saturation limit on SDSS). Of the remaining 550 BCGs, only 346 unique objects pass all our criteria in establishing an early-type galaxy sample, the most restrictive being the concentration cut. We note that Bernardi et al. (2006) also find significant contamination from non early-type galaxies in the Miller et al. (2005) BCG catalog. The majority of this contamination is likely due to a fiber collision restriction in SDSS data, such that the true BCG in a C4 cluster is missed in the spectroscopic catalog (Miller et al., 2005; von der Linden et al., 2006).
To assess the accuracy of the standard pipeline photometry, we have reanalyzed images of a subset of high luminosity normal galaxies and BCGs. Sky subtraction was performed on each individual SDSS field containing a sample galaxy. All objects in the field were masked out and a tilted plane was fit to the remaining sky pixels. For more details see West et al. (2007). In the case where a sample galaxy crossed multiple fields, the fields were sky subtracted and then mosaicked. We then performed a 2-dimensional Levenberg-Marquardt least-squares de Vaucouleurs fit, masking out nearby stars, galaxies, and the center to safely avoid the PSF core.
Unlike the bulk of the normal elliptical galaxy population, we adopt a de Vaucouleurs fit instead of a Sérsic fit for BCGs because of the subtle nature of BCG photometry. Sérsic fits, with an extra degree of freedom, are sensitive to the range of the fit and tend to result in very large luminosities and radii for many BCGs with deep photometry (see §3.3). Much of this flux, however, is probably better attributed to intracluster light rather than host galaxy light, though a proper decomposition into the two components is difficult and will likely require improved theoretical models. In the absence of a more appropriate choice, we adopt a de Vaucouleurs fit for the BCGs.
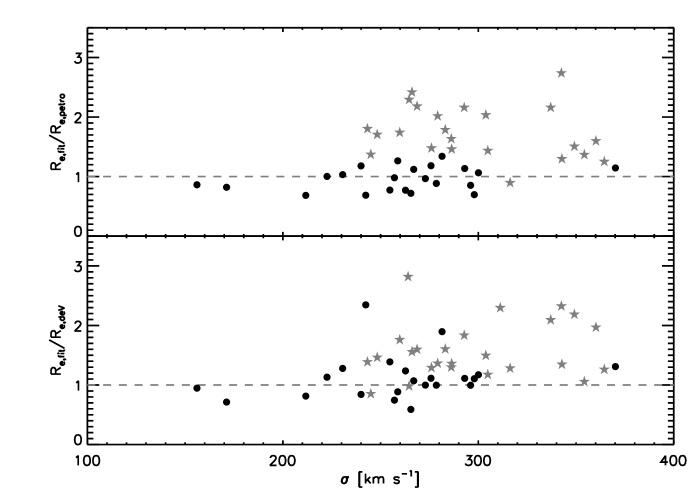
Figure 1 shows a plot of the ratio of our fitted de Vaucouleurs effective radii to the catalog radii as a function of velocity dispersion for a sample of normal elliptical galaxies (black points) and BCGs (grey stars). We include a comparison to radii obtained from both the Sérsic-like Petrosian measurements used in this paper and catalog de Vaucouleurs fits. For most of the normal galaxies the agreement is quite good, even for very massive and luminous galaxies with km s-1. This indicates that, for most normal galaxies, the default catalog photometry is accurate. For the BCGs (gray stars), however, the catalog effective radii are smaller than our fitted values by factors of 1.5–3. Similarly the total luminosities of these galaxies are underestimated in the VAGC by factors of 1.2–2.5. For these reasons, we exclude BCGs identified by Miller et al. (2005) from our main sample, and reanalyze them separately.
Despite the systematic underestimates in the catalog and luminosities for SDSS BCGs, BCGs represent only a small fraction of all elliptical galaxies and so their effect on our main sample as a whole is small. Indeed, only 346 BCGs identified by Miller et al. (2005) in DR2 are excluded from our main sample. As an independent check on this number, we note that using the number density of BCGs of Mpc-3 at from Postman & Lauer (1995), we would expect BCGs in DR2, in reasonable agreement with the above numbers. For comparison, DR2 contains a total of roughly 10000, 3100, and 400 elliptical galaxies that meet our criteria brighter than , , and , respectively. Thus even if all BCGs were brighter than , which they are not, BCGs would only become statistically significant (by number) for galaxies brighter than . The precise luminosity at which BCGs become statistically significant depends, however, on how the luminosity of a BCG is defined, i.e., how much of the extended low surface brightness emission is detected and how much is attributed to the galaxy rather than intra-cluster light (see §3.3).
To verify the small effects that BCGs have on our results for the normal elliptical galaxy sample, we performed our analysis of the FP projections on four data sets: a) DR4 with DR2 BCGs excluded (our standard main sample); b) DR4 with no DR2 BCGs excluded; c) DR2 with DR2 BCGs excluded; and d) DR2 with no DR2 BCGs excluded. In all cases, our distributions and fits described below were virtually unchanged. The distributions and fits showed only small differences at the luminous end. These differences were of order 3%, roughly equal to our adopted errors at the luminous end. Because the identification of BCGs by Miller et al. (2005) is likely incomplete, we cannot rule out that contamination by BCGs is present, particularly because we are using DR4, and Miller et al. (2005)’s identification of BCGs is only available for DR2. Since DR4 contains roughly twice as many galaxies as DR2, we estimate that the number of remaining BCGs in our sample is similar to the number we have excluded (). The above comparisons between samples with and without DR2 BCGs show, however, that although the photometry of some remaining BCGs in our sample may be incorrect, they are not causing significant errors in our analysis of the FP projections of the non-BCG elliptical population.
3 FUNDAMENTAL PLANE PROJECTIONS
3.1 Magnitude-Limited Sample Corrections
Our sample is magnitude limited, as defined in Section 2, at both the bright and faint ends. In order to analyze the correlations between observables for the elliptical population as a whole, we must correct for this selection effect. To accomplish this, we use the method, which weighs each point in the sample by , where is the maximum spatial volume one can observe a given galaxy in (adjusted for our redshift limits). We ignore -correction and luminosity evolution in determining . They have nearly equal and opposite effects on the observed brightness of a galaxy (roughly one magnitude per unit redshift), and thus do not affect our results significantly (Shen et al., 2003; Blanton et al., 2003a, c). We choose the nonparametric method over a maximum likelihood analysis to avoid any assumptions about parametric forms for the intrinsic distributions, even though we find them to be reasonably Gaussian. We note that the method is subject to inaccuracies at the faint end of the galaxy distribution, where an inhomogeneous and non-representative sample is given a very high weight. This well-known problem is addressed below.
As discussed in Sheth et al. (2003) using a correction represents the joint distribution of an observable and luminosity . The fit to this joint distribution is known as a bisector fit. In order to consider the distribution of the observable at fixed (i.e., ), we must weigh each galaxy by , where is the luminosity function. The fit to this distribution is the inverse fit (i.e., as a function of ). The inverse fit is more appropriate for these studies because the observable is usually far more uncertain than the luminosity . Treating as an independent variable and assuming the scatter is largely due to is thus the best course of action.
One difficulty with the correction is that a few galaxies are given high weight at both the faint and bright ends. We circumvent this issue by trimming our sample at the bright and faint ends. While this somewhat diminishes our results on the curvature in the FP projections, which are more pronounced at the extreme luminosity ends, it is necessary to prevent spurious fits dominated by small number statistics. Our criterion used to trim the sample is that we consider only galaxies with a weight no larger than 101.1 times the mean, i.e.,
| (6) |
This effectively cuts out galaxies fainter than and brighter than in r band, removing a total of of galaxies. This cut is based on trial and error. Factor of few variations about the choice in equation (6) does not change any of our conclusions, while for a substantially more permissive cut the fits become overly dominated by a few galaxies, resulting in very unphysical fits.
3.2 Observed FP Projections
Figure 2 shows the distribution of observables at fixed luminosity. The observables we consider are effective radius (), velocity dispersion (), dynamical mass (), effective density (), and effective surface brightness (). We concentrate our discussion on the first two projections, but include all five for completeness. In Figure 2, we separate the data points into small 0.25 magnitude-wide bins and show the mean and width of the distribution in each magnitude bin; the distributions are well fit by Gaussians.
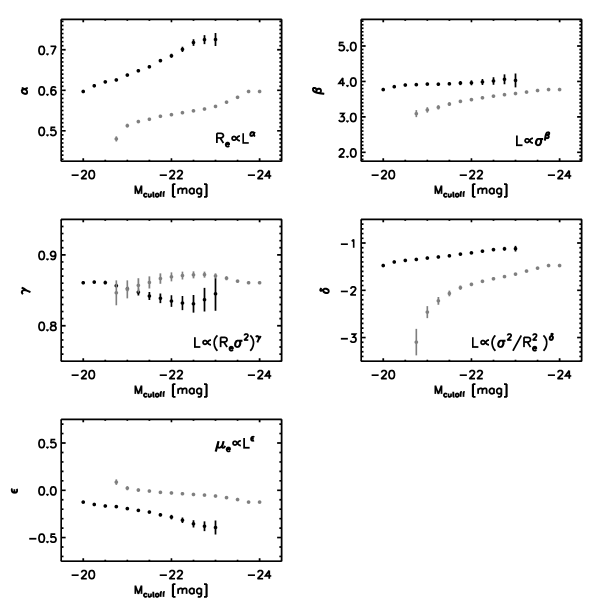
Even by eye, Figure 2 shows pronounced curvature in the FP projections, with the exception of . We perform two tests to quantify this curvature. First, we perform a series of linear least-squares fits of observable as a function of magnitude; we repeat these fits considering different subsamples with varying bright and faint end magnitude cutoffs. This quantifies how the slope of the FP projection depends on the luminosity range considered. Figure 3 shows the resulting variation in the slope of the FP projections, considering limits to the sample at the faint (black points) and bright (grey points) ends. The left-most black points and right-most grey points in any of the plots give the slope of the projection over the entire sample of elliptical galaxies. The remaining points describe the slope of the FP projections over increasingly smaller sub-samples. The power-law slopes are defined as follows: , , , , and . The slope error is a statistical error using the measurement errors on and .
As an alternative way of quantifying curvature in the FP projections, we consider a quadratic fit to the entire sample, of the form
| (7) |
where is the luminosity and is the observable. The parameters for these fits are presented in Table 1. In four of the five projections, the quadratic term is statistically non-zero. The observable is the only one without a clear detection of a quadratic term. Note that we are not ascribing any particular physical significance to this second order term, but merely using it to quantify curvature. By using the derivative of the quadratic fit with respect to , we define the local slope of the - relation for all observables . This is presented in Figure 4. The variations in these - slopes agree well with the trends seen in Figure 3. The statistical errors on these slopes are similar to those in Figure 3 for the largest subsamples and are omitted for clarity.
To test the robustness of our local - slopes, we also performed 3rd order polynomial fits on all our relations, of the form . The best fit local slopes of the - relations were nearly identical to our quadratic fits over the luminosity range of our sample, providing some confidence in the robustness of the results in Figure 4. In the case of the FJ relation, however, a quadratic expansion with respect to might not be the most appropriate description of the data, given the observed sign of the curvature in Figures 2 & 3. In equation (7), as (because in Table 1), which is clearly unphysical. An a priori more reasonable expansion of the FJ relation would be , where (see also Wyithe 2006, who carried out a similar fit for -). This now has the correct asymptotic behavior at large . The resulting best fit local - slopes are again almost identical to the results shown in Figure 4 over the range in we are interested in.
It is clear from Figures 3 and 4 that substantial curvature exists in the FP projections across the entire sample of normal (non-BCG) elliptical galaxies, with the exception of the dynamical mass vs. luminosity relation which is well-fit by a single power-law with , with , which implies . This dynamical mass-to-light ratio agrees well with the DR2 results of Padmanabhan et al. (2004). Padmanabhan et al. (2004) also show that the stellar mass-to-light ratio of early type galaxies is constant with luminosity, using stellar masses determined by Kauffmann et al. (2003). Thus accounts for at least some of the tilt of the FP in the r band relative to the virial theorem expectation. An increasing dark matter fraction with increasing stellar mass could be responsible for this dynamical mass-to-light ratio variation (Boylan-Kolchin et al., 2005).
As a check on the importance of non-homology for tilting the FP, Figure 5 shows the Sérsic index as a function of luminosity for our sample. Although the range of at any given luminosity is quite large, there is a clear trend of increasing for more luminous galaxies, as has been found by other authors (Caon et al., 1993; Graham et al., 1996; Ferrarese et al., 2006). This trend is slightly underestimated in the VAGC due to the systematic problems associated with the Sérsic fits, which result in fluxes, radii, and Sérsic indices being underestimated by 10% at (Blanton et al., 2005). The variation in we find is significantly less than what Ciotti et al. (1996) find is required for non-homology to fully account for the tilt in the FP across the entire luminosity range of early type galaxies. It is therefore likely that non-homology, while present, does not fully account for the tilt in the FP.
Aside from vs. , all of the other FP projections exhibit a local slope that varies systematically with luminosity from the faint end of the sample to the bright end. The slope of the radius-luminosity relation for elliptical galaxies varies systematically with luminosity, from at to at ; for the entire sample, we find , in good agreement with Shen et al. (2003) and Bernardi et al. (2003b). Our slope at faint luminosity of agrees with that found by Lauer et al. (2006a) for their lower-luminosity ellipticals. At the luminous end, however, Lauer et al. (2006a) find , much steeper than we see, though their sample consists primarily of BCGs in the V band. Bernardi et al. (2006) attribute curvature in the radius-luminosity relationship at high luminosity in the full SDSS sample to an increasing fraction of BCGs dominating the sample. Our results show, however, that the normal non-BCG population exhibits a steepening at high luminosity that does not appear to be attributable to contamination by BCGs (see §2.1).
The slope of the FJ relation also steepens from at to at ; the canonical FJ slope of is found in the middle of our sample, at . Our slope at faint luminosity for the FJ relation is similar to that found by Tonry (1981), but not as flat as that found by Matković & Guzmán (2005), who report for a sample of faint early-type galaxies; their sample, however, extends to much fainter magnitudes ( mag). At the luminous end, our value of is significantly smaller than the value of found by Lauer et al. 2006a, although this is again a result of their sample being primarily BCGs.
The density-luminosity and surface brightness-luminosity relations shown in Figures 2- 4 indicate that low-luminosity ellipticals have roughly constant densities and surface brightnesses, while more luminous ellipticals become progressively less dense and have lower surface brightness with increasing luminosity.
As discussed in §2, we find similar results for the FP projections regardless of the magnitude we use to define the sample (Petrosian, Sérsic, or de Vaucouleurs). More specifically, the local slopes of the quadratic fit to the FJ relation are nearly identical for all three magnitude types. For the radius-luminosity relation, de Vaucouleurs fits result in at the faint end and at the bright end, whereas with Sérsic fits the slope ranges from to , both similar to our default analysis (Fig. 4).
3.3 Brightest Cluster Galaxies
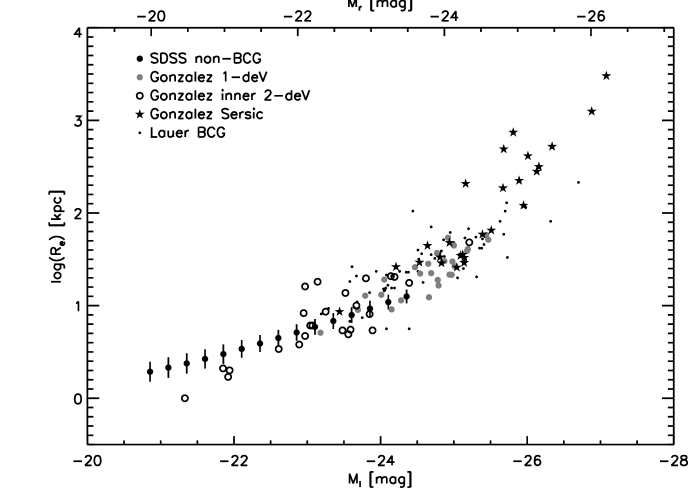
BCGs are at the extreme end of the luminous elliptical galaxy population; it is thus interesting to compare our results on the FP projections for luminous ellipticals to those of BCGs. Figure 6 shows our non-BCG SDSS data for the - correlation of ellipticals, along with a local sample of BCGs studied by Gonzalez et al. (2005), who extend previous BCG studies by studying the very extended low surface brightness emission at large radii and comparing a variety of full two dimensional models for BCG surface brightness profiles. We also include the local BCG sample of Lauer et al. (2006b). We use SDSS i band data shifted to the band of Gonzalez et al. using the median i-z colour and the transformation equations obtained from the SDSS website. (For ease of comparison, we also include the approximate r band magnitudes on the upper axis, using the median colour of r- for the SDSS sample.) The Lauer et al. (2006b) points are shown as dots, shifted to the band using a median colour of - for this sample. The solid grey points in Figure 6 are Gonzalez et al.’s 1-component de Vaucouleurs fits for and . They also argue, however, that Sérsic fits and fits with two de Vaucouleurs components (an inner and outer component) provide a much better description of the surface brightness profiles of BCGs; the resulting and are shown by stars and open circles in Figure 6, respectively. For the two-component de Vaucouleurs fits, Gonzalez et al. (2005) argue that the inner component may correspond to a “normal” elliptical galaxy while the outer component represents an extended envelope. Figure 6 shows, however, that most of the effective radii for Gonzalez’s inner component fits lie well outside the observed distribution of for normal ellipticals. This, together with the large scatter in the - relation for these inner component fits, makes it somewhat difficult to physically interpret the two component model for BCG surface brightness profiles.
The 1-component de Vaucouleurs fits for and from Gonzalez et al. (2005) yield an - correlation of . Lauer et al. (2006a) find a similar result for BCGs, as do Bernardi et al. (2006). For comparison, we find that at the luminous end of the normal elliptical galaxy population in the i band (note that this is slightly steeper than our r band slope). In Figure 7 we show the Faber-Jackson relation with our SDSS sample and the local BCG sample of Lauer et al. (2006a), both shifted to the band as described above. Lauer et al. (2006a) find for local BCGs, while we find for the most luminous ellipticals. The Faber-Jackson and - scalings for BCGs are thus significantly steeper than those for normal elliptical galaxies, even at the luminous end of the latter population. This is consistent with significant growth of BCGs via dissipationless mergers (see §4, also Boylan-Kolchin et al. 2006).
In Figures 8 & 9 we compare the r-band radius-luminosity and FJ relations of our non-BCG main sample to our reanalysis of the C4 BCGs. The BCGs were reanalyzed as described in §2.1, using the sky subtraction method of West et al. (2007). The radius-luminosity relation for BCGs appears distinct from the non-BCGs, exhibiting a steeper slope of . By contrast, the FJ relation for BCGs appears to smoothly match the non-BCG sample, although it flattens significantly above . The overall FJ slope for the BCGs is , similar to the slope at the luminous end of the non-BCG sample. Brighter than , however, the FJ slope for BCGs is , while fainter than , the slope is . These results agree reasonably well with Bernardi et al. (2006) and Lauer et al. (2006a), but von der Linden et al. (2006) find a much shallower radius-luminosity relation of for BCGs, consistent with normal elliptical galaxies. The latter sample is based on a careful reanalysis of C4 clusters, but with definitions of radius and luminosity that differ from those used here.
Most of the luminosity in BCGs arises in extended low surface brightness emission (e.g., Gonzalez et al. 2005). Thus observations of different depths will yield different luminosities and the inferred “galaxy” luminosity and radius hinge critically on how much of the extended low surface brightness emission is attributed to intra-cluster light rather than galaxy light. The importance of this is illustrated by Gonzalez et al.’s Sérsic fits in Figure 6, which give an - correlation of , very different from the correlation of their one component de Vaucouleurs fits. This highlights the subtlety in defining the radii and luminosity of BCGs, which needs to be taken into account when comparing the properties of normal ellipticals and BCGs.
4 DISCUSSION
We have analyzed the fundamental plane projections of elliptical galaxies as a function of luminosity, using a sample of galaxies drawn from DR4 of the SDSS. We have separated BCGs from our main elliptical galaxy sample and reanalyzed their photometry. The observables we consider are effective radius (), velocity dispersion (), dynamical mass (), effective density (), and effective surface brightness (). With the exception of the - correlation, we find clear evidence of variations in the slope of the FP projections with luminosity (Figs. 3 & 4) in the normal elliptical galaxy sample. The trends we find are that the radius-luminosity and Faber-Jackson relations are steeper at high luminosity relative to low luminosity and that more luminous ellipticals become progressively less dense and have lower surface brightnesses than lower luminosity ellipticals. These trends are consistent with existing results in the literature, though our results have much better statistics. It is interesting to note that the results we find appear to continue to even lower luminosity spheroidal systems. In particular, for a sample of dwarf elliptical (dE) and dwarf spheroidal (dSph) galaxies in the B band, the radius-luminosity power-law slope 0.28–0.55 and the Faber-Jackson power-law slope 1.5–2.5 (de Rijcke et al., 2005), broadly consistent with an extrapolation of our results to even lower luminosities. These trends are also seen in the dE sample of Graham & Guzmán (2003). We note, however, that there are likely structural differences between luminous ellipticals and dEs that complicate this simple extrapolation.
The variations in the FP projections we find at the luminous end are consistent with less and less dissipation during the formation of elliptical galaxies with increasing luminosity. Less dissipation would result in increasingly larger, less dense, lower surface brightness, and lower galaxies, relative to fiducial power-law scalings for the elliptical galaxy population. This interpretation is consistent with a variety of other observational evidence for less dissipation in the formation of luminous ellipticals (e.g., Kormendy & Bender 1996).
Luminosity (or galaxy-mass) dependent variations in the FP projections should in principle provide a strong constraint on galaxy formation models. For example, numerical simulations of gas-free (“dry”) merger remnants find that the FP projections have and for very wide orbits, while lower angular momentum and higher energy orbits have less energy exchange between stars and dark matter and thus the FP projections steepen to and (Boylan-Kolchin et al., 2006). These values of and are consistent with the trends we find in the data at the luminous end, suggesting an increasing importance of dry mergers for luminous ellipticals. For lower-luminosity ellipticals, however, dry mergers are less likely to be important in determining the properties of elliptical galaxies. Current simulations of elliptical galaxy formation via mergers of gas-rich disks find that the remnants lie roughly on the FP and its projections, with the gas fraction of the progenitor galaxies strongly affecting the properties of the resulting spheroidal merger remnants (Robertson et al., 2006). These simulations also find more dissipation in the formation of lower luminosity ellipticals, which is consistent with our data. It remains to be seen whether simulations of gas-rich mergers can also account for the systematic variations in the FP projections with luminosity (e.g., with a varying gas fraction).
We have also reanalyzed the photometry of SDSS BCGs using the C4 cluster sample of Miller et al. (2005); the standard pipeline photometry underestimates the luminosities and radii for luminous BCGs (Figure 1) due to an overestimate of sky background. With our corrected photometry, we find that the radius-luminosity relation of BCGs is noticeably steeper than that of normal (non-BCG) ellipticals and the FJ relation for BCGs flattens at the luminous end. The same trends are also seen in local samples of BCGs (eg., Lauer et al. 2006a). These observational results are consistent with significant growth of BCGs by dissipationless mergers.
4.1 Massive Black Holes
For the bulk of the elliptical galaxy population, both the - and Faber-Jackson relations scale roughly as . As noted in §1, however, Wyithe (2006) argued that the - relation steepens at high black hole masses and flattens at low masses, albeit with only modest statistical significance. Greene & Ho (2006) see a similar flattening at low black hole masses and Lauer et al. (2006a) argue for a similar steepening at high black hole masses based on the properties of the surface brightness cores in luminous elliptical galaxies. These luminosity-dependent variations in the - relation are qualitatively similar to the luminosity dependent variation in the FJ relation. Together with a constant , these results imply a roughly constant value of across a range of early type galaxies (see, e.g., Häring & Rix 2004 for a direct compilation of that bears this out). For massive galaxies, the approximate constancy of may be a consequence of dissipationless mergers, which preserve in the absence of energy loss by gravitational waves during black hole coalescence (Boylan-Kolchin et al., 2006). For lower luminosity ellipticals, however, gas dynamics is important and a constant value of implies a constant relative efficiency for forming stars and massive black holes in a given gravitational potential well.
ACKNOWLEDGMENTS
We thank Michael Blanton and David Schlegel for their advice and help with understanding the details of the VAGC. We also thank Tod Lauer, Michael Boylan-Kolchin, Alister Graham, Robert Lupton, David Fisher, and an anonymous referee for helpful conversations and comments. L.-B.D. is grateful for a Julie-Payette/Doctoral Fellowship from the Natural Sciences and Engineering Research Council of Canada and by the Canadian Space Agency. E.Q. is supported in part by NASA grant NNG05GO22H, the Alfred P. Sloan Foundation and the David and Lucile Packard Foundation. C.-P.M. is supported in part by NSF grant AST-0407351 and NASA grant NAG5-12173. A.A.W. is supported by NSF grant AST-0540567
Funding for the SDSS and SDSS-II has been provided by the Alfred P. Sloan Foundation, the Participating Institutions, the National Science Foundation, the U.S. Department of Energy, the National Aeronautics and Space Administration, the Japanese Monbukagakusho, the Max Planck Society, and the Higher Education Funding Council for England. The SDSS Web Site is http://www.sdss.org/.
The SDSS is managed by the Astrophysical Research Consortium for the Participating Institutions. The Participating Institutions are the American Museum of Natural History, Astrophysical Institute Potsdam, University of Basel, University of Cambridge, Case Western Reserve University, University of Chicago, Drexel University, Fermilab, the Institute for Advanced Study, the Japan Participation Group, Johns Hopkins University, the Joint Institute for Nuclear Astrophysics, the Kavli Institute for Particle Astrophysics and Cosmology, the Korean Scientist Group, the Chinese Academy of Sciences (LAMOST), Los Alamos National Laboratory, the Max-Planck-Institute for Astronomy (MPIA), the Max-Planck-Institute for Astrophysics (MPA), New Mexico State University, Ohio State University, University of Pittsburgh, University of Portsmouth, Princeton University, the United States Naval Observatory, and the University of Washington.
References
- Adelman-McCarthy et al. (2006) Adelman-McCarthy, J. K. et al. 2006, ApJS, 162, 38
- Bender et al. (1992) Bender, R., Burstein, D., & Faber, S. M. 1992, ApJ, 399, 462
- Bernardi et al. (2006) Bernardi, M., Hyde, J. B., Sheth, R. K., Miller, C. J., & Nichol, R. C. 2006, AJ, in press (astro-ph/0607117)
- Bernardi et al. (2003a) Bernardi, M. et al. 2003a, AJ, 125, 1866
- Bernardi et al. (2003b) —. 2003b, AJ, 125, 1849
- Bernardi et al. (2003c) —. 2003c, AJ, 125, 1817
- Blanton et al. (2003a) Blanton, M. R. et al. 2003a, AJ, 125, 2348
- Blanton et al. (2003b) —. 2003b, ApJ, 594, 186
- Blanton et al. (2003c) —. 2003c, ApJ, 592, 819
- Blanton et al. (2005) —. 2005, AJ, 129, 2562
- Boylan-Kolchin et al. (2005) Boylan-Kolchin, M., Ma, C.-P., & Quataert, E. 2005, MNRAS, 362, 184
- Boylan-Kolchin et al. (2006) —. 2006, MNRAS, 369, 1081
- Burstein et al. (1997) Burstein, D., Bender, R., Faber, S., & Nolthenius, R. 1997, AJ, 114, 1365
- Caon et al. (1993) Caon, N., Capaccioli, M., & D’Onofrio, M. 1993, MNRAS, 265, 1013
- Ciotti et al. (1996) Ciotti, L., Lanzoni, B., & Renzini, A. 1996, MNRAS, 282, 1
- Davies et al. (1983) Davies, R. L., Efstathiou, G., Fall, S. M., Illingworth, G., & Schechter, P. L. 1983, ApJ, 266, 41
- de Rijcke et al. (2005) de Rijcke, S., Michielsen, D., Dejonghe, H., Zeilinger, W. W., & Hau, G. K. T. 2005, A&A, 438, 491
- de Vaucouleurs (1948) de Vaucouleurs, G. 1948, Annales d’Astrophysique, 11, 247
- Djorgovski & Davis (1987) Djorgovski, S., & Davis, M. 1987, ApJ, 313, 59
- Dressler et al. (1987) Dressler, A., Lynden-Bell, D., Burstein, D., Davies, R. L., Faber, S. M., Terlevich, R., & Wegner, G. 1987, ApJ, 313, 42
- Faber & Jackson (1976) Faber, S. M., & Jackson, R. E. 1976, ApJ, 204, 668
- Ferrarese et al. (2006) Ferrarese, L. et al. 2006, ApJS, 164, 334
- Ferrarese & Merritt (2000) Ferrarese, L., & Merritt, D. 2000, ApJL, 539, L9
- Ferrarese et al. (2001) Ferrarese, L., Pogge, R. W., Peterson, B. M., Merritt, D., Wandel, A., & Joseph, C. L. 2001, ApJL, 555, L79
- Gebhardt et al. (2000) Gebhardt, K. et al. 2000, ApJL, 539, L13
- Gerhard et al. (2001) Gerhard, O., Kronawitter, A., Saglia, R. P., & Bender, R. 2001, AJ, 121, 1936
- Gonzalez et al. (2005) Gonzalez, A. H., Zabludoff, A. I., & Zaritsky, D. 2005, ApJ, 618, 195
- Graham & Colless (1997) Graham, A., & Colless, M. 1997, MNRAS, 287, 221
- Graham et al. (1996) Graham, A., Lauer, T. R., Colless, M., & Postman, M. 1996, ApJ, 465, 534
- Graham et al. (2005) Graham, A. W., Driver, S. P., Petrosian, V., Conselice, C. J., Bershady, M. A., Crawford, S. M., & Goto, T. 2005, AJ, 130, 1535
- Graham et al. (2001) Graham, A. W., Erwin, P., Caon, N., & Trujillo, I. 2001, ApJL, 563, L11
- Graham & Guzmán (2003) Graham, A. W., & Guzmán, R. 2003, AJ, 125, 2936
- Greene & Ho (2006) Greene, J. E., & Ho, L. C. 2006, ApJL, 641, L21
- Häring & Rix (2004) Häring, N., & Rix, H.-W. 2004, ApJL, 604, L89
- Jørgensen et al. (1995) Jørgensen, I., Franx, M., & Kjaergaard, P. 1995, MNRAS, 276, 1341
- Kauffmann et al. (2003) Kauffmann, G. et al. 2003, MNRAS, 341, 33
- Kormendy & Bender (1996) Kormendy, J., & Bender, R. 1996, ApJL, 464, L119+
- Lauer et al. (2006a) Lauer, T. R. et al. 2006a, ApJ, in press (astro-ph/0606739)
- Lauer et al. (2006b) —. 2006b, ApJ, in press (astro-ph/0609762)
- Lin et al. (1999) Lin, H., Yee, H. K. C., Carlberg, R. G., Morris, S. L., Sawicki, M., Patton, D. R., Wirth, G., & Shepherd, C. W. 1999, ApJ, 518, 533
- Magorrian et al. (1998) Magorrian, J. et al. 1998, AJ, 115, 2285
- Marconi & Hunt (2003) Marconi, A., & Hunt, L. K. 2003, ApJL, 589, L21
- Matković & Guzmán (2005) Matković, A., & Guzmán, R. 2005, MNRAS, 362, 289
- Miller et al. (2005) Miller, C. J. et al. 2005, AJ, 130, 968
- Nakamura et al. (2003) Nakamura, O., Fukugita, M., Yasuda, N., Loveday, J., Brinkmann, J., Schneider, D. P., Shimasaku, K., & SubbaRao, M. 2003, AJ, 125, 1682
- Oegerle & Hoessel (1991) Oegerle, W. R., & Hoessel, J. G. 1991, ApJ, 375, 15
- Oke & Gunn (1983) Oke, J. B., & Gunn, J. E. 1983, ApJ, 266, 713
- Padmanabhan et al. (2004) Padmanabhan, N. et al. 2004, New Astronomy, 9, 329
- Petrosian (1976) Petrosian, V. 1976, ApJL, 209, L1
- Postman & Lauer (1995) Postman, M., & Lauer, T. R. 1995, ApJ, 440, 28
- Robertson et al. (2006) Robertson, B., Cox, T. J., Hernquist, L., Franx, M., Hopkins, P. F., Martini, P., & Springel, V. 2006, ApJ, 641, 21
- Sérsic (1963) Sérsic, J. L. 1963, Boletin de la Asociacion Argentina de Astronomia La Plata Argentina, 6, 41
- Sérsic (1968) —. 1968, Atlas de galaxias australes (Cordoba, Argentina: Observatorio Astronomico)
- Shen et al. (2003) Shen, S., Mo, H. J., White, S. D. M., Blanton, M. R., Kauffmann, G., Voges, W., Brinkmann, J., & Csabai, I. 2003, MNRAS, 343, 978
- Sheth et al. (2003) Sheth, R. K. et al. 2003, ApJ, 594, 225
- Shimasaku et al. (2001) Shimasaku, K. et al. 2001, AJ, 122, 1238
- Tonry (1981) Tonry, J. L. 1981, ApJL, 251, L1
- Tremaine et al. (2002) Tremaine, S. et al. 2002, ApJ, 574, 740
- Trujillo et al. (2004) Trujillo, I., Burkert, A., & Bell, E. F. 2004, ApJL, 600, L39
- von der Linden et al. (2006) von der Linden, A., Best, P. N., Kauffmann, G., & White, S. D. M. 2006, MNRAS, in press (astro-ph/0611196)
- Wake et al. (2006) Wake, D. A. et al. 2006, MNRAS, in press (astro-ph/0607629)
- Wegner et al. (1999) Wegner, G., Colless, M., Saglia, R. P., McMahan, R. K., Davies, R. L., Burstein, D., & Baggley, G. 1999, MNRAS, 305, 259
- West (2005) West, A. A. 2005, Ph.D. Thesis
- West et al. (2007) West, A. A., et al. 2007, AJ, submitted
- Wyithe (2006) Wyithe, J. S. B. 2006, MNRAS, 365, 1082, Erratum: Wyithe, J. S. B. 2006, MNRAS, 371, 1536.
| FP Projection | |||
|---|---|---|---|
| vs. | 1.50 0.19 | -0.802 0.044 | 0.0805 0.0026 |
| vs. | -1.79 0.23 | 0.674 0.053 | -0.0234 0.0030 |
| vs. | -3.37 0.59 | 0.81 0.14 | 0.0199 0.0078 |
| vs. | -4.82 0.75 | 2.54 0.17 | -0.1845 0.0098 |
| vs. | 43.4 2.2 | -5.77 0.51 | 0.350 0.030 |
All fits are , where is the luminosity () and is the observable. is calibrated to the AB system, in which a magnitude 0 object has the same counts as a Jy source; is in units of km s-1; is in units of kpc; is in units of mag arcsec-2.