Planetary Nebula Candidates in Extragalactic Young Star Clusters ††thanks: Based on observations collected at the European Southern Observatory, Chile under programme 072.B-0242(A) and with the NASA/ESA Hubble Space Telescope, obtained at the Space Telescope Science Institute, which is operated by the Association of Universities for Research in Astronomy, Inc., under NASA contract NAS 5-26555
Abstract
Context. During an analysis of optical spectra of 80 young star clusters in several nearby spiral galaxies, O iii and N ii emission lines were noted in some cases. Three of these emission line sources are associated with clusters older than 30 Myrs, and are identified as likely planetary nebula (PN) candidates.
Aims. These objects may represent a rare opportunity to study PNe whose progenitor stars are known to be of intermediate masses, although detailed analysis is challenging because of the underlying strong continuum from the cluster stars. This paper presents and discusses basic properties of the PN candidates and their host clusters.
Methods. Based on the observed emission line fluxes, the excitation parameters and luminosities of the nebulae are derived. This allows a crude placement of the central stars in two of the objects on the H-R diagram. Cluster ages and masses are estimated from broad-band colours and by fitting model SSP spectra to the observed spectra.
Results. The two PN candidates where central star luminosities and temperatures can be estimated are found to be consistent with post-AGB model tracks for a central star mass of about 0.60 . One of the host clusters has an age of 32–65 Myrs, corresponding to a main sequence turn-off mass of = 6.6–9.0 M⊙. For the other cluster the age is 282–407 Myrs, corresponding to MTO = 3.2–3.6 M⊙. By estimating the number of stars evolving off the main sequence per year, a total of 6 PNe are expected in the full sample of 80 clusters for a PN lifetime of years. The factor of two disagreement with the actual observed number may be due, among other things, to uncertainties in PN lifetimes. It is interesting to note that all three PN candidates are associated with clusters which are more diffuse than average.
Conclusions. While PNe have previously been found in some old globular clusters, the candidates identified here are among the first identified in young star clusters.
Key Words.:
Galaxies: spiral – Galaxies: star clusters – Stars: AGB and post-AGB – planetary nebulae: general1 Introduction
Star clusters and planetary nebulae (PNe) can both be observed at distances well beyond the Local Group, and are thus valuable extragalactic population tracers. However, much remains to be understood about the post-main sequence evolution of low- and intermediate stars leading up to the PN stage, partly because of the difficulty in determining the distances and progenitor stellar masses of planetary nebulae in the Milky Way. For PNe associated with stellar clusters the initial mass of the progenitor star can be assumed to be that corresponding to the main sequence turn-off (unless the progenitor star is a close binary in which mass exchange has occurred), but the number of PNe known to be associated with stellar clusters remains small. Less than a handful of such objects are known to exist in Milky Way open clusters (Pedreros ped87 (1987, 1989); O’Dell odell63 (1963)) and four PNe have been found in Galactic globular clusters (M15, M22, Pal 6, NGC 6441; Jacoby et al. jac97 (1997)).
The distance problem can be alleviated by studying PNe in external galaxies with well determined distances. Many such searches have been carried out or are currently under way (Kwok kwok00 (2000); Feldmeier feld06 (2006); Magrini mag06 (2006)), but the detected candidates are typically field objects and the initial mass thus remains unknown. PNe have been identified in a few GCs in the nearby giant elliptical NGC 5128 (Minniti & Rejkuba mr02 (2002); Rejkuba et al. rej03 (2003)), and the significant number of on-going large spectroscopic surveys of extragalactic globular cluster systems are likely to reveal many more candidates. However, by studying PNe in ancient globular clusters one remains fundamentally limited to low-mass stars. One way to sample a larger range of stellar masses would be to collect a sample of PN candidates in younger stellar clusters. So far, the number of such objects are limited to the small number of PNe in Milky Way open clusters.
We have recently obtained optical spectra for a number of young star clusters in several nearby galaxies. The original aim of this programme was to carry out a detailed test of simple stellar population (SSP) models, but during the analysis we noted emission lines in some of the spectra. As discussed below, the clusters in question span a range of ages from a few tens of Myrs to several hundreds of Myrs, corresponding to main sequence turn-off masses between 3 and 9 M⊙. These objects potentially represent a valuable addition to the very few cases where PNe have been associated with young star clusters, and could provide a unique opportunity to study PNe where the distances and initial masses are known with some accuracy. The full spectroscopic dataset and analysis will be presented in a forthcoming paper, and here we concentrate on the few spectra where PN candidates were identified.
2 Data
Spectra of a sample of young massive clusters (YMCs) in several nearby spiral galaxies were obtained with the EMMI instrument on the ESO New Technology Telescope from March 16 - March 18, 2004. The observations were carried out in multi-slit mode, using the RILD (“Red Imaging and Low-Dispersion Spectroscopy”) mode and grism #3, which provided a spectral resolution of over the wavelength range 4000Å– 9000Å. In each of the 7 slitmasks, typically 3 exposures of 3600 s each were obtained with the CCDs read out in 22 binned mode. The full spectroscopic sample included 80 clusters in four galaxies (NGC 2835, NGC 2997, NGC 3621 and NGC 5236), selected primarily from the sample presented in Larsen (lar99 (1999)). In order to maximise the fraction of bona-fide star clusters (as opposed to “asterisms” or loose associations), as many objects as possible with imaging from the Hubble Space Telescope (HST) were included (Larsen larsen04 (2004)). The astrometry for the slitmask design was based on pre-imaging data obtained with EMMI in service mode on Jan 28, 2004, exposed for 5 min in the -band.
The spectra were reduced with standard tools in the IRAF111IRAF is distributed by the National Optical Astronomical Observatories, which are operated by the Association of Universities for Research in Astronomy, Inc. under contract with the National Science Foundation ONEDSPEC package and were wavelength- and flux calibrated using observations of HeAr calibration lamps and the flux standards Hiltner 600 and LTT 2415 (Stone & Baldwin sb83 (1983); Hamuy et al. ham94 (1994)). Small additional corrections (on order Å) to the wavelength scale were applied using the [O i] 5577.35Å night sky line.
Accurate absolute flux calibration of slit spectra is always challenging due to slitlosses, which depend on the seeing and accurate centring of objects on the slit. Because EMMI does not have a functioning atmospheric dispersion corrector, an additional complication for multislit spectroscopy is differential refraction, which causes the slitlosses to be wavelength dependent as the slits cannot be aligned with the parallactic angle for the entire duration of an exposure. Other factors, such as the spatial distribution of the targets, also limit the freedom to choose the orientation of the slits. Although the observations were carried out at low airmass (generally ), some differences were noted in the flux calibration between individual observations of the same targets.
We attempted to bring our spectra closer to an absolute flux scale by scaling them to match the fluxes derived from the ground-based photometry. Since the wavelength range covered by the EMMI spectra includes four of the photometric passbands () for which broad-band photometry is available, the wavelength-dependent nature of the slit losses could also be accommodated. This was done by forming the ratio of the photometric fluxes () in each band to the fluxes measured in the corresponding wavelength ranges of the spectra (), and then producing a correction function by fitting a second-order polynomial to the resulting ratio . Within a given exposure, differences in the overall scaling of individual spectra could be as large as %. This may reflect uncertainties in the photometric as well as the spectroscopic measurements. The shapes of the individual correction functions showed better agreement. Furthermore, for some objects (e.g. H ii regions dominated by strong emission lines) it was not possible to construct reliable correction functions. We therefore applied one average correction function to all spectra obtained in a given exposure, based on about half of the objects in a given slitmask. Typically, the correction amounted to 10%–20%, but in the most extreme cases it could be as much as a factor of 2. Each spectrum was then multiplied by the correction function, and the several individual spectra of each object were averaged (using a sigma-clipping algorithm to reject cosmic-ray hits) to produce the final spectra.
Visual inspection of the reduced spectra generally revealed A-type spectra with strong Balmer lines, as expected for young star clusters with ages on the order of years. Some very young objects, known from ground-based narrow-band imaging to be embedded in H emission, were also included, and showed the expected strong emission lines from H, N, and O characteristic of H ii regions. Here we concentrate on three spectra which showed weaker [O iii] and [N ii] emission lines superimposed on A-type stellar spectra, for which both broad-band photometry and a comparison with model spectra suggest ages significantly greater than years (§3.2). Ground-based H images showed no line emission in the immediate vicinity of these objects, again suggesting that the emission-line objects contained in the star clusters are not H ii regions. As discussed below, a more likely (although not entirely unique) explanation is that these clusters contain planetary nebulae (PNe).
The three clusters discussed here are located in the two galaxies NGC 5236 and NGC 3621, both of which are actively star-forming, nearby spiral galaxies. Throughout this paper, we assume distance moduli of for NGC 5236 (Thim et al. thim03 (2003)) and for NGC 3621 (Rawson et al. raw97 (1997)). For the foreground extinction we use the Schlegel et al. (sch98 (1998)) values of mag (NGC 5236) and mag (NGC 3621). For a more comprehensive listing of the properties of the host galaxies we refer to Larsen & Richtler (lr00 (2000)).
3 Analysis
3.1 Basic properties of the emission-line sources
N5236-254
N5236-487
N3621-1106
| Fluxes erg s-1 cm-2 | |||
| N5236-254 | N5236-487 | N3621-1106 | |
| Line | |||
| H 4861 | 6.0 | 2.2 | 4.6 |
| H 6562 | 18.4 | 12.3 | -0.15 |
| O iii 4959,5007 | 6.9, 20.6 | 4.1, 12.1 | 7.2, 21.7 |
| N ii 6548,6584 | 5.6, 16.7 | 0.7, 2.2 | 4.7, 14.1 |
| Mean Error | 1.3 | 0.8 | 2.9 |
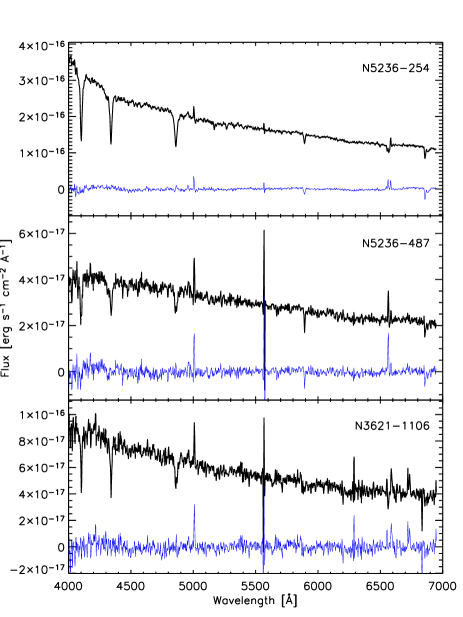
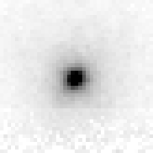
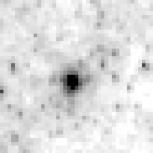
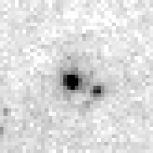
The EMMI spectra of the three objects are shown in Fig. 1. All three objects happened to have images from the Wide Field Planetary Camera 2 (WFPC2) on board the Hubble Space Telescope (HST), as shown in Fig. 2. Two of the objects are located in NGC 5236 (N5236-254, N5236-487 in the list of Larsen lar99 (1999)), while the third is in NGC 3621 (N3621-1106). The morphological appearance of all three objects is generally consistent with that of star clusters, all of them being significantly more extended than the WFPC2 point-spread function, but still fairly compact and with regular, symmetric profiles. Note, though, that N3621-1106 has a fainter companion at a projected separation of ( pc). The companion is also resolved in the HST images, and thus also a likely cluster candidate. Whether the two objects represent a chance alignment or a real physical pair is difficult to tell, however. Similar colours would suggest similar ages for the two objects and thus make a chance alignment less likely, but the ground-based imaging has insufficient resolution to address this question and the HST data are available in only one band. The half-light radii listed in Larsen (larsen04 (2004)) are 10.1 pc, 6.7 pc and 7.2 pc for N5236-254, N5236-487 and N3621-1106, respectively. While these sizes are consistent with those of star clusters, it is interesting to note that all three clusters have larger half-light radii than the mean value of 3–4 pc which is typical for both young and old clusters (Whitmore et al. whit99 (1999); Larsen larsen04 (2004); Jordán et al. jordan05 (2005)).
The spectral signal-to-noise ratio per pixel in the dispersion direction is about 106, 30 and 24 at 5000Å for N5236-254, N5236-487 and N3621-1106, respectively. The [O iii] 4959,5007Å and [N ii] 6548,6584Å lines are noticeable in all three spectra, but much weaker than typically seen in H ii regions. Balmer lines are expected to be seen in emission in both planetary nebulae and H ii regions, but in our cluster spectra the Balmer lines are dominated by the underlying strong absorption lines from the stellar component.
In order to remove the stellar component from the spectra, model spectra from the library of González-Delgado et al. (gon05 (2005)) were subtracted from the observed spectra. The library contains model spectra for the integrated light of simple stellar populations with ages between 1 Myr and 17 Gyr, tabulated at 0.3Å resolution. A Salpeter (salp55 (1955))-like IMF is assumed. The best-fitting model spectra were selected by minimising the r.m.s. residuals between the observed spectra (shifted to zero radial velocity) and smoothed model spectra. Because of the uncertainties in the absolute flux calibration and the reddening corrections, the model spectra were multiplied by a polynomial to follow the same large-scale spectral energy distribution as the observed spectra. This was done by fitting the ratio of the observed to model spectra with a 5th-order polynomial and multiplying the model spectra with this polynomial, rather than scaling them by a single constant, before calculating the r.m.s. residuals. The González-Delgado et al. library includes models based on both the Geneva and Padua stellar isochrones and for a range of metallicities, but for this work we only used Solar metallicity models based on the Padua isochrones. The analysis carried out in the following does not depend strongly on the model choice. For NGC 5236, analysis of H ii regions (Bresolin & Kennicutt bk02 (2002)) yields an oxygen abundance very close to Solar [12+log(O/H)=8.9] at the galactocentric distance of the two clusters ( for N5236-254 and for N5236-487). For NGC 3621, the work of Ryder (ryder95 (1995)) indicates 12+log(O/H)=9.0 at the position of N3621-1106, from the centre. The use of Solar metallicity models thus appears justified. The only remaining free parameter is then the age, and for each cluster we selected the model spectrum of the age which gave the best fit to the data.
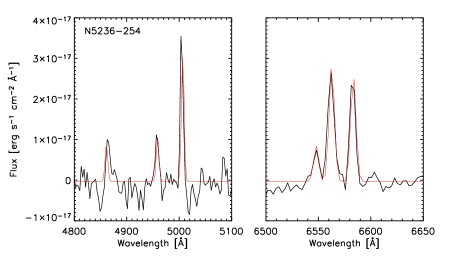
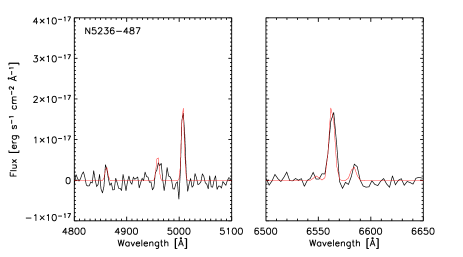
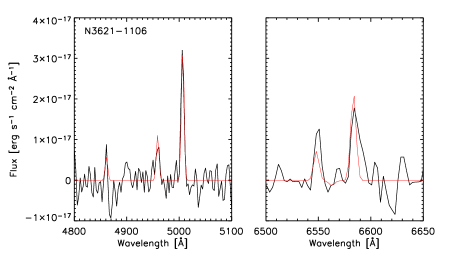
Fig. 3 shows the regions around the H[O iii] and H[N ii] lines after subtraction of the best-fitting, scaled solar-metallicity models. Emission line fluxes were measured by fitting Gaussian line profiles to the emission line spectra. The [O iii] 5007/4959Å and [N ii] 6584/6548Å line ratios were kept fixed at 3.0 as dictated by atomic physics (e.g. Osterbrock osterbrock (1988)), while the [O iii]/H and [N ii]/H ratios were allowed to vary. The resulting best-fitting Gaussian models are overplotted on the spectra in Fig. 3. For the two emission-line sources associated with YMCs in NGC 5236, no further shifts in wavelength were required to match the line profiles and the sources are likely to be physically associated with the clusters. The best fit for N3621-1106 was obtained if an additional shift of about km/s was applied to the observed spectrum, so in this case the source of the emission lines may not be physically associated with the cluster.
Table 1 lists the emission line fluxes obtained from the fits in Fig. 3. Errors were estimated by fitting emission lines at 8 different wavelengths where none were expected. The mean errors in the table represent the standard deviation of these 8 test measurements. It should be emphasised that these error estimates only account for random measurement errors. The line fluxes may be further affected by systematic errors, for example due to inaccurate subtraction of the stellar continuum. To investigate this issue, we repeated the emission line measurements after subtracting SSP models based on the Padua isochrones, and and models based on the Geneva isochrones. The resulting emission line fluxes generally agreed with those listed in Table 1 within the stated one-sigma errors. Only for the H line in the spectrum of N5236-254 was a somewhat larger deviation encountered – for this line, a flux of erg-1 cm-2 was returned when using the Padua-based SSP model, i.e. a 2.7 deviation. In conclusion, although some systematic errors cannot be entirely ruled out, the error estimates in Table 1 appear to be fairly realistic overall. The flux calibration may account for a further % uncertainty on the line fluxes, although relative line ratios are probably more accurate. Finally, the magnitudes, defined as (Jacoby jac89 (1989)), are also listed.
3.2 Host cluster properties
| N5236-254 | N5236-487 | N3621-1106 | |
| log(age/yr)phot | |||
| [mag] | |||
| log(age/yr)spec | 8.45 | 7.50 | 7.70 |
| 376–495 | 29–51 | 94–187 | |
| 3.2–3.6 | 6.6–9.0 | 4.5–7.3 |

Photometry for the clusters was taken from Larsen (lar99 (1999)). Table 2 lists the broad-band colours for each cluster, corrected for foreground extinction only. From the broad-band colours, rough age estimates can be obtained by comparison with predictions by simple stellar population (SSP) models, or by using the empirical ‘S’-sequence calibration (based on LMC clusters) by Girardi et al. (gir95 (1995)). Fig. 4 shows the vs. two-colour diagram, including the S-sequence and photometry for the three clusters. Based on this plot, N5236-487 appears to be the youngest of the three objects with (age)7.8, while N5236-254 is the oldest ((age)). Including all the colours available in Table 2 and comparing with solar metallicity SSP models from Bruzual & Charlot (bc03 (2003)), the photometric age and extinction estimates listed in Table 2 were obtained. Here, denotes the extinction required to best match the observed colours in addition to the foreground extinction. Errors on the age- and extinction estimates were estimated by a Monte-Carlo procedure: First, random offsets were added to the observed colours, and the age- and extinction were then re-derived. The offsets were drawn from a Gaussian distribution with standard deviation equal to the photometric errors on each colour. The errors on the ages and extinctions were then estimated as the standard deviation of the individual values obtained from 100 such experiments. The ages derived from the comparison with SSP models agree quite well with those inferred from Fig. 4.
The extinction estimates in Table 2 can be compared with those derived from the H/H line ratios in Table 1. Assuming the Case B recombination ratio F(H)/F(H) = 2.85 (e.g. Osterbrock osterbrock (1988)), we derive mag for N5236-254 and mag for N5236-487. These values are consistent with the photometric values, although the errors are larger. In the case of N3621-1106, both H and H are essentially non-detections, and it is not possible to derive a meaningful extinction estimate.
Also listed in Table 2 are the spectroscopic age estimates, which are simply the ages of the best-fitting SSP model spectra. The spectroscopic ages tend to be lower than the photometric ones, although for any individual cluster the difference between the two age estimates is not much larger than the error. However, the relative ranking of the clusters remains the same. A detailed comparison of photometric and spectroscopic ages, using the full sample, will be carried out in a separate paper. Because the continuum shape was not fitted, no constraints on the extinction are available from the spectral fits.
Once the ages and reddenings are known, the cluster masses can be estimated by combining the SSP model predictions for mass-to-light ratios with the observed magnitudes and adopting the distances for the galaxies quoted above. Table 2 lists these photometric mass estimates, assuming a stellar mass function with the Salpeter slope () extending down to 0.1 M⊙. For a more realistic IMF (e.g. Kroupa kroupa02 (2002)) the masses would be lower by a factor of 1.6. The mass ranges given in the table correspond to the difference between the photometric and spectroscopic ages, with the lower masses corresponding to the younger ages.
The main sequence turn-off masses, , corresponding to the cluster ages were obtained from the Salasnich et al. (sal00 (2000)) stellar model tracks. Again, Table 2 lists a range corresponding to the photometric and spectroscopic ages. If the emission line sources are indeed PNe associated with their putative host clusters, then their progenitor stars should have started out with masses close to the cluster turn-off masses.
3.3 The nature of the sources: planetary nebulae?
Several classes of objects show emission line spectra, but not all are consistent with the characteristics of the objects studied here. First, H ii regions are common in star-forming galaxies. Our full sample contains several such objects, which generally show very different spectra than those in Fig. 1. The emission line equivalent widths of H ii regions are generally much larger than in the spectra in Fig. 1, and the excitation is typically lower (e.g. Acker et al. acker87 (1987)). Furthermore, young star-forming regions tend to have a much less regular structure than the smooth profiles indicated by the images in Fig. 2. Finally, only clusters younger than Myrs contain stars which are hot enough to produce the ionising radiation required to excite an H ii region, while we derive significantly higher ages for the three objects studied here (§3.2). We can therefore exclude with fairly high confidence that the objects are H ii regions.
Wolf-Rayet stars also show strong emission lines, but again the spectra are quantitatively (and qualitatively) very different from those observed here. In particular, the lines in W-R star spectra are very broad (several 1000 km/s) and would be easily resolvable at the spectral resolution of our EMMI data. As for H ii regions, the ages of the clusters studied here make it highly unlikely that they contain W-R stars, whose progenitors are believed to be massive (; Humphreys et al. hum85 (1985)) stars with lifetimes of only a few Myrs. We note, however, that a few objects in our full sample do show the characteristic W-R bumps at 4650Å and 5812Å (e.g. Torres & Massey tm87 (1987)), but these features are entirely absent from the spectra in Fig. 1.
A third possibility, which is more difficult to dismiss, is symbiotic stars (SSs). These are binary systems in which a red giant is transferring material to a hot compact companion, such as a white dwarf (Kenyon ken86 (1986)). Mass loss from the red giant results in a nebula which is ionised by the hot companion, producing a spectrum very similar to that of a planetary nebula. The main difference is that the spectrum of a SS contains an extra component in addition to the emission-line spectrum and the spectrum of the hot star, namely that of the red giant. However, for our sources it is impossible to detect this small addition to the continuum on top of the cluster spectrum. On the basis of the data at hand, it is difficult to distinguish between symbiotic stars and planetary nebulae as the most likely sources of the emission lines seen in our spectra. The progenitor stars are also expected to be similar, in both cases involving red giants or AGB stars.
Most surveys of Galactic and extra-galactic emission-like objects identify a larger number of PNe than SSs, and we might thus expect on statistical grounds that our candidates are more likely to be PNe. About 1500 PNe are known in the Milky Way (Kohoutek kohoutek01 (2001)), while less than 200 symbiotic stars are catalogued (Belcyński et al. bel00 (2000)). Unfortunately, the completeness of these catalogues is very difficult to assess for either type of object, and the classification of at least 50 objects in the Milky Way alone is still ambiguous (Kohoutek kohoutek01 (2001)). The total number of PNe in the Milky Way is estimated to be about 25000 (Buzzoni et al. buz06 (2006)), but this is little better than an order-of-magnitude estimate. The uncertainty on the number of SSs may be even greater, with estimates ranging from 3000 (Kenyon ken86 (1986)) to as many as 300.000 (Munari & Renzini mr92 (1992)).
Surveys of PNe and SSs in the Magellanic Clouds have the advantage that the distances are known with reasonable accuracy. About a dozen SSs are known in the LMC and SMC. These have H luminosities in the range erg s-1 (Morgan morgan92 (1992)), i.e. all are fainter than the H fluxes derived for the objects studied here (§3.4). For typical effective temperatures of the hot component of K (Mürset et al. muerset96 (1996)), the [O iii] 5007 flux is about an order of magnitude greater than the H flux. As a crude estimate, there may then be about 10 SSs in the Clouds with L([O iii]) erg s-1 (although, again, an unknown completeness correction may apply). For comparison, more than 100 PNe with L([O iii]) erg s-1 are catalogued in the Clouds (Jacoby et al. jac90 (1990)). Thus, at least at the high-luminosity end, PNe appear to outnumber SSs by about an order of magnitude in the Magellanic Clouds. Furthermore, Mürset et al. (muerset96 (1996)) conclude that the LMC SSs most likely belong to a population older than 4 Gyrs, which is much older than the clusters studied here (§3.2). It is also worth noting that no SSs are known to be associated with stellar clusters in the Milky Way while about 7 PNe have been found in Galactic globular or open clusters, as noted in the Introduction.
We thus proceed under the assumption that the emission-line objects found here are most likely planetary nebulae, although symbiotic stars cannot be entirely ruled out as an alternative. Repeat observations might help clarify this issue, as SSs often show significant variability on time scales of days, weeks or months. A detailed analysis of the nebular properties using high-dispersion spectroscopy might also help distinguish between SSs and PNe, since SSs typically have times higher densities than PNe (Kenyon ken86 (1986)). As a further note, it seems to us that the identification issue frequently receives less attention than it merits in extragalactic PN surveys.
3.4 Physical properties of the PN candidates

| N5236-254 | N5236-487 | N3621-1106 | |
| L (H) [ erg s-1] | 5.140.85 | 4.440.73 | - |
| L (H) [ erg s-1]⋆ | 1.800.30 | 1.560.25 | - |
| L ([O III]) | 6.110.99 | 5.100.84 | 18.74.49 |
| M5007 | |||
| Excitation parameter () | 1.520.14 | 1.470.14 | - |
| [K] | 4.660.02 | 4.650.02 | - |
| [] | 3.790.08 | 3.730.08 | - |
Because only the strongest emission lines can be measured in the spectra, it is not possible to derive basic nebular properties such as temperature and density directly. While this limits the amount of physical information that can be extracted from the spectra, some constraints can be put on the total luminosities and effective temperatures of the ionising sources. Dopita et al. (dop92 (1992)) have published an extensive set of model calculations, allowing estimates of these properties from observations of the Balmer lines and strong forbidden lines. They define the excitation parameter as for . For higher excitation parameters the He ii 4686Å line is required. This line is not detected in our spectra, but as will be seen below the excitation parameters derived here are sufficiently low that only the O and H lines are needed.
Measurements of the Balmer emission lines rely critically on correct subtraction of the underlying cluster spectra. From Fig. 3 it is difficult to assess the reliability of this subtraction for H. The H line, on the other hand, is stronger and less diluted by the stellar absorption, and therefore easier to measure reliably, at least for the two objects in NGC 5236. For the object in NGC 3621, neither H nor H can be reliably measured. Thus, in the following discussion we concentrate on the two objects in NGC 5236, for which the association with the star clusters is anyway more secure.
Table 3 lists the basic parameters derived for the nebulae. The H fluxes were estimated from the measured H values assuming the Case B recombination ratio, but the results do not change much if we use the measured H fluxes directly. For N5236-254, the de-reddened H flux [ erg s-1] agrees almost exactly with that derived from the H flux. For N5236-487 the de-reddened H flux is erg s-1, about 40% lower than the value derived from H, but with a larger formal error. All line fluxes have been de-reddened using the Cardelli et al. (car89 (1989)) extinction curve and the extinction estimates from Table 2. The quoted error estimates include a 0.15 (0.20) mag uncertainty on the distance modulus of NGC 5236 (NGC 3621). For reference, the [O iii] luminosities have been converted to absolute magnitudes. These are well within the range expected for planetary nebulae; the tip of the planetary nebula luminosity function is at (e.g. Kwok kwok00 (2000)).
Based on the excitation parameters and the H luminosities, the effective temperatures and total luminosities of the central stars () were derived using the relations given in Dopita et al. (dop92 (1992)). The errors on and were estimated simply by propagating the random measurement errors, and thus do not include any systematic errors in the calibration. Such errros might result, for example, from metallicity differences between the LMC and SMC calibrator PNe used by Dopita et al. and the objects studied here. For the relevant temperature range, Dopita et al. find that the L(H)/Lcs ratio changes by only percent for O abundances between 0.1 and 2 times Solar (their Fig. 1). Over the same metallicity range, varies by dex for a fixed . The error estimates in Table 3 do not include uncertainties on the reddening. For and the effect on the error budget is negligible ( mag for N5236-487) while the additional uncertainty on is dex for N5236-487. In both cases, the associated errors for N5236-254 are even smaller.
The H-R diagram for the two nebulae in NGC 5236 is shown in Fig. 5 together with H-burning post-AGB evolutionary tracks from Vassiliadis & Wood (vw94 (1994)). Curiously, the two central stars have very similar luminosities and effective temperatures, in both cases corresponding to a mass close to 0.60 . This is somewhat lower than predicted by the Vassiliadis & Wood tracks for initial masses of 3.2–3.6 (for N5236-254) and (N5236-487). Empirically, the initial-final mass relation for AGB and post-AGB evolution shows a fairly large scatter. It may be nearly flat for M⊙, although most studies suggest that a star with an initial mass is more likely to produce a M⊙ remnant (Kwok kwok00 (2000); Ferrario et al. fer05 (2005); Weidemann we00 (2000)). It would clearly be desirable to put stronger constraints on the physical properties of these PNe.
We have used the solar-metallicity (Z=0.016) tracks in Fig. 5, but the Z=0.004 tracks do not differ much and the inferred core masses would be lower by only M⊙. The formal errors from Table 3 are smaller than the plot symbols, but we emphasise that a more robust analysis, using better data, would be desirable. However, since the model tracks are nearly horizontal in the H-R diagram, uncertainties on are of minor importance for the comparison with the post-AGB tracks. Likewise, uncertainties on the flux calibration and reddening correction should lead to shifts of no more than 10-20%, or dex in . The difference between the measured and derived H flux for N5236-487 corresponds to a shift of 0.2 dex (downward) in .
From Fig. 3 one notes significant differences in the relative strengths of the [N ii] and [O iii] lines. In N5236-254 and N3621-1106 the [N ii] lines are only slightly weaker than the [O iii] lines, while in N5236-487 they are about factor of 6 weaker. This may appear somewhat puzzling, considering the very similar parameters derived for the central stars in the two PNe in NGC 5236. However, the PNe studied here fall well within the range of [O iii]/[N ii] line ratios seen in Galactic PNe (Cuisinier cui96 (1996)), which indeed show a very large range in the relative abundances of N and O. This is likely related to CNO processing in the progenitor stars (Peimbert & Serrano peim80 (1980)) and the ratio of N to O is expected on theoretical grounds to increase steeply with progenitor mass (Renzini & Voli ren81 (1981)). With the current data we cannot carry out an actual abundance analysis, but it may be worth noting that the spectrum having the weakest N lines is that associated with the youngest cluster (and thus the highest progenitor star mass). The H line is also stronger relative to the [N ii] doublet in N5236-487 than in the other objects. At least qualitatively, this seems consistent with the overall decrease in the [N/O] abundance ratio with decreasing [N ii]/H line ratio noted by Perinotto & Corradi (pc98 (1998)), again hinting that N5236-487 may have a decreased [N/O] ratio, rather than an enhanced one as expected for a massive progenitor.
3.5 Observed vs. predicted number of PNe


Fig. 6 shows the absolute magnitude vs. the (photometric) age estimate for all 80 clusters included in the full spectroscopic sample. Ages were estimated by matching the observed colours against SSP model predictions from Bruzual & Charlot (bc03 (2003)) as described in §3.2. Of the 80 clusters, 28 have ages less than and are thus unlikely to host planetary nebulae. For the remaining 52 clusters, it is of interest to compare the expected number of PNe with the 2–3 objects actually detected (in the clusters marked by filled circles).
Recently, Buzzoni et al. (buz06 (2006)) have given an extensive discussion of planetary nebulae as population tracers. However, their main focus is on populations older than about 1 Gyr and their results are not directly applicable to our case. In the following it is assumed that a stellar cluster consists of stars born in a single burst of negligible duration compared to the age of the cluster. As the age spread within a cluster is typically only a few Myrs at most, this is a reasonable assumption for clusters which are old enough to host PNe. If the (initial) mass of a TP-AGB star which is just about to become a PN is labelled , then the stellar death rate is the number of stars with masses in a small range (), divided by the difference in the stellar lifetime () across the mass interval . The predicted number of PNe in the cluster is then
| (1) |
where is the fraction of stars which will actually end their lives as PNe and is the observable PN lifetime. is the number of stars in the cluster with masses less than and is the lifetime of a star with mass . Eq. (1) can be rewritten as
| (2) |
where is the stellar IMF, , (normalised to a total mass of 1) and is the total mass of the cluster (see also Renzini & Buzzoni rb86 (1986) and Buzzoni et al. buz06 (2006)). For a Salpeter (salp55 (1955)) IMF populated with masses between and we have
| (3) |
with . The denominator in Eq. (2) can be estimated from stellar evolutionary tracks. Fig. 7 shows the stellar lifetime until the TP-AGB phase as a function of initial mass according to the evolutionary tracks in Salasnich et al. (sal00 (2000)). Also shown in the figure is a power-law fit to vs. , which gives yr. Inserting the derivative of this fit in Eq. (2), the curve in Fig. 8 is obtained. This shows the predicted number of PNe per M⊙ as a function of age, assuming that all stars go through the PN phase () and that the PNe are observable for a period of years (e.g. Marigo et al. mar01 (2001)), independent of initial mass. The lifetime is probably the largest contributor to the uncertainty in this calculation. We also note that the power-law fit tends to underestimate the slope at the low-mass end, so that the number of PNe is over-predicted for ages greater than several Gyrs. However, for the age distribution of our clusters this is not a problem.
Using mass-to-light ratios from the Bruzual & Charlot SSP models, the number of PNe per unit luminosity can be calculated. This is shown in Fig. 9 for the -band. While the expected frequency of PNe still depends on age, the dependence on assumptions about the low-mass end of the IMF disappears when normalising to luminosity instead of mass. This is because the PNe progenitors are among the most luminous stars in a SSP while the low-mass stars contribute very little to the luminosity of a SSP. This makes the curve in Fig. 9 more directly comparable to observations. Of course, the same IMF has to be used when computing the number of PNe per mass (Eq. 2) and for the subsequent evaluation of the mass-to-light ratios. Here we are assuming a Salpeter-like IMF extending down to 0.1 . The PN formation rate derived here agrees within about a factor of two with the estimates by Renzini & Buzzoni (rb86 (1986)).
We can now estimate the number of PNe expected in each cluster in Fig. 6. From Fig. 8 and Fig. 9 it is clear that, on average, less than 1 PN is expected per cluster. By summing up the expected numbers of PNe in all clusters in the sample we estimate a total of 6 PNe in the age range . This is to be compared with the 2–3 objects actually observed. Note that this assumes an observable PN lifetime of years – if, for example, the lifetimes are shorter by a factor of two, then the predicted number of PNe would be lower by the same factor. Since the PN lifetimes are a steep function of the central star mass, with more massive progenitor stars expected to produce shorter lifetimes (Schönberner & Blöcker sb96 (1996)), the agreement appears satisfactory and these rough estimates certainly suggest that the detection of a small number of PNe in a spectroscopic survey like the one carried out here is indeed expected. Alternatively, we can compare with the empirical estimate of the PN specific frequency from Magrini et al. (mag03 (2003)), who estimate an average of one PN per -band L⊙ for Local Group galaxies (ignoring any age dependence). The integrated -band luminosity of all clusters in our sample older than 30 Myrs is about L⊙, corresponding to 4 PNe. A search of PNe in a larger sample of young and intermediate-age star clusters might prove rewarding.
4 Summary and conclusions
In a sample of optical spectra of 80 young extragalactic star clusters, 3 emission line objects were detected which we identify as likely PN candidates. Two of these have radial velocities consistent with those of their host clusters, while the third displays a shift of about 150 km/s and may be a field object falling on the slit by chance. The analysis of the candidate PN spectra is complicated by the relatively low spectral resolution and the strong underlying stellar spectra. This is a problem especially for the Balmer lines, which are very strong in absorption in the cluster spectra and thus mask the comparatively weak line emission from the PNe. However, it was found that the line emission can be reasonably well separated by subtracting out synthetic SSP model spectra from the library of González-Delgado (gon05 (2005)).
All three objects have [O iii] emission line fluxes consistent with those expected from PNe. For the two objects where the association with clusters is most robust (both in NGC 5236), the excitation parameters and total luminosities were estimated and the central stars were placed on the H-R diagram. Comparison with post-AGB evolutionary tracks from Vassiliadis & Wood (vw94 (1994)) indicates central star masses of about 0.60 .
Based on stellar evolutionary timescales, we estimate that a total of about 6 PNe are expected in the 80 star clusters for a PN lifetime of years. Instead, 2–3 are detected here, which we consider reasonable agreement. Scaling the empirical estimate of the PN specific frequency from Magrini et al. (mag03 (2003)) predicts a total of 4 PNe in our sample, although the age distribution of our PN host clusters is likely different from that of the Local Group stellar populations on which the Magrini et al. estimate is based. A systematic search for PNe in a larger sample of extragalactic star clusters might put useful constraints on the PN lifetimes and the range of stellar masses that produce PNe. High-dispersion spectroscopy would allow a better subtraction of the underlying cluster spectra and thus more accurate measurements of the emission lines, and would provide constraints on the kinematic properties (expansion velocities) of the nebulae. Further observations would also provide constraints on time variability, and thus help distinguish between PNe and other possibilities (e.g. symbiotic stars).
Acknowledgements.
We thank J. Walsh and A. Zijlstra for their encouragement and several useful discussions. SSL thanks G. Pugliese for assistance and company during the observations. The anonymous referee provided several helpful comments which led to significant improvements in the paper. This research has made use of the NASA/IPAC Extragalactic Database (NED) which is operated by the Jet Propulsion Laboratory, California Institute of Technology, under contract with the National Aeronautics and Space Administration.References
- (1) Acker, A., Chopinet, M., Pottasch, S. R., & Stenholm, B., 1987, A&AS, 71, 163
- (2) Belczyński, K., Mikołajewska, J., Munari, U., Ivison, R. J., & Friedjung, M. 2000, A&AS, 146, 407
- (3) Bresolin, F., & Kennicutt, R. C., Jr., 2002, ApJ, 572, 838
- (4) Bruzual, G. A., & Charlot, S., 2003, MNRAS, 344, 1000
- (5) Buzzoni, A., Arnaboldi, M., & Corradi, R. L. M., 2006, MNRAS, 368, 877
- (6) Cardelli, J. A., Clayton, G. C. and Mathis, J. S. 1989, ApJ, 345, 245
- (7) Cuisinier, F., Acker, A., & Koeppen, J., 1996, A&A, 307, 215
- (8) Dopita, M. A., Jacoby, G. H., & Vassiliadis, E., 1992, ApJ, 389, 27
- (9) Feldmeier, J. J., 2006, in: Planetary Nebulae in Our Galaxy and Beyond, IAU Symp. 234, eds. M. J. Barlow & R. H. Méndez (preprint astro-ph/0606173)
- (10) Ferrario, L., Wickramasinghe, D., Liebert, J., & Williams, K. A., 2005, MNRAS, 361, 1131
- (11) Girardi, L., Chiosi, C., Bertelli, G., & Bressan, A., 1995, A&A, 298, 87
- (12) González-Delgado, R. M., Cerviño, M., Martins, L. P., Leitherer, C., & Hauschildt, P. H., 2005, MNRAS, 357, 945
- (13) Hamuy, M., Suntzeff, N. B., Heathcote, S. R., Walker, A. R., Gigoux, P., & Phillips, M. M., 1994, PASP, 106, 566
- (14) Humphreys, R. M., Nichols, M., & Massey, P., 1985, AJ, 90, 101
- (15) Jacoby, G. H., 1989, ApJ, 339, 39
- (16) Jacoby, G. H., Walker, A. R., & Ciardullo, R., 1990, ApJ, 365, 471
- (17) Jacoby, G. H., Morse, J. A., Kellar Fullton, L., Kwitter, K. B., & Henry, R. B. C., 1997, AJ, 114, 2611
- (18) Jordán, A., Côté, P., Blakeslee, J. P., Ferrarese, L., et al., 2005, ApJ, 634, 1002
- (19) Kenyon, S. J. 1986, “The Symbiotic Stars”, Cambridge University Press
- (20) Kohoutek, L., 2001, A&A, 378, 843
- (21) Kroupa, P., 2002, Science, 295, 82
- (22) Kwok, S., 2000, “The Origin and Evolution of Planetary Nebulae”, Cambridge Astrophysics Series Vol. 31, Cambridge University Press
- (23) Larsen, S. S. 1999, A&AS, 139, 393
- (24) Larsen, S. S., & Richtler, T., 2000, A&A, 354, 836
- (25) Larsen, S. S. 2004, A&A, 416, 537
- (26) Magrini, L., Corradi, R. L. M., Greimel, R., et al., 2003, A&A, 407, 51
- (27) Magrini, L., 2006, in: Planetary Nebulae in Our Galaxy and Beyond, IAU Symp. 234, eds. M. J. Barlow & R. H. Méndez (preprint astro-ph/0605222)
- (28) Marigo, P., Girardi, L., Groenewegen, M. A. T., & Weiss, A., 2001, A&A, 378, 958
- (29) Minniti, D., & Rejkuba, M., 2002, ApJ, L59
- (30) Morgan, D. H., 1992, MNRAS, 258, 639
- (31) Munari, U., & Renzini, A., 1992, ApJ, 397, 87
- (32) Mürset, U., Schild, H., & Vogel, M., 1996, A&A, 307, 516
- (33) O’Dell, C. R., 1963, PASP, 75, 370
- (34) Osterbrock, D. E., 1988, “Astrophysics of Gaseous Nebulae and Active Galactic Nuclei”, University Science Books, Sausalito, CA
- (35) Pedreros, M., 1987, AJ, 94, 92
- (36) Pedreros, M., 1989, AJ, 98, 2146
- (37) Peimbert, M., & Serrano, A., 1980, Rev. Mex. Astron. Astrof., 5, 9
- (38) Perinotto, M., & Corradi, R. L. M., 1998, A&A, 332, 721
- (39) Rawson, D. M., Macri, L. M., Mould, J. R., et al., 1997, ApJ, 490, 517
- (40) Rejkuba, M., Minniti, D., & Walsh, J. R., 2003, in: Extragalactic Globular Cluster Systems, ESO, Garching, p. 133, Ed. Markus Kissler-Patig
- (41) Renzini, A., & Voli, M., 1981, A&A, 94, 175
- (42) Renzini, A., & Buzzoni, A., 1986, in: Spectral Evolution of Galaxies, ed. C. Chiosi & A. Renzini (Dordrecht: Reidel), p. 195
- (43) Ryder, S. D., 1995, ApJ, 444, 610
- (44) Salasnich, B., Girardi, L., Weiss, A., & Chiosi, C., 2000, A&A, 361, 1023
- (45) Salpeter, E. E., 1955, ApJ, 121, 161
- (46) Schlegel, D. J., Finkbeiner, D. P., and Davis, M. 1998, ApJ, 500, 525
- (47) Schönberner, D., & Blöcker, T, 1996, Ap&SS, 245, 201
- (48) Stone, R. P. S., & Baldwin, J. A., 1983, MNRAS, 204, 347
- (49) Thim, F., Tammann, G. A., Saha, A., Dolphin, A., Sandage, A., Tolstoy, E., and Labhardt, L. 2003, ApJ, 590, 256
- (50) Torres, A. V., & Massey, P., 1987, ApJS, 65, 459
- (51) Vassiliadis, E., & Wood, P. R., 1994, ApJS, 92, 125
- (52) Weidemann, V., 2000, A&A, 363, 647
- (53) Whitmore, B. C., Zhang, Q., Leitherer, C., Fall, S. M., et al., 1999, AJ, 118, 1551