Extremely red objects in the UKIDSS Ultra Deep Survey Early Data Release
Abstract
We construct a sample of extremely red objects (EROs) within the UKIDSS Ultra Deep Survey by combining the Early Data Release with optical data from the Subaru/XMM-Newton Deep Field. We find a total of 3715 objects over 2013 arcmin2 with and , which is a higher surface density than found by previous studies. This is partly due to our ability to use a small aperture in which to measure colours, but is also the result of a genuine overdensity of objects compared to other fields. We separate our sample into passively-evolving and dusty star-forming galaxies using their RJK colours and investigate their radio properties using a deep radio map. The dusty population has a higher fraction of individually-detected radio sources and a higher mean radio flux density among the undetected objects, but the passive population has a higher fraction of bright radio sources, suggesting that AGNs are more prevalent among the passive ERO population.
keywords:
galaxies: evolution — galaxies: starbust — infrared: galaxies — surveys1 Introduction
Extremely Red Objects (EROs) are variously defined on the basis of an optical–near-infrared colour, usually or . These red colours can be due either to an evolved, passive stellar population at , or the presence of large quantities of dust associated with starburst activity (although edge-on discs may also contribute significantly; Yan & Thompson 2003). While the former population reveals the stellar mass already assembled in galaxies as a result of star formation at early cosmic times, the latter population reveals the star formation at which, due to its dust-enshrouded nature, may be missed by other surveys. Since these two populations represent very different routes to the creation of present-day galaxies, there is a clear desire to reliably separate them and use them as tests of galaxy formation models.
Existing samples of EROs (for which we adopt the most common definition of ) have been relatively small (typically no more than about 100 objects), due to the difficulty in obtaining near-infrared imaging data with the necessary depth and areal coverage (e.g., Daddi et al. 2000; Smail et al. 2002; Moustakas et al. 2004; Georgakakis et al. 2006). The arrival of infrared cameras with large fields of view, such as WFCAM (Casali et al., in preparation), has largely eliminated this problem, allowing samples of EROs to be constructed which are large enough to permit further separation by magnitude, colour, and other properties. Furthermore, by locating infrared surveys in well-observed patches of sky, it becomes possible to study the multi-wavelength properties of EROs and learn more about their nature.
In this Letter, we combine near-infrared data from the UKIDSS Ultra Deep Survey Early Data Release (Dye et al. 2006; Lawrence et al. 2006) with optical data from the Subaru/XMM-Newton Deep Field (SXDF; Furusawa et al., in preparation) to construct a sample of EROs to faint magnitudes () over an area larger than half a square degree. The Ultra Deep Survey will eventually cover 0.8 deg2 to 5 point source limits of , , and and has been sited in the SXDF because of the excellent deep multi-wavelength data in this region. We determine photometric redshifts for all objects and separate them into dusty star-forming and passively-evolving galaxies on the basis of their RJK colours. We use deep radio data to determine the typical radio flux densities and star formation rates as a function of colour and magnitude. A more detailed analysis, including clustering and X-ray properties, will be undertaken after the UKIDSS DR1 release, which is expected to be a magnitude deeper than the present data, and will provide more reliable photometry. All magnitudes in this paper are on the Vega system. The SXDF catalogue is calibrated on the AB system, and we use the conversion (H. Furusawa, private communication). We adopt a cosmology with and .
2 The ERO sample
We start with the improved version of the UDS EDR -band catalogue produced by Foucaud et al. (2006), and determine the completeness for galaxies as a function of -band magnitude. Galaxies with have a median and so we added objects of this size to the -band WFCAM images and measured the fraction that were recovered by the extraction process. The 50% completeness limit varies slightly between detectors, but averages to . We therefore eliminated all objects from the catalogue of Foucaud et al. (2006) with (total) magnitudes fainter than this limit before proceeding further. Our magnitude limit is brighter than that of Foucaud et al. since they calculate the completeness for unresolved sources. The optical data reach (, ).
2.1 Optical–infrared matching
In order to facilitate matching of the near-infrared catalogue with objects in the optical imaging, objects in various regions of sky were next removed from the catalogue. Only the central region of the UDS image, with uniform noise, was included in the matching process. Objects were eliminated whose UDS coordinates placed them outside the optical imaging region, or within 2 arcsec of the edge, to ensure that the photometric aperture of any optical match was entirely within the image. Finally, objects which lay within the halo or CCD bleed of a bright star were removed from the catalogue. The remaining effective area is 2013 arcmin2.
The UDS catalogue was first matched to the catalogues of Furusawa et al. (in preparation), with the closest match within 1 arcsec being used. However, visual inspection of the unmatched objects revealed that many pairs of objects remain blended in the optical catalogues, so the UDS catalogue was instead matched to the catalogues produced by Simpson et al. (2006) with a more severe deblending threshold. The -band catalogue was used first (as the -band data are the deepest), followed by the , , and -band catalogues. This reduced the number of unmatched objects by about half, to 426. These were all inspected by eye, and the vast majority (301) were discovered to be artifacts such as cross-talk, satellite trails, or array defects not removed in the reduction process (see Dye et al. 2006). These were deleted from the catalogue and not considered further. Most of the remaining 125 sources are still blended in the optical catalogue, although some lack any optical counterpart. Optical photometry was determined for these objects directly from the Suprime-Cam images using the UDS catalogue coordinates. A total of 443 objects have measured -band aperture magnitudes fainter than the limit of the optical data.
In what follows, colours are measured in a 2-arcsecond aperture, while magnitudes are total magnitudes from SExtractor’s MAG_AUTO parameter (Bertin & Arnouts 1996). The -band image has a narrower psf than the other images (FWHM=0.69 arcsec compared to 0.81 arcsec), and we address this point below.
2.2 Star–galaxy separation

We classify objects as stars or galaxies by the same method as Simpson & Rawlings (2002), using a combination of colour and Kron (1980) radius, . There is a clear bimodality in this plot (Fig. 1) because galaxies rapidly become redder than stars with increasing redshift, while those with similar colours to stars are nearby and hence clearly extended. While there was a clear separation between the two groups in the small sample of Simpson & Rawlings (2002), the much larger number of objects in the UDS EDR means that many are scattered into ‘no man’s land’, and we determine the locus of the minimum surface density of objects in Fig. 1 as our separation criterion. All objects with are classified as stars. However, the combination of depth and area in the UDS will result in the detection of a number of very late-type stars with extremely red colours, and these will not be excluded by this single criterion. We therefore also classify as stars any objects with and (morphological classification is not possible fainter than this).
Our galaxy sample will suffer contamination from L dwarf stars, which have (e.g., Hewett et al. 2006). Objects with and will be classified as galaxies, and these red colours are possessed by stars of spectral types L1–L8 (Table 9 of Knapp et al. 2004), whose surface density to is 0.038 deg-2 (Reid et al. 1999). If these are isotropically distributed on the sky (so the number expected is proportional to the Euclidian volume sampled), we expect objects with in our survey area. These are therefore a small contaminant.
2.3 Number counts
To construct our ERO sample, we first investigate the effect of the superior -band image quality by Gaussian-smoothing objects with to the same FWHM as the other images and measuring the flux loss in a 2-arcsec aperture. We find a median reduction in brightness of 0.04 mag, and apply this reduction to all -band magnitudes in the UDS EDR catalogue before constructing our ERO sample. In total we find 3715 (5128; 1464) objects with (; ).

In Fig. 2 we compare our galaxy and ERO number counts with determinations from the literature. Our total galaxy number counts agree very well, except at the brightest magnitudes where there is a slight deficit due to the fact that we have excluded regions with very extended galaxies from our analysis. Our ERO counts are, however, per cent higher than those of Daddi et al. (2000). This could be due in part to the different -band filters used in these studies, since Daddi et al.’s filter has a long red tail with its 10 per cent point at 8200 Å, while the Suprime-Cam filter has a sharper long-wavelength cutoff with a 10 per cent transmission point at 7200 Å. Consequently, objects with a pronounced (4000-Å) break between these two wavelengths will appear fainter in the Suprime-Cam images, and hence redder in . However, we note that we also find a much larger surface density of objects than did Smail et al. (2002), who used the same instrument/filter combination for their optical imaging. This may be partly due to the small aperture we use to determine colours, since contamination from nearby objects (which is obviously more likely for larger apertures) will almost certainly make the aperture colour bluer. We find that the number of EROs is decreased by 15–20 per cent (with a larger reduction for redder objects) if we use the colours measured in a 4-arcsecond aperture. Finally, we note that our surface density is similar to that of Miyazaki et al. (2003) who studied a small region within the SXDF, suggesting that this region is overdense at . For objects as clustered as EROs ( Mpc; Daddi et al. 2001), the effect of cosmic variance can be large, and we estimate using the prescription of Somerville et al. (2004). We stress that the depth of the -band data (the limit in a 2-arcsecond aperture is ; Furusawa et al., in preparation) means that photometric errors will not scatter a significant number of the more numerous bluer objects into the ERO class.
3 Nature of the ERO population
Although the ERO population is composed of both passively-evolving red galaxies and dusty starburst galaxies, there does not appear to be a bimodality in any photometric property which allows these two classes to be readily separated. Pozzetti & Mannucci (2000) used -band photometry to attempt to separate the classes as heavily-reddened objects will not show the pronounced 4000-Å break apparent in the spectra of old galaxies, and hence will have bluer and redder colours. Smail et al. (2002) used a more sophisticated method of spectral template fitting with the code HyperZ (Bolzonella, Miralles, & Pelló 2000) and classified objects according to whether the best-fitting model had a low or high extinction, finding that this produced broadly the same classification as the simpler method. Both methods rely on the accuracy of the photometry around Å, and our ability to classify EROs is therefore limited by the quality of the -band photometry. Since the dividing line between the two classes of object is at and the -band photometry limit is (, ), a classification is likely to be reliable only for the 1922 EROs with and we do not believe a sophisticated analysis is warranted by the present near-infrared data quality. We therefore opt to use Pozzetti & Mannucci’s (2000) simple RJK colour criterion to separate our sample into passive and dusty galaxies. We find that 62% of EROs are classified as passively-evolving, although this fraction increases when a redder colour cut is used, rising to 73% (77%) of objects with (). These fractions are broadly consistent with, although perhaps slightly larger than, those determined from previous studies.
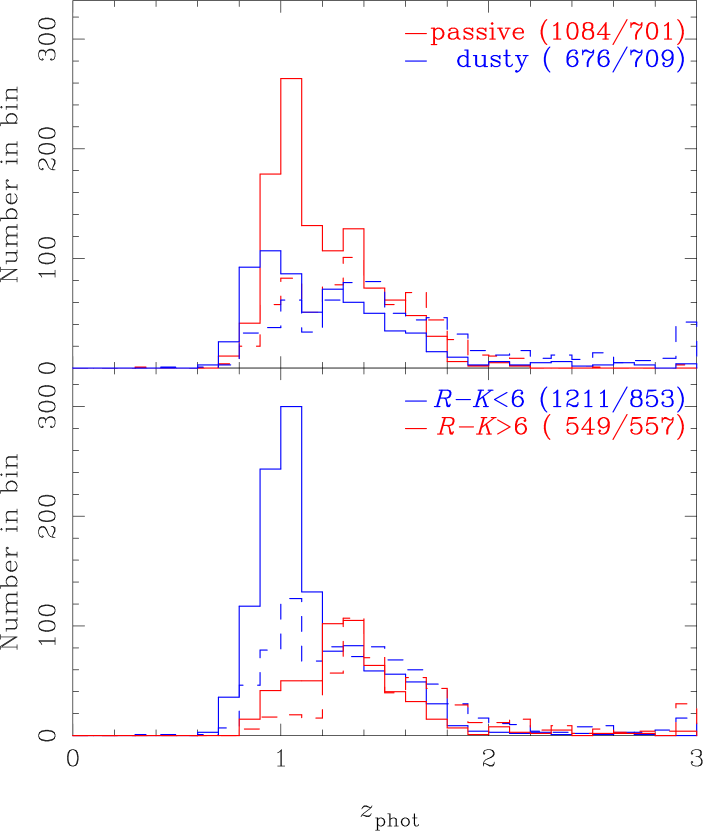
We have computed photometric redshifts for all members of our ERO sample, in order that we can derive physical quantities from observed fluxes, by fitting synthetic galaxy templates to the photometry, plus the two short-wavelength IRAC bands (from the SWIRE survey of Lonsdale et al. 2003) where available, using a modified version of the HyperZ code (see Cirasuolo et al., in preparation, for a detailed description). We show the results of this analysis by plotting the distribution for various subsamples in Fig. 3. Objects whose best template fits have (corresponding to an unacceptable fit at 99 per cent confidence) are not plotted.
Fig. 3 also reveals the predictable results that the reddest objects are typically at higher redshift, as are the faintest objects. The redshift distribution for passive galaxies also appears to be slightly narrower and more strongly peaked than that for dusty ones. This is due to the passage of the 4000-Å break through the filters, as galaxies will only be red in if the break is beyond the blue end of the filter, while the Pozzetti & Mannucci (2000) criterion breaks down at and classifies all EROs as dusty. We caution against a more detailed analysis of the different distributions given the significant difference between the photometric accuracy of the optical and near-infrared data, even for EROs. The deeper JK data from UKIDSS DR1 will provide better photometry, and hence a more reliable photometric analysis, for the present sample, as well as allowing a basic study of the fainter () ERO population.
4 Radio properties
| Colour | Magnitude | “Passive” EROs | “Dusty” EROs | ||||||||
| threshold | range | (Jy) | SFR (M) | (Jy) | SFR (M) | ||||||
| 1.05 | 220 | 54 | 0.96 | 109 | 55 | ||||||
| 1.20 | 819 | 104 | 1.25 | 463 | 98 | ||||||
| 1.37 | 832 | 78 | 1.46 | 800 | 83 | ||||||
| 1.24 | 64 | 12 | 1.18 | 14 | 8 | ||||||
| 1.36 | 351 | 55 | 1.32 | 131 | 29 | ||||||
| 1.44 | 414 | 34 | 1.60 | 321 | 31 | ||||||
| 1.35 | 19 | 2 | 1.53 | 6 | 1 | ||||||
| 1.47 | 131 | 25 | 1.68 | 40 | 7 | ||||||
| 1.64 | 177 | 16 | 1.81 | 124 | 10 | ||||||
| †Ellipse parameters fixed during fit due to high noise. | |||||||||||
Simpson et al. (2006) have presented a 1.4-GHz radio image of the SXDF taken with the NRAO Very Large Array which reaches an rms noise level of 12 Jy beam-1 in the central regions. At the median redshift of our sample, , a star formation rate (SFR) for stars of produces a flux density of 5 Jy (Condon 1992). Although this is obviously below the detection threshold for any individual source, we can make statistical detections of relatively modest SFRs in samples of objects since the beam will encompass all radio emission from the host galaxy. We note that starburst galaxies will be unresolved at the resolution of this radio image.
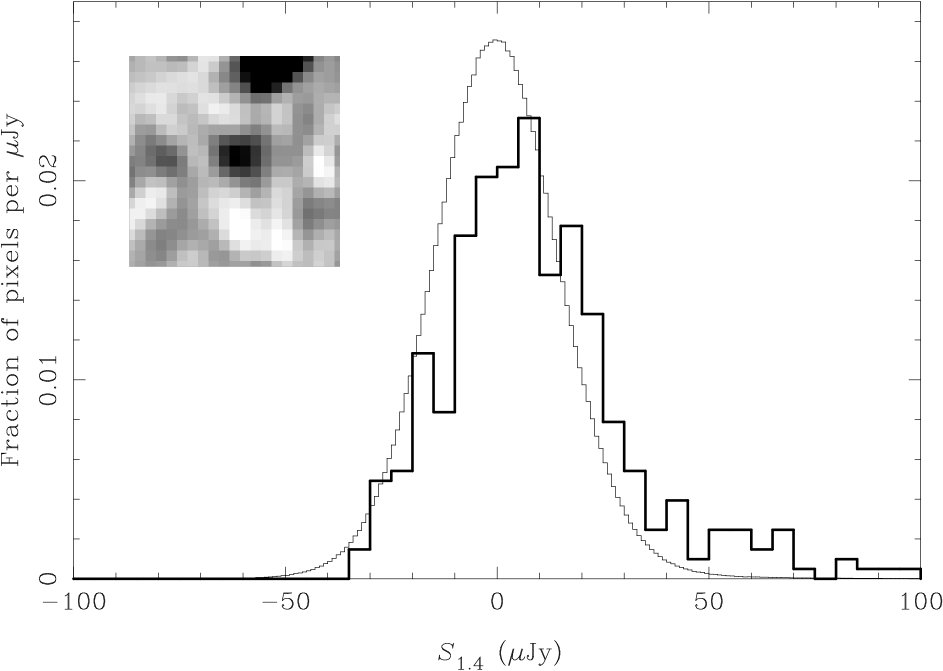
We study the mean radio properties of our sample in two ways. First, we produce small postage stamps from the radio map of Simpson et al. (2006) at our objects’ positions and sum these after weighting each by the inverse of the pixel noise variance at its position. We exclude all objects where any of the nine pixels (the scale is 1.25 arcsec pixel-1) in the radio image closest to the source position has a signal-to-noise ratio in excess of 3, so that the mean is not biased by a few objects associated with bright radio sources. We then fit an elliptical Gaussian profile to this stacked image using Ivan Busko’s n2gaussfit task in iraf, and calculating the flux density from the fit using the prescription of Condon (1997). For the second method, we construct a histogram of pixel values from the radio map at the positions of objects in our sample, and fit a Gaussian to the pixels after they have been iteratively sigma-clipped to exclude values more than two standard deviations from the mean, thus automatically removing bright outliers. We refer to these two methods as the stacking and histogram methods, respectively. Since the histogram method fits a Gaussian to the convolution of true source fluxes with the near-Gaussian pixel noise distribution, it is most reliable if the source flux density distribution is either itself Gaussian, or has a dispersion much less than that of the overall pixel noise. We prefer to use the image stacking method to derive mean radio flux densities, but confirm that the results from the histogram method are consistent in all cases.
To determine the likelihood of spurious detections in our image stacks, we ran Monte-Carlo tests by producing 1000 lists of between 100 and 1000 sources each located at random positions within the unmasked region of the SXDF/UDS images. The mean flux density at the positions in each list was then calculated by both the stacking and histogram methods. Since the stacked radio images are essentially signal-free, the Gaussian fitting technique was highly unstable and instead we measured the signal in a 5 pixel box in the centre of the image and corrected this for the 20 per cent flux loss expected for the beam size. Both methods produced a mean flux density of Jy, and we have therefore corrected our measured flux densities for this offset. The standard deviations on the mean for a sample of 100 sources were 0.9 and 2.1 Jy for the stacking and histogram methods, respectively, and reduced with sample size approximately as .
Table 1 shows the results of the stacking analysis for 18 ERO subsamples (separated by magnitude, colour, and classification), while Fig. 4 shows the stacking and histogram analyses for one subsample, indicating the reality of the statistical detection. From our analysis, galaxies classified as ‘dusty’ typically have twice the mean radio flux density of ‘passive’ galaxies, and the fraction of individually-detected objects is about twice as high (except in the faintest magnitude bin, where we have argued that the classification is unreliable). Smail et al. (2002) also find that most EROs with flux densities of a few tens of Jy are dusty. However, while a smaller fraction of passive galaxies are detected individually, those that are tend to be brighter: in the bin, 28 (13) of 104 individually-detected passive EROs have Jy (Jy), while only 10 (4) of 98 dusty EROs are as bright (for reference, the Fanaroff & Riley (1974) break is at mJy at ). This suggests that a few per cent of the passive ERO population may be active galaxies (cf. Alexander et al. 2002), although such objects can also be found in the dusty population (e.g., EDXS N2_21; Willott et al. 2003). Among the dusty population, we find that the SFR is uncorrelated with magnitude, but may be correlated with colour.
Our mean radio flux densities are consistent with those determined by Georgakakis et al. (2006), although our larger sample size produces much smaller uncertainties. We find that dusty galaxies typically have about twice the 1.4-GHz flux density of passive galaxies with the same colours and magnitudes, and hence have about twice the star formation rate since the median redshifts of identically-selected passive and dusty EROs are similar (in computing the median redshifts for our subsamples, we ignore cases where the best-fitting photometric redshift has ). However, the true difference in star formation rates is likely to be larger than this since the individually detected dusty objects are likely to be the high end of a broad distribution of star formation rates whereas the individually detected passive objects are likely to be AGNs. As a final point, we note that the sample of 5834 non-ERO galaxies with and has 440 objects detected at significance, while the remaining sources have a mean flux density of Jy, consistent with the value derived for the passive ERO population in this magnitude range.
5 Summary
We have described the construction of a sample of extremely red objects (EROs) within the Subaru/XMM-Newton Deep Field (SXDF) and UKIDSS Ultra Deep Survey (UDS) which is much larger than previous samples. We have measured a higher surface density than found in other fields, but comparable to that measured in a small sub-region of our field, suggesting the SXDF samples a cosmic overdensity at . After using RJK colours to separate the sample into passively-evolving (62% of EROs with ) and dusty star-forming galaxies, we have used a deep radio map to study the radio properties of these two populations. Both populations are detected at high significance in a stacked radio image, with the dusty sample having a mean flux density (and derived mean star formation rate) equal to approximately twice that of the passive sample. The mean radio flux density of the passive sample is consistent with that of non-ERO galaxies with the same magnitudes.
Acknowledgments
This paper is partially based on data collected at Subaru Telescope, which is operated by the National Astronomical Observatory of Japan. The United Kingdom Infrared Telescope is operated by the Joint Astronomy Centre on behalf of the U.K. Particle Physics and Astronomy Research Council (PPARC). The National Radio Astronomy Observatory is a facility of the National Science Foundation operated under cooperative agreement by Associated Universities, Inc. We thank the staff of these facilities for making these observations possible, and the anonymous referee for helpful suggestions. We gratefully acknowledge financial support from the PPARC (CS, MC, SF, SR) and the Royal Society (OA, IS).
References
- [1] Alexander D. M., Vignalli C., Bauer F. E., Brandt W. N., Hornschemeier A. E., Garmire G. P., Schneider D. P., 2002, AJ, 123, 1149
- [2] Bolzonella M., Miralles J.-M., Pelló R., 2000, A&A, 363, 476
- [3] Bertin E., & Arnouts S., 1996, A&AS, 117, 393
- [4] Condon J. J., 1992, ARA&A, 30, 575
- [5] Condon J. J., 1997, PASP, 109, 166
- [6] Daddi E., Cimatti A., Pozzetti L., Hoekstra H., Röttgering H. J. A., Renzini A., Zamorani G., Mannucci F., 2000, A&A, 361, 535
- [7] Daddi E., Broadhurst T., Zamorani G., Cimatti A., Röttgering H., Renzini A., 2001, A&A, 376, 825
- [8] Dye S., 2006, MNRAS, submitted (astro-ph/0603608)
- [9] Fanaroff B. L., Riley J. M., 1974, MNRAS, 167, 31p
- [10] Foucaud S., et al., 2006, MNRAS, submitted (astro-ph/0606386)
- [11] Gardner J. P., Cowie L. L., Wainscoat R. J., 1993, ApJ, 415, L9
- [12] Georgakakis A., Hopkins A. M., Afonso J., Sullivan M., Mobasher B., Cram L. E., 2006, MNRAS, 367, 331
- [13] Hewett P C., Warren S. J., Leggett S. K., Hodgkin S. T., 2006, MNRAS, 367, 454
- [14] Huang J.-S., et al. 2001, A&A 368, 787
- [15] Knapp G. R., et al., 2004, AJ, 127, 3553
- [16] Kron R. G., 1980, ApJS, 43, 305
- [17] Lawrence A., 2006, MNRAS, submitted (astro-ph/0604426)
- [18] Lonsdale C. J., et al., 2003, PASP, 115, 897
- [19] Miyazaki M., et al., 2003, PASJ, 55, 1079
- [20] Moustakas L. A., et al., 2004, ApJ, 600, L131
- [21] Pozzetti L., Mannucci F., 2000, MNRAS, 317, L17
- [22] Reid I. N., et al., 1999, ApJ, 521, 613
- [23] Simpson C., Rawlings S., 2002, MNRAS, 334, 511
- [24] Simpson C., et al., 2006, MNRAS, submitted
- [25] Smail I., Owen F. N., Morrison G. E., Keel W. C., Ivison R. J., Ledlow M. J., 2002, ApJ, 581, 844
- [26] Somerville R. S., Lee K., Ferguson H. C., Gardner J. P., Moustakas L. A., Giavalisco M., 2004, ApJ, 600, L171
- [27] Willott C. J., et al., 2003, MNRAS, 339, 397
- [28] Yan L., Thompson D., 2003, ApJ, 586, 765