AEGIS: Galaxy Spectral Energy Distributions from the X-Ray to Radio
Abstract
The All-wavelength Extended Groth Strip International Survey (AEGIS) team presents broad-band spectral energy distributions (SEDs), from X-ray to radio wavelengths, for 71 galaxies spanning the redshift range 0.55–1.16 (0.7). Galaxies with secure redshifts are selected from a small (22 arcmin2) sub-section of the Keck141414Data presented herein were obtained at the W. M. Keck Observatory, which is operated as a scientific partnership among the California Institute of Technology, the University of California, and NASA. The Observatory was made possible by the generous financial support of the W. M. Keck Foundation./DEIMOS galaxy redshift survey in the Extended Groth Strip field that has also been targeted for deep panchromatic imaging by Chandra151515NASA’s Chandra X-Ray Observatory was launched in July 1999. The Chandra Data Archive is part of the Chandra X-Ray Center which is operated for NASA by the Smithsonian Astrophysical Observatory. (X-ray: 0.5–10 keV), GALEX161616The Galaxy Evolution Explorer is a NASA Small Explorer, launched in April 2003. We gratefully acknowledge NASA’s support for construction, operation, and science analysis of the GALEX mission, developed in cooperation with the Centre National d’Etudes Spatiales of France and the Korean Ministry of Science and Technology. (ultraviolet: 120–250 nm), Canada-France-Hawaii Telescope171717Based on observations obtained with the Canada-France-Hawaii Telescope which is operated by the National Research Council of Canada, the Institut National des Science de l’Univers of the Centre National de la Recherche Scientifique of France, and the University of Hawaii. (optical: 360–900 nm), Hubble Space Telescope181818Based on observations with the NASA/ESA Hubble Space Telescope, obtained at the Space Telescope Science Institute, which is operated by the Association of Universities for Research in Astronomy, Inc., under NASA contract NAS 5-26555. (optical/near infrared: 440–1600 nm), Palomar Observatory191919Based on observations obtained at the Hale Telescope, Palomar Observatory, as part of a collaborative agreement between the California Institute of Technology, its divisions Caltech Optical Observatories and the Jet Propulsion Laboratory (operated for NASA), and Cornell University. (near infrared: 1200–2200 nm), Spitzer202020Based on observations made with the Spitzer Space Telescope, which is operated by the Jet Propulsion Laboratory, California Institute of Technology under a contract with NASA. Support for this work was provided by NASA through contract numbers 1256790, 960785, and 1255094 issued by JPL/Caltech. (mid/far infrared: 3.6–70 m), and the Very Large Array212121The Very Large Array of the National Radio Astronomy Observatory is a facility of the National Science Foundation operated under cooperative agreement by Associated Universities, Inc. (radio: 6–20 cm). The absolute magnitude of the typical galaxy in our sample is =19.82. The ultraviolet to mid-infrared portion of their spectral energy distributions (SEDs) are found to be bracketed by two stellar-only model SEDs: (1) an early burst followed by passive evolution and (2) a constant star-formation rate since early times; this suggests that few of these galaxies are undergoing major starbursts. Approximately half the galaxies show a mid- to far-infrared excess relative to the model SEDs, consistent with thermal emission from interstellar dust. Two objects have power-law SEDs, indicating that they are dominated by active galactic nuclei; both are detected in X-rays. The galaxies are grouped by rest-frame color, quantitative optical morphology, and [O ii] emission line strength (possible indicator of star formation). On average, the panchromatic SEDs of the galaxies, from the ultraviolet to the infrared, follow expected trends: redder SEDs are associated with red , early-type morphology, and low [O ii] emission, and vice versa for blue SEDs.222222These data are available at http://aegis.ucolick.org/products .
Subject headings:
galaxies: evolution — galaxies: general — X-rays: galaxies — ultraviolet: galaxies — infrared: galaxies — radio continuum: galaxies1. Introduction
The spectral energy distribution (SED) of a galaxy contains key clues about the dominant physical processes responsible for energy generation. Space- and ground-based telescopes of the new millennium provide the sensitivity and angular resolution to make measurements across the breadth of the electromagnetic spectrum from X-ray to radio wavelengths. Panchromatic SEDs can tell us about the stellar populations within the galaxy from their visible light [and ultraviolet (UV) and near-infrared (IR)] properties (e.g., Bruzual & Charlot, 2003, and references therein—hereafter BC03), thermal re-radiation of starlight in the far IR by interstellar dust (Dale et al., 2001), and X-ray (e.g., Mushotzky et al., 1980) and radio emission from active galactic nuclei (AGNs).
Dale et al. (2001) have studied panchromatic SEDs of nearby galaxies and have developed a semi-empirical model for the IR SED of normal star-forming galaxies. Distant galaxy SEDs are important for look-back studies of galaxy formation and evolution. The first such survey was GOODS (Giavalisco et al., 2004). Our project, the All-wavelength Extended Groth Strip International Survey (AEGIS; Davis et al., 2006, hereafter Paper I), extends the work of GOODS over a larger survey area [in a part of the sky known as the Extended Groth Strip (EGS)] thereby driving down cosmic variance. The cornerstone of AEGIS is the Keck/DEIMOS DEEP2 galaxy redshift survey (Davis et al., 2003). Precise redshift measurements from this survey allow us to determine the environment of each galaxy (Cooper et al., 2005), a key factor in determining galaxy evolution. Moreover, these DEIMOS spectra allow us to measure linewidths and estimate dynamical masses for the galaxies.
This paper presents SEDs of 71 optically-selected galaxies in AEGIS and is intended to showcase the panchromatic data set. Given the relatively coarse angular resolution of even the state-of-the-art UV and mid-/far-IR images in our survey, we limit our study to the global emission from these distant galaxies. The goal of this paper is to provide clean SEDs for a handful of objects. Throughout this letter we use a cosmology of (, , )=(70, 0.3, 0.7). Magnitudes are in the AB system.
2. The AEGIS Survey & MTR Subsample
The AEGIS spectroscopic field is a 0.5 deg2 field at =14h17m, =+52∘30′. It is only one of a few regions in the sky with deep imaging coverage in all major observable wavebands and spectroscopy with a 10-m class telescope (DEEP2 Keck/DEIMOS redshift survey). Deep imaging exists in Chandra/ACIS (X-ray), Galaxy Evolution Explorer (UV), Hubble Space Telescope (HST/ACS and NICMOS (optical and near-IR), Canada-France-Hawaii Telescope (CFHT)/MegaCam and CFH12K (multiband optical), Palomar (near-IR), Spitzer (mid- and far-IR), and Very Large Array (6 and 20 cm radio). Availability of secure spectroscopic redshifts is the primary sample selection criterion. The DEEP2 survey targets galaxies with 24.1 and covers the redshift range 1.4 in the EGS. Detailed selection criteria and effective wavelengths, exposure times, limiting magnitudes, source surface densities, etc. for the AEGIS data sets are presented in Paper I.
A subfield of the EGS with complete coverage in all wavebands, known as the Mini Test Region (MTR), is used in this letter. The MTR consists of two side-by-side ACS pointings (22 arcmin2) centered at =14h17m52.0s, =+52∘29′3.0′′ (see Fig. 1 of Paper I). Postage stamp images around each galaxy were visually inspected for source blending (chance superpositions or physical pairs), cosmetic problems (CCD edge, cosmic ray, etc.), and missing entries in the photometric catalogs for obvious sources. Of the 101 objects with secure redshifts in the MTR, 30 were dropped, yielding 71 objects with clean measurements. Ten of the dropped objects are confused/blended, 10 are affected by cosmetic problems, and 10 are missing catalog entries [9 of the 10 are missing flux entries in all four IRAC bands because the available IRAC photometry catalog is restricted to sources detected in band 4 (8 m)].
The exclusion of the 10 blended/confused objects, some of which may be physically interacting, does not appear to have introduced a significant bias into our sample. Three of the 10 cases are spectroscopically confirmed to be chance superpositions. No redshift information is available for the neighbor in the remaining 7 cases, but their distribution of colors and morphologies is identical to that of the full sample.
Our data come from a wide range of instruments, each with its own complexities. We have therefore relied on the expertise of each team to obtain photometry. The total magnitudes are derived from aperture photometry using apertures of diameter 2–3 times the FWHM of the PSF. The rest-frame absolute magnitude and color are derived from the optical photometry using the K-correction procedure described in Willmer et al. (2006). Future papers will use more sophisticated photometry techniques involving matched optimized apertures and PSF fitting/subtraction of neighbors.
3. Detection Limits in the Context of Galaxy Models
In this section, we examine the AEGIS detection limits in the context of typical galaxy SEDs. BC03 stellar population synthesis models provide a simple conceptual framework. These containing only stellar emission; a complete treatment of dust extinction or emission from dust, gas, and AGN, is beyond the scope of this work. For simplicity, we consider two models.
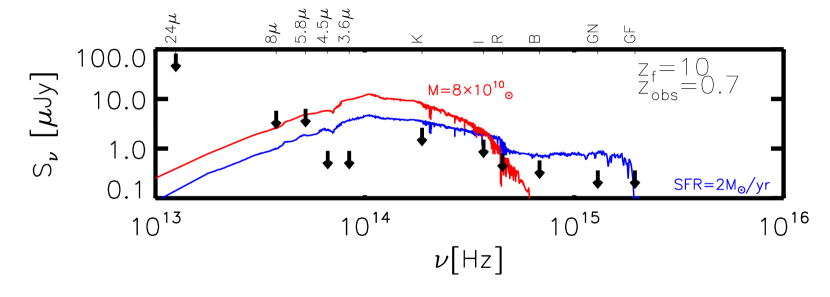
The first is a passive evolution model in which the stars form early, at a redshift =10, over a very short period, 10 Myr. The stellar mass in the model is tuned such that its -band luminosity is at our detection limit at =0.7. A galaxy with stellar mass of =81010 is bright enough to be detected in the AEGIS optical / and Spitzer mid-IR bands.
Second, we consider a model in which the star-formation rate is constant from a redshift of =10 until it is ‘observed’ at =0.7. As before, the star-formation rate is tuned so that the -band luminosity is at our detection threshold at =0.7. The redshift range =10 to =0.7 corresponds to 6.7 Gyr.
Figure 1 shows the SEDs of both models (red: early burst; blue: constant star-formation rate), compared to the detection limits of our survey (downward arrows: typically limits, see Paper I). Note, the 24 m Spitzer/MIPS band’s detection limit is well above the model stellar SEDs.
4. Spectral Energy Distributions
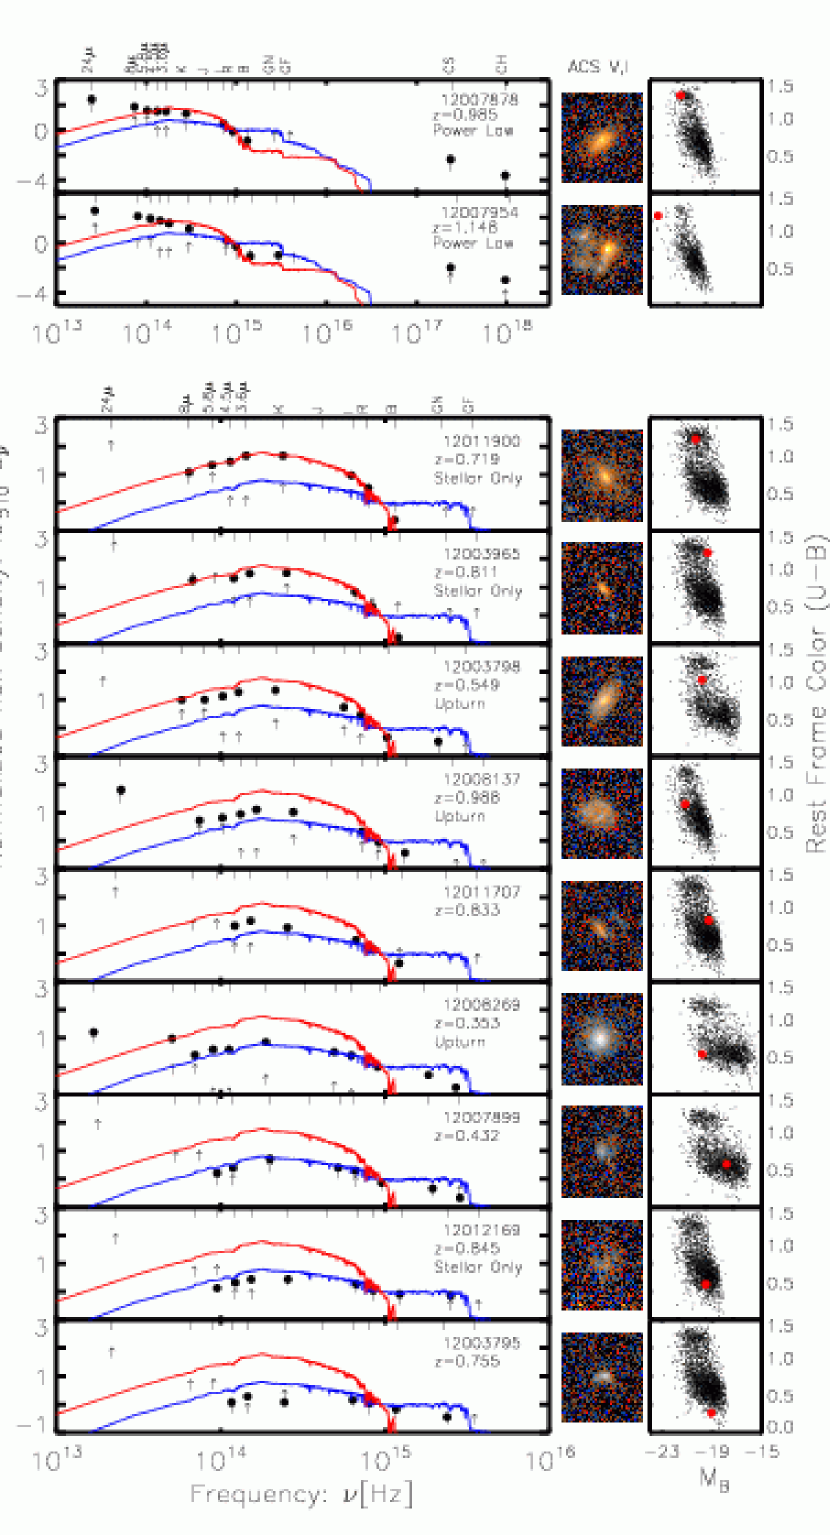
Rest-frame SEDs for 11 galaxies are shown in Figure 2 (left panels). This subsample spans a representative range of optical colors and luminosities. The only two Chandra sources in our sample, most likely AGNs, are shown at the top of the figure. The flux density is normalized to the -band and detection limits are shown with upward arrows. The effective rest-frame frequency, of each data set is shown by a tick mark at the top of each SED panel. The two BC03 model SEDs described in § 3 are overlaid, also normalized to the rest-frame band: constant star-formation rate model (blue line) and early burst model (red line). These models do not include any dust absorption/emission. The DEEP2 object ID, redshift, and SED type (§ 4.2) are listed in the top right corner of each left panel. The middle panels show “true”-color images formed by combining the HST/ACS images in the + bands using the algorithm of Lupton et al. (2003). The right panels show the location of the galaxy in a plot of rest-frame absolute -band magnitude versus rest-frame color (red dot) relative to other AEGIS galaxies in a redshift slice around the target, 0.1.
Table 1 lists the SEDs of the 11 galaxies that are shown in Figure 2. The radio upper limits are listed in Paper I.
4.1. Notes on Individual Objects
In this section, we describe the morphology, spectral features, and field crowding of each of the 11 selected objects. No individual galaxy in this subsample of 11 is a VLA 6 or 20 cm detection. Emission lines are listed when clearly visible by eye in order to convey a sense of the features used for redshift determination. For an emission line to be visible in a typical galaxy within our sample, its equivalent width must be 4 Å.
12007878 is an AGN with a red core with an asymmetric underlying disk. It
shows [O ii] emission. The Chandra irradiances for this
object in the hard/soft bands are:
1.70.210-14/3.00.310-15erg s-1 cm-2.
12007954 is an AGN, with [O ii] emission and a bright nuclear source at the center of the HST/ACS postage stamp. This object is discussed in detail by Le Floc’h (2006). The Chandra irradiances in the hard/soft bands are: 3.80.210-14/1.30.110-14erg s-1 cm-2.
12011900 is a red early-type galaxy. The bright IRAC source to the northeast may be a low-level contaminant.
12003965 is a faint red irregulr object, with dust lanes. A faint optical companion may contaminate the IRAC fluxes. [O ii] is present.
12003798 is a spiral galaxy in the ‘valley’ between red and blue galaxies. This galaxy has an [O iii] doublet, [Ne iii], and Balmer emission.
12008137 is a spiral galaxy with dust lanes. [O ii] emission is seen.
12011707 is a dusty irregular galaxy. Its spectrum shows [O ii] and Balmer emission.
12008269 has a very bright core and many distinct parts. The object has strong Balmer, [O,iii], and [Ne,ii].
12007899 is a blue irregular object. The spectrum shows strong [O iii] and a Balmer emission sequence.
12012169 is a spiral galaxy, with no visible spheroidal component. The [O iii], Balmer, and [O ii] lines are strong with a hint of weak [Ne iii].
12003795 is a very blue irregular object. It shows a sequence of strong emission lines: [O ii], [O iii], Balmer lines, and the high ionization potential lines [Ne iii] and [He i].
4.2. SED Types
We attempt to classify each of the 71 non-blended SEDs into one of three types. The first type, ‘stellar’, follow the BC03 SEDs; examples of this class are objects 12011900, 12012169, and 12003965 in Figure 2. The second type, ‘IR-excess’, dislays a mid- to far-IR excess relative to a pure stellar SED (IRAC 8 m upturn and/or MIPS 24 m detection); examples include objects 12003798, 12008137, and 12008269. The third type, ‘power-law’, is characterized by an SED of the form: ; the only two such objects in our sample are 12007878 and 12007954. Note, the AEGIS MIPS 24 m detection limit is relatively bright (Fig. 1) so that some of the SEDs classified as ‘stellar’ may well have upturns in the far-IR that fall below our detection threshold. Finally, galaxies that do not have detections in IRAC bands 3 or 4 are difficult to classify; these include objects 12001707, 12007899, and 12003795. All in all, the SED types include 22 stellar, 31 IR-excess, 2 power-law, and 16 objects that are missing IRAC fluxes.
5. Trends with Optical Properties
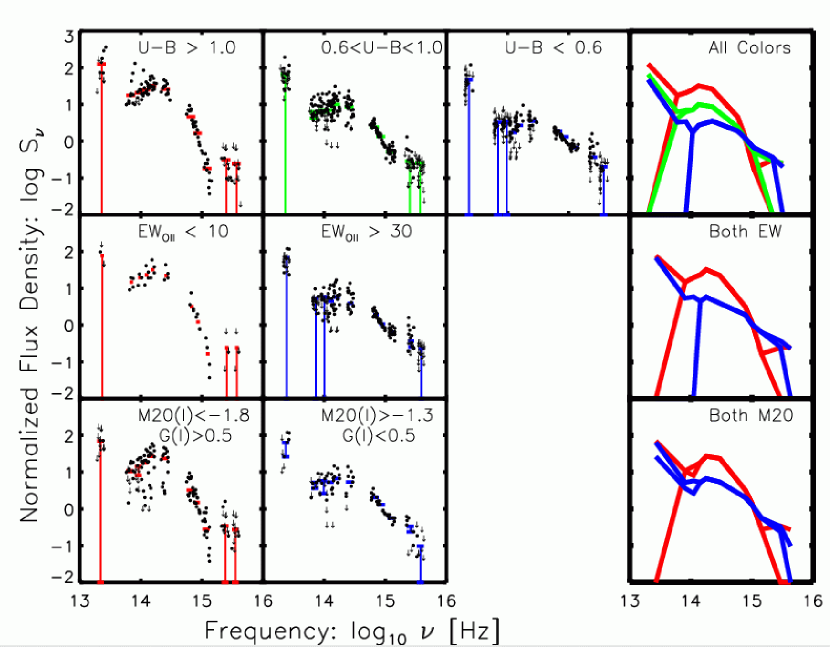
To give the reader an idea of the richness of the AEGIS data, each galaxy is grouped according the following parameters: color, [O ii] equivalent width, and Gini/M20 in the observer-frame -band (Lotz, Primack, & Madau, 2004). The Gini coefficient and M20 combined is a quantitative measurement of the galaxy’s morphology. These groupings are chosen for their broad-stroke ability to create similar groups of objects, even though the parameters are not independent. That is, red galaxies generally have low [O ii] emission and early-type morphologies (Bell et al., 2004; Weiner et al., 2005) while blue galaxies generally have strong [O ii] emission and later-type morphology (Kennicutt, 1998).
Figure 3 overplots all 71 SEDs (small black dots in the set of seven panels on the left) grouped by , [O ii] line strength, and Gini/M20. The grouping criteria are indicated in the top right of each panel. Colored dots (vertical bars) show the median normalized flux value (range) for each band.
The set of three panels on the right show the median SEDs of each group as bold colored lines (where the branching indicates the ‘median range’ as discussed below). If all galaxies were detected in all bands, the median SED would be straightforward to compute. In reality, not every galaxy is detected in all bands, so we introduce the ‘median range’ to take advantage of our detection limits. To bracket the full range of possibilities, the upper end of the range is computed by assuming that all the galaxies with upper limits have fluxes that are exactly at the detection limit, while the lower end of the range is computed by assuming that they have zero flux. If all galaxies are undetected in a given band, then the median range is the pair (median of the normalized detection limits, 0).
6. Results
The near-IR to UV portions of the SEDs of the galaxies in our sample, typically luminous galaxies at 1, are generally bracketed by the early burst and constant star-formation rate model stellar SEDs (Fig. 2). This indicates that few, if any, of the luminous galaxies at these epochs are undergoing significant starbursts. This portion of the SED appears to be closely correlated, at least in an average sense, with the rest-frame UV and optical properties such as color, [O ii] emission line strength, and morphology. These same UV/optical properties do not appear to be good predictors of whether the overall SED follows a pure stellar population model (‘stellar’), shows a mid- to far-IR excess relative to a pure stellar population model (‘IR-excess’), or follows a power law (‘power-law’). About 60% of the galaxies have detectable mid- to far-IR emission; this is likely thermal emission from interstellar dust. A few percent of the SEDs are of the form: , likely because they are dominated by AGNs.
References
- Bell et al. (2004) Bell, E. F., et al., 2004, ApJ, 600, L11
- Bruzual & Charlot (2003) Bruzual, G., & Charlot, S. 2003, MNRAS, 344, 1000
- Cooper et al. (2005) Cooper, M., Newman, J., Madgwick, D. S., Gerke, B. F., Yan, R., & Davis, M., 2005, ApJ, 634, 833
- Dale et al. (2001) Dale, D. A., Helou, G., Contursi, A., Silbermann, N. A., & Kolhatkar, S. 2001, ApJ, 549, 215
- Davis et al. (2003) Davis, M., et al. 2003, Proc. SPIE, 4834, 161
- Davis et al. (2006) Davis, M., et al. 2006, ApJL, submitted (this issue; astro-ph/0607355)
- Giavalisco et al. (2004) Giavalisco, M., et al. 2004, ApJ, 600, L93
- Kennicutt (1998) Kennicutt, R. C. 1998, ARA&A, 36, 189
- Le Floc’h (2006) Le Floc’h, E., et al. 2006, ApJL, submitted (this issue)
- Lotz et al. (2004) Lotz, J., Primack, J., & Madau, P. 2004, AJ, 128, 163
- Lupton et al. (2003) Lupton, R., Blanton, M., Fekete, G., Hogg, D. W., O’Mullane, W., Szalay, A., & Wherry, N. 2003, arXiv preprint (astro-ph/0312483)
- Mushotzky et al. (1980) Mushotzky, R. F., Marshall, F. E., Boldt, E. A., Holt, S. S., & Serlemitsos, P. J. 1980, ApJ, 235, 377
- Weiner et al. (2005) Weiner, B. J., et al. 2005, ApJ, 620, 595
- Willmer et al. (2006) Willmer, C. N. A., et al. 2006, ApJ, in press (astro-ph/0506041)
| Object | zaaTypical uncertainty in redshift is 3.410-5. | GNbbAll flux densities are in log(Jy). Note: 1 Jy=10-29 erg s-1 Hz-1 cm-2 and AB magnitudes are defined as 2.5log()48.6 where is in erg s-1 Hz-1 cm-2. An upper limit is denoted by a . | GF | B | R | I | K | IRAC1 | IRAC2 | IRAC3 | IRAC4 | MIPS24 | |
|---|---|---|---|---|---|---|---|---|---|---|---|---|---|
| 12007878 | 0.985 | ||||||||||||
| 12007954 | 1.148 | ||||||||||||
| 12011900 | 0.719 | ||||||||||||
| 12003965 | 0.811 | ||||||||||||
| 12003798 | 0.549 | ||||||||||||
| 12008137 | 0.988 | ||||||||||||
| 12011707 | 0.833 | ||||||||||||
| 12008269 | 0.353 | ||||||||||||
| 12007899 | 0.432 | ||||||||||||
| 12012169 | 0.845 | ||||||||||||
| 12003795 | 0.755 |