Hiding Cusps in Cores: Kinematics of Disk Galaxies in Triaxial Dark Matter Halos
Abstract
We study the kinematics of gaseous disks in triaxial dark matter halos using the closed-loop orbit solutions in non-axisymmetric potentials. The orbits are in general non-circular and, for given triaxiality, their ellipticity depends on the ratio of escape to circular velocities, . This ratio increases steeply towards the center for cold dark matter (CDM) halo density profiles, implying that even minor deviations from spherical symmetry may induce large deviations from circular orbits in the velocity field of a gaseous disk, especially near the center. This result suggests that caution should be exercised when interpreting constraints on the presence of density cusps in the dark halo derived from the innermost velocity profile. Simulated long-slit rotation curves vary greatly in shape, depending primarily on the viewing angle of the disk and on its orientation relative to the principal axes of the potential. “Solid-body” rotation curves—typically interpreted as a signature of a constant density core in the dark matter distribution—are often obtained when the slit samples velocities near the major axis of the closed loop orbits. Triaxial potentials imprint specific symmetries in 2D velocity fields, generally inducing “twists” in the isovelocity contours and anti-symmetric patterns in opposite quadrants. We suggest that triaxial halos may be responsible for the variety of shapes of long-slit rotation curves of low surface brightness (LSB) galaxies, as well as for the complex central kinematics of LSBs, which are sometimes ascribed to the presence of “radial motions” in the gas. We argue that LSB rotation curves might be reconciled with the structure of CDM halos once the effects of halo triaxiality on the dynamics of gaseous disks are properly taken into account.
keywords:
cosmology: dark matter – galaxies: formation – galaxies: kinematics and dynamics1 Introduction
It is commonly believed that the inner regions of low surface brightness (LSB) galaxies are ideal probes of the inner structure of dark matter halos. Although estimates of the stellar mass-to-light ratio remain somewhat uncertain, the baryonic component contribution to the mass budget in these galaxies is generally thought to be small. Under this assumption, dynamical tracers of the potential such as rotation curves are expected to cleanly trace the dark matter distribution in LSBs. This provides important astrophysical clues to the nature of dark matter, since the spatial distribution of dark material in these highly non-linear regions is expected to be quite sensitive to the physical properties of the dark matter.
LSB rotation curves may thus be contrasted directly with theoretical predictions of the inner structure of halos, and there is now an extensive body of work in the literature that reports substantial disagreement between the shape of LSB rotation curves and the circular velocity curves of simulated cold dark matter (CDM) halos (see, e.g., Flores and Primack, 1994; Moore, 1994; McGaugh and de Blok, 1998; de Blok et al., 2001). Some of these rotation curves are fit better by circular velocity curves arising from density profiles with a constant density “core” rather than by the “cuspy” density profiles commonly used to fit the structure of CDM halos (Navarro et al., 1996, 1997, hereafter NFW). This discrepancy adds to a growing list of concerns regarding the consistency of CDM with observational constraints on the scale of individual galaxies (see, e.g., Sellwood and Kosowsky, 2001) that has prompted calls for a radical revision of the CDM paradigm on small scales (see, e.g., Spergel and Steinhardt, 2000).
Before accepting the need for radical modifications to CDM it is important to note a number of caveats that apply to the LSB rotation curve problem. For instance, many of the early rotation curves where the disagreement was noted were significantly affected by beam smearing in the HI data (Swaters et al., 2000). The observational situation has now improved substantially thanks to higher-resolution rotation curves obtained from long-slit and two-dimensional H observations (see, e.g., de Blok and Bosma, 2002; Swaters et al., 2003; Simon et al., 2003, 2005). We shall restrict our analysis to these newer datasets in what follows.
We also note that, strictly speaking, the observational disagreement is with the fitting formulae used to parameterize the structure of simulated CDM halos (usually the profile proposed by NFW), rather than with the structure of simulated halos themselves. Although the fitting formulae provide a simple and reasonably accurate description of the mass profile of CDM halos, the radial range over which they have been validated often does not coincide with the scales where the disagreement has been identified. This is important, since small but significant deviations between the NFW profile and simulated halos have been reported as the mass and spatial resolution of the simulations has increased (Moore et al., 1998; Ghigna et al., 2000; Fukushige and Makino, 1997, 2001). In particular, the central slope of the density profile has been the subject of much debate.
The NFW density profile is given by , where is a scale radius. This profile approaches a power-law “cusp” near the center. Moore et al. (1998) and Ghigna et al. (2000) argued that halos simulated with higher resolution have steeper central density profiles, . However, Hayashi et al. (2004) and Navarro et al. (2004) show that the density profile of halos becomes shallower towards the center and in fact may not actually converge to a well-defined asymptotic inner power law. At present, the simulation results of all groups are in good agreement, and the logarithmic slope of the density profile is or shallower at the innermost resolved radius (Diemand et al., 2004). Although there is no broad consensus yet regarding how deviations in simulated halo profiles from fitting formulae like NFW may affect the comparison with observed rotation curves (see, e.g., Hayashi et al., 2004), the fact that the deviations worsen towards the centre, in addition to the observed scatter in halo profiles, advise against using extrapolations of simple fitting formulae such as the NFW profile to assess consistency with observation.
Finally, it must be emphasized that the “cusp vs. core” problem arises when comparing rotation speeds of gas in LSB disks to spherically-averaged circular velocities of dark matter halos. Given that CDM halos are expected to be significantly non-spherical, some differences between the two are to be expected. Previous studies have shown that simulated halos are triaxial objects with shapes ranging from oblate to prolate (Davis et al., 1985; Barnes and Efstathiou, 1987; Frenk et al., 1988; Warren et al., 1992; Jing et al., 1995; Thomas et al., 1998; Jing and Suto, 2002). The angular momentum of the halo tends to be aligned with the minor axis, therefore one expects galactic disks to lie in a plane close to the plane defined by the intermediate and major axes of the halo. It is therefore important to take into account deviations from spherical symmetry in the structure of CDM halos in order to make predictions regarding the rotation curves of gaseous disks that may be compared directly to observation. In fact, asymmetries in the velocity fields of gas disks have been observed (Courteau et al., 2003, e.g.,), although in normal galaxies they are usually attributed to non-circular motion induced by bars or spiral arms.
We address this issue here by exploring the closed loop orbits within simple non-axisymmetric potentials whose mass profiles are consistent with cold dark matter halos. We follow the formalism developed by Gerhard and Vietri (1986) and Binney and Tremaine (1987) in the context of triaxial bulges and bar potentials, and by Franx et al. (1994) and Schoenmakers et al. (1997) to probe non-axisymmetry in spiral galaxies. We focus our analysis on the shape and inner slope of the rotation curves inferred for disks in triaxial halos by simulating long-slit observations of their velocity fields. We find that velocities along the slit may deviate significantly from the circular velocity, a result that may account for the variety of LSB rotation curve shapes and that may reconcile the “cores” inferred for some LSBs with the cuspy mass profile of CDM halos.
2 LSB rotation curves
Figure 1 illustrates the “cusp vs core” disagreement alluded to above. This figure shows the H rotation curves of two LSB galaxies (points with error bars) selected from the sample of de Blok and Bosma (2002, B02) and Swaters et al. (2003, S03). Also shown are the spherically-averaged profiles of all galaxy-sized cold dark matter halos presented in Hayashi et al. (2004) and Navarro et al. (2004). In order to emphasize discrepancies in shape, the rotation curves in Figure 1 have been scaled to the radius, , and velocity, , where the logarithmic slope of the curve is . The choice of this scaling is motivated by the asymptotic slope of the NFW profile, . In this case, the scaling radius is in the region well resolved by numerical simulation; it is also easily identified in observed rotation curves, as it lies halfway between the linear () “core” region and the outer, flat () rotation curve portion seen in most disk galaxy rotation curves.
The dashed line (which runs through the simulation data) shows the profile of an NFW halo, which is fixed and independent of concentration in these scaled units. We find that the shapes of the dark halo curves are in fact quite similar to NFW, although they span a large range of halo masses and have been chosen without regard to the dynamical state of the halo.
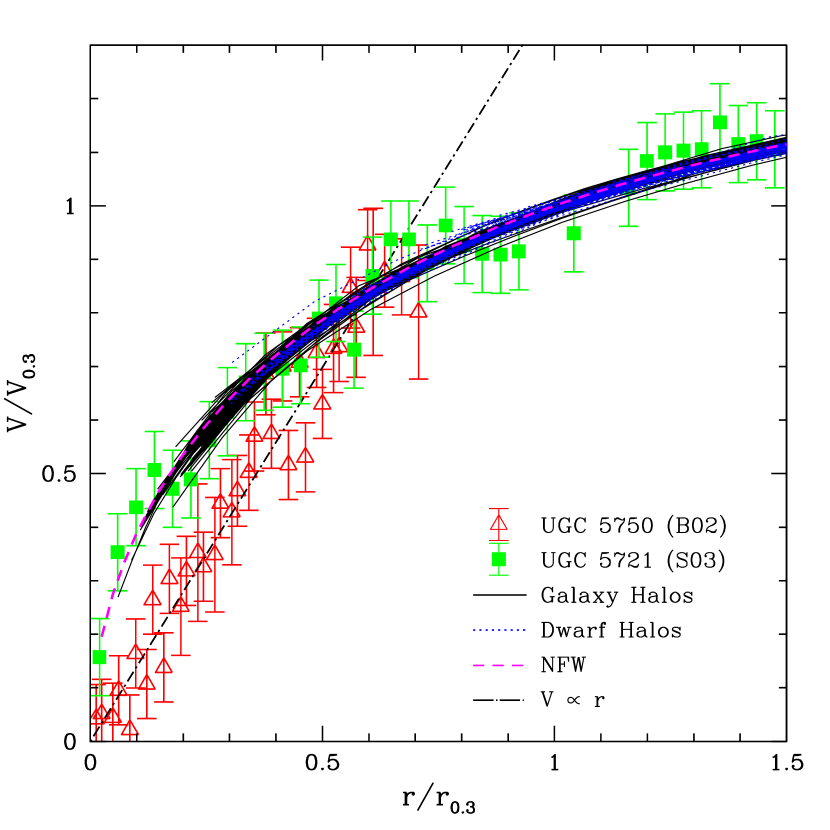
LSB rotation curves, on the other hand, exhibit a wide range of shapes, and the two galaxies shown in Figure 1 have been chosen to illustrate some of the extreme cases in the B02 and S03 datasets. These have been scaled to and as determined by fits with the rotation curve fitting formula of Courteau (1997) (see Hayashi et al., 2004, for details). Galaxies like UGC 5721 are roughly consistent with NFW and feature a gentle turnover between the rising and flat parts of their velocity curves. Others are better approximated by a linear scaling of velocity with radius, as expected in the presence of a constant density core. One such example, UGC 5750, is shown in Figure 1, and is well-matched by the dot-dashed line.
3 Closed Loop Orbits
Does this result imply that a cusp in the dark matter density profile cannot be present in galaxies such as UGC 5750? As noted in § 1, before concluding so one must take into account possible systematic differences between rotation speed and circular velocity in gaseous disks embedded within realistic, triaxial halos. This is a complex issue that involves a number of parameters, such as the degree of triaxiality, the role of the disk’s self-gravity, size, and orientation, as well as the possibility of transient deviations from equilibrium.
We explore a simplified scenario here, where the orientation of the principal axes of the potential is constant with radius and a massless, filled gaseous disk is placed on one of the symmetry planes of the halo. The velocity field of the disk may then be examined by solving for the closed loop orbits within a two-dimensional non-axisymmetric potential. This is analogous to orbits within a barred potential where the pattern speed of the bar is set to zero, and has been studied by a number of authors using the epicycle approximation for the case of weak bars. Following the formalism presented in Schoenmakers et al. (1997), we may write the potential as,
| (1) |
where is the unperturbed potential, is a stationary perturbation to that potential, is the azimuthal angle, and is the radially-dependent phase of the perturbation. For the simple case we consider here, we set and require the phase of the (stationary) perturbation to be constant with radius, . We then choose the origin so that along the major (minor) axis of the perturbed potential for positive (negative) .
The closed-loop orbit solutions can be calculated analytically using the epicyclic approximation and are given in parametric form by
| (2) | |||||
| (3) | |||||
| (4) | |||||
| (5) |
where is the guiding centre of the closed loop orbit; ; and the (unperturbed) angular and circular velocities are given by and by .
3.1 Case I: A Uniform Perturbation
In general, the terms and 111 and are zero for stationary perturbations are functions of , and their first and second derivatives with respect to . However, we begin by examining the simpler case of a uniform perturbation, i.e., , where is a constant. In this case, these terms in the closed-loop orbit solutions simplify to:
| (6) | |||||
| (7) | |||||
| (8) |
where the escape velocity is ; ; and all terms in eqs. 6-8 are evaluated at . We note that this perturbation tends to a finite value as and therefore can result in unphysical solutions to Poisson’s equation for the density distribution at small radii. However, we explore this simplified case in order to illustrate the general character of the closed orbit solutions. A more realistic perturbation in which tends to zero as is presented later in this section.
For a power-law potential, , the function is independent of radius, . Near the center of an NFW profile , and the ellipticity of the orbits scales simply as . Note that the shape of the orbit at some radius depends on the mass profile both inside (through ) and outside (through ) the orbit, since the gravitational forces of the outlying material do not cancel out in a non-spherical potential. Quantitatively, the deviation from circularity depends on the competition between the monopole of the unperturbed potential and the quadrupole of the perturbation. The larger the central mass concentration the larger the monopole and the smaller the ellipticity of the orbit for given fractional perturbation . Indeed, deviations from circular motion are minimum for a point-mass (Kepler) potential, where . For more general mass profiles, such as those of CDM halos, where is finite at the center and tends to zero, the ellipticity of closed loop orbits is expected to increase dramatically toward the center, even for relatively minor deviations from spherical symmetry.
Along an orbit, the maximum deviations from circular motion occurs along the minor and major axis of the perturbation. Assuming an NFW profile for the unperturbed potential, i.e., , we consider in Figure 2 the radial dependence of the tangential velocity, , for various values of .
The top panel shows the logarithmic slope of the velocity profile along the axis for perturbation magnitudes of and , respectively. For negative values of , the axis corresponds to the minor axis of the isopotential contours and the major axis of the closed loop orbits, and the tangential velocity is at a minimum at this point on the orbit. The middle panel of Figure 2 shows the ratio , and the bottom panel shows the ellipticity of the orbits, which scales as the ratio between the escape and circular velocities and therefore increases toward the center of the NFW potential.
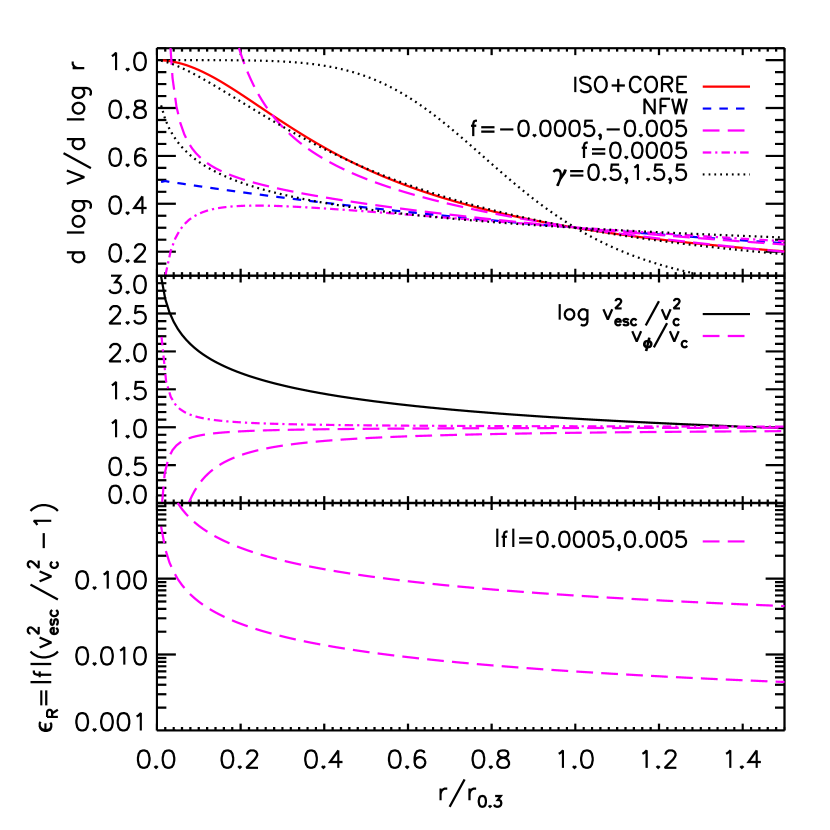
Also shown in the top panel are the logarithmic slopes of the NFW (dashed) and pseudo-isothermal (solid) velocity profiles, as well as the rotation curve fitting formula of Courteau (1997) (dotted). The pseudo-isothermal velocity profile is given by , where is the asymptotic velocity and is the radius of the constant density core in this model. The Courteau velocity profile is given by , where and are dimensional scaling parameters and is a dimensionless parameter that characterizes the shape of the rotation curve. This three-parameter formula provides excellent fits to LSB rotation curves with a wide variety of shapes (Hayashi et al., 2004).
Figure 2 shows that even small perturbations in the potential can result in large changes in the shape of the velocity profile. For , the shape of the profile is similar to that of the pseudo-isothermal profile (and of that corresponding to ) down to radii as small as one-third of . Reducing the magnitude of has the effect of moving inwards the radius (in units of ) where the deviations become important but, because the term formally diverges at the center, the shape of the rotation curve always deviates significantly from the true circular velocity curve somewhere near the center. Also shown in Figure 2 is the velocity profile along the axis for a perturbation with . Note that this is equivalent to the velocity profile along the minor () axis for (see eqs. 5 and 7). Along this axis, the tangential velocity is at a maximum, and the logarithmic slope of the inner velocity profile is actually shallower than NFW. This implies that the shape of the rotation curve of a disk in a non-spherical potential varies depending on the viewing angle from which it is observed, a possibility we investigate further in 4.
We note that the analytic expressions for the closed orbit solutions are derived assuming , therefore the solutions break down for large perturbations where epicyclic theory is not a good approximation to the true solution for the orbits. The bottom panel of Figure 2 shows that the ellipticity of the orbits predicted by the epicyclic approximation reaches values of at small radii for sufficiently large perturbation magnitudes. In practice the closed orbit solutions are valid down to some minimum radius where the epicyclic approximation still holds, therefore we show the solutions only at radii where in all subsequent figures.
The results shown in Fig 2 suggest that caution should be exercised when interpreting the constraints on the slope of the dark halo inner cusp derived from analyzing the innermost region of long-slit rotation curves (de Blok and Bosma, 2002; de Blok, 2005). These regions are not just particularly sensitive to observational error (Swaters et al., 2003; Spekkens et al., 2005) but, as the discussion above illustrates, one would expect on rather general grounds that gas velocities near the center might deviate substantially from the circular speed.
3.2 Case II: A Radially Varying Perturbation
In general, the magnitude of the perturbation, , is expected to be a function of radius and it is instructive to consider perturbations to an NFW potential that may result in a pseudo-isothermal rotation curve along the major axis of the closed loop orbits. In order to derive such a perturbation, we cannot use the simplified solutions in eqs. 6-8, but instead set and calculate numerically the function required to satisfy eq. 5 for . Note that, by construction, this perturbation vanishes as since both the pseudo-isothermal and NFW mass profiles are convergent at small radii.
We set the parameters of the unperturbed NFW potential to match a typical LSB galaxy; the mass, virial radius and scale radius are set to , , and , respectively, giving a peak circular velocity of . The pseudo-isothermal velocity profile is normalized to match the NFW profile at such that and . The maximum deviation between the NFW and the pseudo-isothermal profile within is at a radius of . We emphasize that, although this procedure specifies a particular radial dependence for , in general most well-behaved perturbations will lead to deviations from the circular speed which become more pronounced toward the center, generally mimicking the presence of a “core” along the axis.
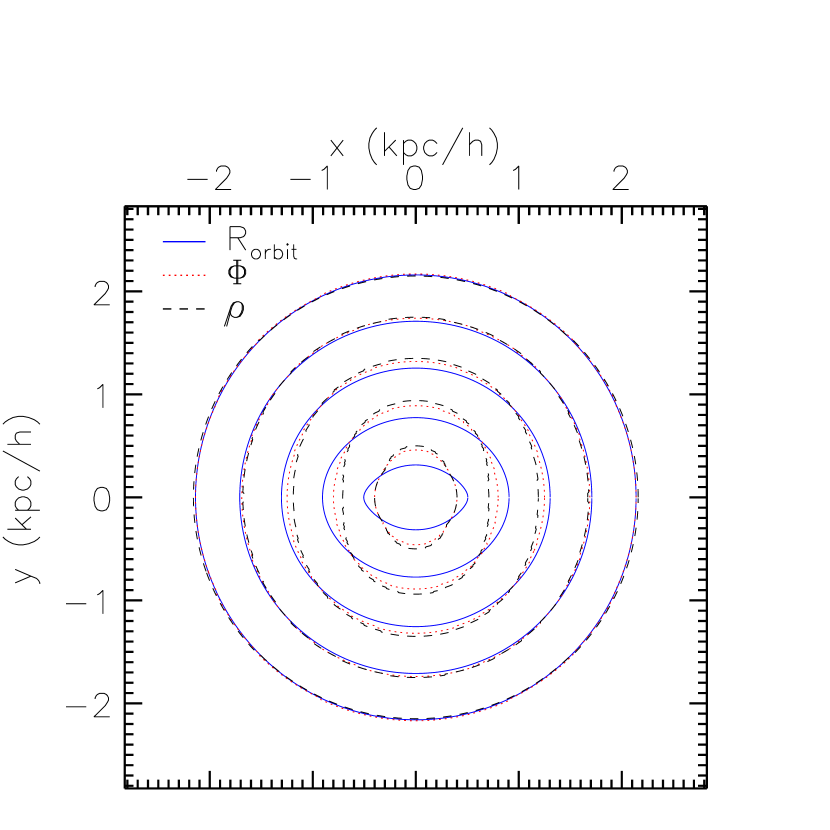
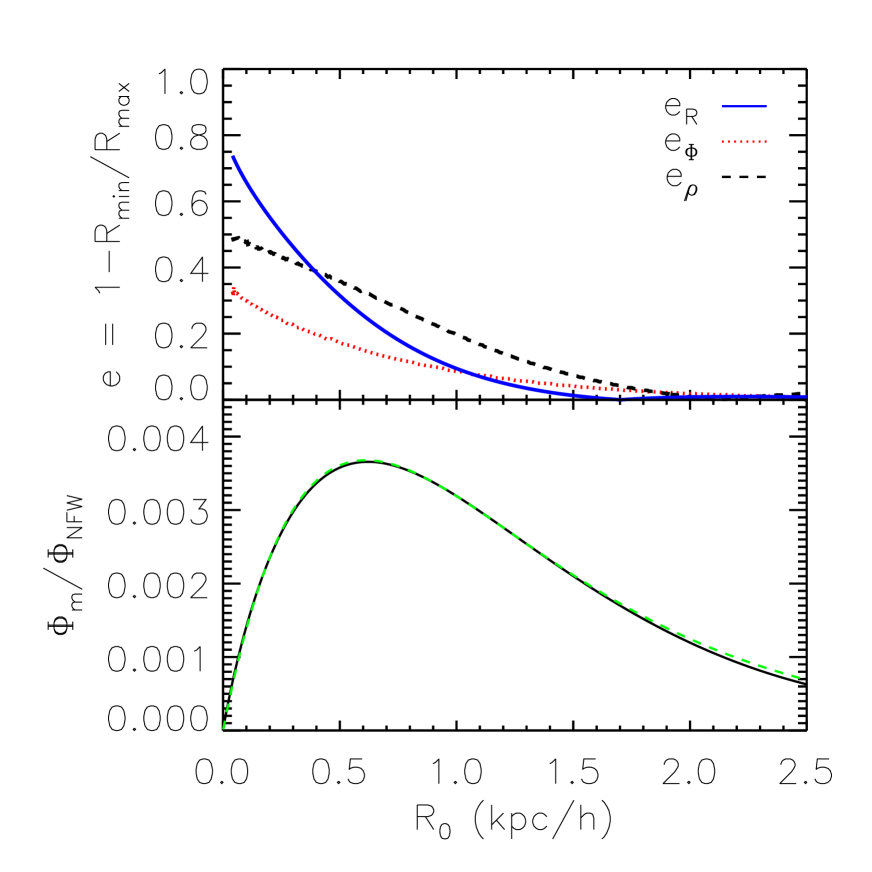
A few closed loop orbits are shown in the top panel of Figure 3 along with the isopotential contours of the perturbed NFW potential. Also shown are the corresponding isodensity contours, calculated by solving Poisson’s equation. The major axis of the halo isopotential contours is perpendicular to the major axis of the closed loop orbits. The bottom panel shows the eccentricity, , of the orbits as well as that of the isopotential and isodensity contours. In general, the isopotential contours are more circular than either the isodensity contours or the orbits, and all three become more elongated at small radii, despite the fact that the magnitude of the perturbation decreases towards the center.
This is shown in the bottom panel of Figure 3, which shows the perturbation magnitude as function of radius. The magnitude of the perturbation , increases from zero at the center to a maximum of at and is well fit by a function of the form:
| (9) |
where and the best fit parameter values are and . We note that the perturbation described by eq. 9, or any similar function which peaks at roughly the same radius and amplitude, gives similar results as the exact solution for .
4 Simulated Rotation Curves
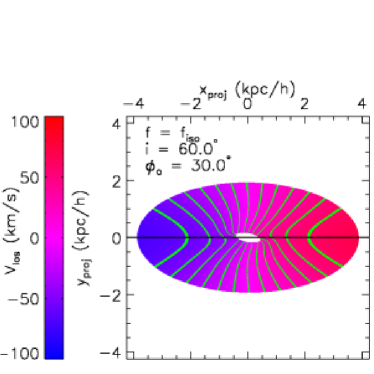
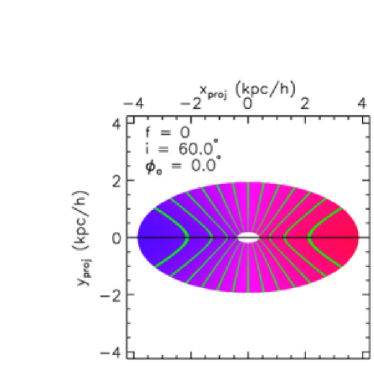
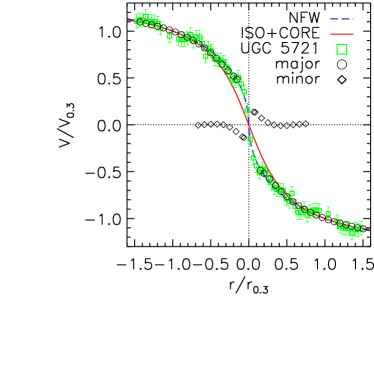
We now investigate the rotation curves expected when observing a thin gaseous disk whose kinematics are described by the closed loop orbits presented in the previous section. Figure 4 shows the orbits for a disk projected at an inclination angle . The upper panels of each of the four sets show the projected image of the disk, color-coded by line-of-sight velocity . The isovelocity contours are drawn at intervals. The lower panels show the rotation curve obtained by sampling the disk with a thin slit placed along the major axis of the disk, as indicated in the upper panels by the solid horizontal line. Also shown are the NFW and pseudo-isothermal velocity profiles and rotation curve data from one of the two galaxies in Figure 1, scaled to .
The upper left, upper right, and lower left sets of panels of Figure 4 show, for , the disk when viewed along various orientations, so that the angle between the projected minor axis and the minor axis of the orbits is and , respectively.
When the two minor axes coincide, , and the rotation curve matches the curve by construction (see open circles in the rotation curve panel). Note that for this projection, the isovelocity contours of the disk are exactly symmetric, and the elliptical nature of the orbits is degenerate with the inclination and circular velocity profile, so that the triaxiality of the halo would be difficult to detect. Indeed, a slit placed across the minor axis of the disk—a crude but useful method of assessing triaxiality—would show no net rotation for this projection (see diamonds in the rotation curve panel). This ought to be taken into account when searching for signatures of triaxiality in velocity fields, and it weakens the argument of Gentile et al. (2005), who argue against triaxiality from the lack of strong minor axis rotation in the HI velocity field of DDO 47. Actually, the isovelocity contours in DDO 47 (see their Figure 1) show clearly some of the twists and asymmetries expected for elliptical orbits, as we discuss below.
Under a different projection, , subtle differences in the velocity field are noticeable. Firstly, the isovelocity contours are no longer symmetric about the axis. Instead they exhibit “twists” near the centre of the projected disks, although the velocity field is symmetric relative to a rotation. As a result, the minor axis no longer traces an isovelocity contour, and some “rotation” is seen along the minor axis, although confined to the very center. Note that the shape of the major axis rotation curve still matches quite well the pseudo-isothermal profile and the linearly rising rotation curve of UGC 5750.
The lower left panels of Figure 4 shows the disk from a more skewed viewing angle, . The major axis rotation curve in this case resembles better the true NFW circular velocity profile and the rotation curve of UGC 5721. The distortions in the isovelocity contours are now more pronounced; in particular, the shape of each contour is different in the upper half from the bottom half of the galaxy but it is still symmetric relative to a rotation. Loosely speaking, one may see the imprint of the halo triaxiality in a velocity field that differs significantly in contiguous quadrants, but is anti-symmetric in diagonally opposite ones.
Complex velocity fields requiring more than just circular, coplanar motion in “tilted rings” are the norm rather than the exception near the center of LSBs. This has been clearly demonstrated by the high-resolution combined HI, H, and CO maps of 5 LSBs presented recently by Simon et al. (2003, 2005). As these authors conclude, departures from simple circular motion is clear in the majority of galaxies in their sample.
Although Simon et al interpret these deviations in term of “radial motions” (i.e., pure expansion or contraction component of the tilted rings) the interpretation of this complexity in terms, instead, of elongations in the potential remains viable. In particular, we note that the isovelocity contours of NGC 2976 (Figure 4a of Simon et al 2003) show clearly some of the twists illustrated in the lower left panel of Figure 4. We also note that their conclusion about the lack of a cuspy dark matter halo relies heavily on assuming that the rotational velocity component of their tilted-ring fit traces the circular velocity of the halo, an assumption that may require revision if the non-circular motions seen in their data are ascribed to the effects of triaxiality. Ongoing work is aimed at reaching a more definitive conclusion on this.
Finally, the lower right panels of Figure 4 show, for comparison, the velocity field of a disk in circular motion in an unperturbed () NFW potential, whose rotation curve is in this case indistinguishable from the long-slit, , rotation curve. This illustrates that long-slit rotation curves cannot discriminate between these two cases; two-dimensional velocity fields are needed.
5 Discussion
Given the variety of rotation curve shapes that arise when considering gaseous disks in non-axisymmetric halo potentials, the outlook for reconciling dark matter cusps with LSB rotation curves is promising. In particular, the fact that departures from circularity are expected to increase towards the center, and that relatively large effects are possible even in the presence of minor asphericity appear rather encouraging.
However, it would be premature to argue that the problem has been fully solved. Although from the analysis presented here it appears that, on general grounds, one may expect at least some rotation curves to be consistent with cored profiles, it is unclear at this point whether the frequency (and sizes) of apparent “cores” is consistent with this interpretation. This is likely to depend critically on the triaxiality of the potential in the very inner regions, as well as on the response of the halo to the assembly of the disk and its orientation relative to the halo’s principal axes. All of these issues are still quite uncertain.
It is therefore important to build a more compelling case for the triaxial interpretation of cores in LSB rotation curves, so as to render it falsifiable. Are the shapes of CDM halos in fact consistent with the perturbed potentials we have explored? We are currently investigating this using a sample of high-resolution galaxy-sized halos. Are there any corroborating traits that may be used to confirm or exclude the hypothesis that halos surrounding LSBs are indeed triaxial? Baryonic matter in the form of a bar could have a similar effect on gas motions as a triaxial dark matter halo (Rhee et al., 2004).
How can one best verify the triaxial halo interpretation in two-dimensional velocity maps? Identifying a clean and unambiguous indication of triaxiality, such as the unusual isovelocity “twists” and symmetry patterns shown in Figure 4, will be as important as the success of aspherical halos in reproducing the rich variety of shapes of LSB rotation curves. Only if this is accomplished shall we be able to conclude that LSB rotation curves do not preclude the presence of dark matter density cusps, thereby freeing the CDM paradigm of one vexing challenge on small scales.
Acknowledgements
This work has been supported by various grants to JFN from NSERC, CFI, and by fellowships from the Alexander von Humboldt Foundation. We thank the members of our long-term N-body collaboration, Carlos Frenk, Simon White, Adrian Jenkins, Volker Springel, and Chris Power for valuable discussions during the course of this project. Joachim Stadel, Tom Quinn, and James Wadsley are also thanked for giving us access to their excellent hydrodynamic code GASOLINE, which we used in the early stages of this project. We also thank Josh Simon and Alberto Bolatto for useful discussions. We thank Linda Sparke for valuable insights that greatly improved this work. We thank the anonymous referee for many useful comments and suggestions which significantly improved this manuscript.
References
- Barnes and Efstathiou (1987) Barnes, J. and Efstathiou, G.: 1987, ApJ 319, 575
- Binney and Tremaine (1987) Binney, J. and Tremaine, S.: 1987, Galactic dynamics, Princeton, NJ, Princeton University Press
- Courteau (1997) Courteau, S.: 1997, AJ 114, 2402
- Courteau et al. (2003) Courteau, S., Andersen, D. R., Bershady, M. A., MacArthur, L. A., and Rix, H.-W.: 2003, ApJ 594, 208
- Davis et al. (1985) Davis, M., Efstathiou, G., Frenk, C. S., and White, S. D. M.: 1985, ApJ 292, 371
- de Blok (2005) de Blok, W. J. G.: 2005, Preprint [astro-ph/0506753]
- de Blok and Bosma (2002) de Blok, W. J. G. and Bosma, A.: 2002, A&A 385, 816
- de Blok et al. (2001) de Blok, W. J. G., McGaugh, S. S., and Rubin, V. C.: 2001, AJ 122, 2396
- Diemand et al. (2004) Diemand, J., Moore, B., and Stadel, J.: 2004, MNRAS 353, 624
- Flores and Primack (1994) Flores, R. A. and Primack, J. R.: 1994, ApJ 427, L1
- Franx et al. (1994) Franx, M., van Gorkom, J. H., and de Zeeuw, T.: 1994, ApJ 436, 642
- Frenk et al. (1988) Frenk, C. S., White, S. D. M., Davis, M., and Efstathiou, G.: 1988, ApJ 327, 507
- Fukushige and Makino (1997) Fukushige, T. and Makino, J.: 1997, ApJ 477, L9
- Fukushige and Makino (2001) Fukushige, T. and Makino, J.: 2001, ApJ 557, 533
- Gentile et al. (2005) Gentile, G., Burkert, A., Salucci, P., Klein, U., and Walter, F.: 2005, Preprint [astro-ph/0506538]
- Gerhard and Vietri (1986) Gerhard, O. E. and Vietri, M.: 1986, MNRAS 223, 377
- Ghigna et al. (2000) Ghigna, S., Moore, B., Governato, F., Lake, G., Quinn, T., and Stadel, J.: 2000, ApJ 544, 616
- Hayashi et al. (2004) Hayashi, E., Navarro, J. F., Power, C., Jenkins, A., Frenk, C. S., White, S. D. M., Springel, V., Stadel, J., and Quinn, T. R.: 2004, MNRAS 355, 794
- Jing et al. (1995) Jing, Y. P., Mo, H. J., Borner, G., and Fang, L. Z.: 1995, MNRAS 276, 417
- Jing and Suto (2002) Jing, Y. P. and Suto, Y.: 2002, ApJ 574, 538
- McGaugh and de Blok (1998) McGaugh, S. S. and de Blok, W. J. G.: 1998, ApJ 499, 41
- Moore (1994) Moore, B.: 1994, Nature 370, 629
- Moore et al. (1998) Moore, B., Governato, F., Quinn, T., Stadel, J., and Lake, G.: 1998, ApJ 499, L5
- Navarro et al. (1996) Navarro, J. F., Frenk, C. S., and White, S. D. M.: 1996, ApJ 462, 563 (NFW)
- Navarro et al. (1997) Navarro, J. F., Frenk, C. S., and White, S. D. M.: 1997, ApJ 490, 493
- Navarro et al. (2004) Navarro, J. F., Hayashi, E., Power, C., Jenkins, A. R., Frenk, C. S., White, S. D. M., Springel, V., Stadel, J., and Quinn, T. R.: 2004, MNRAS 349, 1039
- Rhee et al. (2004) Rhee, G., Valenzuela, O., Klypin, A., Holtzman, J., and Moorthy, B.: 2004, ApJ 617, 1059
- Schoenmakers et al. (1997) Schoenmakers, R. H. M., Franx, M., and de Zeeuw, P. T.: 1997, MNRAS 292, 349
- Sellwood and Kosowsky (2001) Sellwood, J. A. and Kosowsky, A.: 2001, in ASP Conf. Ser. 240: Gas and Galaxy Evolution, pp 311–+
- Simon et al. (2003) Simon, J. D., Bolatto, A. D., Leroy, A., and Blitz, L.: 2003, ApJ 596, 957
- Simon et al. (2005) Simon, J. D., Bolatto, A. D., Leroy, A., Blitz, L., and Gates, E. L.: 2005, ApJ 621, 757
- Spekkens et al. (2005) Spekkens, K., Giovanelli, R., and Haynes, M. P.: 2005, AJ 129, 2119
- Spergel and Steinhardt (2000) Spergel, D. N. and Steinhardt, P. J.: 2000, Physical Review Letters 84, 3760
- Swaters et al. (2000) Swaters, R. A., Madore, B. F., and Trewhella, M.: 2000, ApJ 531, L107
- Swaters et al. (2003) Swaters, R. A., Madore, B. F., van den Bosch, F. C., and Balcells, M.: 2003, ApJ 583, 732 (S03)
- Thomas et al. (1998) Thomas, P. A., Colberg, J. M., Couchman, H. M. P., Efstathiou, G. P., Frenk, C. S., Jenkins, A. R., Nelson, A. H., Hutchings, R. M., Peacock, J. A., Pearce, F. R., and White, S. D. M.: 1998, MNRAS 296, 1061
- Warren et al. (1992) Warren, M. S., Quinn, P. J., Salmon, J. K., and Zurek, W. H.: 1992, ApJ 399, 405
![[Uncaptioned image]](/html/astro-ph/0608376/assets/x5.png)
![[Uncaptioned image]](/html/astro-ph/0608376/assets/x6.png)
![[Uncaptioned image]](/html/astro-ph/0608376/assets/x7.png)
![[Uncaptioned image]](/html/astro-ph/0608376/assets/x8.png)