The Automated Palomar 60-Inch Telescope
Abstract
We have converted the Palomar 60-inch telescope (P60) from a classical night assistant-operated telescope to a fully robotic facility. The automated system, which has been operational since September 2004, is designed for moderately fast ( minutes) and sustained ( mag) observations of gamma-ray burst afterglows and other transient events. Routine queue-scheduled observations can be interrupted in response to electronic notification of transient events. An automated pipeline reduces data in real-time, which is then stored on a searchable web-based archive for ease of distribution. We describe here the design requirements, hardware and software upgrades, and lessons learned from roboticization. We present an overview of the current system performance as well as plans for future upgrades.
1 Introduction
The field of optical transient astronomy has matured to produce numerous important scientific discoveries in recent years. Type Ia supernovae (SNe) have been used as standard candles to produce Hubble diagrams out to , providing evidence that the expansion of the universe is accelerating (Riess et al., 1998; Perlmutter et al., 1999). Observations of the broadband afterglows of long-duration ( s) gamma-ray bursts (GRBs) have revealed an association with the deaths of super-massive stars (Galama et al., 1998; Stanek et al., 2003; Hjorth et al., 2003). The discovery of the first afterglows and host galaxies of short-duration ( s) GRBs (Gehrels et al., 2005; Bloom et al., 2006; Hjorth et al., 2005; Fox et al., 2005b) has possibly revealed a new class of GRB progenitors: compact binary coalescence (Eichler et al., 1989).
As interest in the field has steadily grown, new, more powerful methods of identifying optical transients have been developed. The Swift Gamma-ray Burst Explorer (Gehrels et al., 2004) is currently providing 100 prompt GRB localizations per year, an order-of-magnitude improvement over previous missions. Planned wide-angle, high-cadence surveys with large facilities, such as Pan-STARRS (Kaiser et al., 2002) and LSST (Tyson, 2005), promise to overwhelm our current follow-up capability, providing hundreds of variable optical sources each night.
Dedicated, robotic, medium aperture ( m) telescopes have the opportunity over the next few years to play a crucial role in this field. Like small-aperture (-m), robotic facilities, they can respond autonomously to transient alerts, providing observations at early times. And given the relative abundance of such telescopes, it is entirely feasible to focus predominantly on transient astronomy. However, like larger telescope (-m), interesting events can be followed for longer durations and in multiple colors. In this sense robotic, medium-aperture facilities can act to bridge the gap between the earliest rapid-response observations and deep, late-time imaging and spectroscopy.
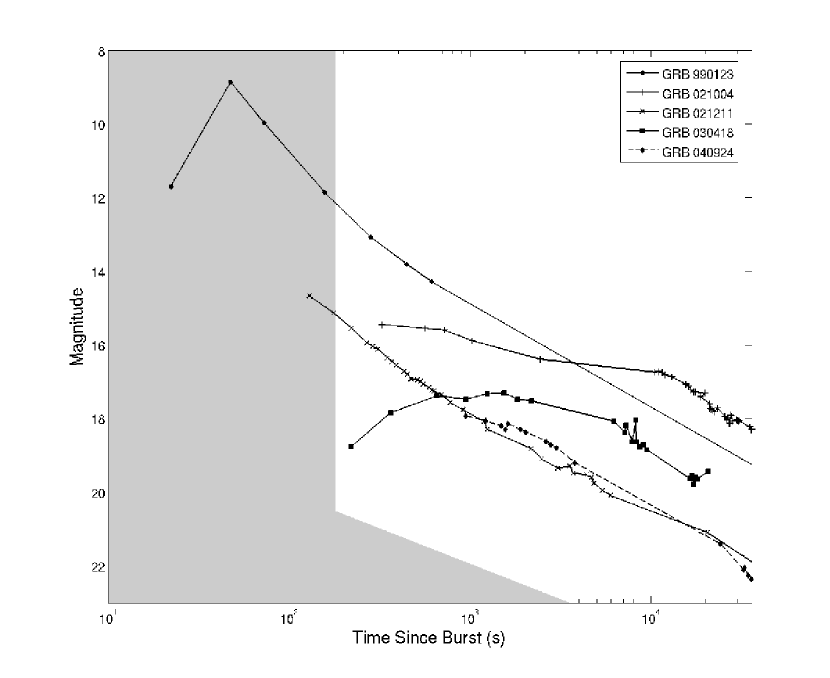
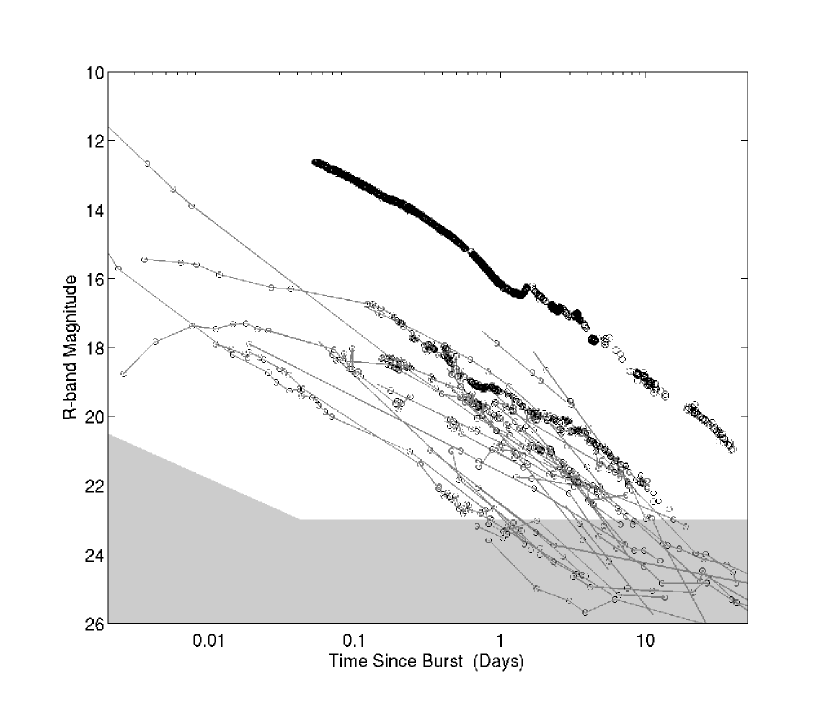
To this end, we have roboticized the Palomar 60-inch telescope (P60). As a dedicated, robotic facility, the P60 is capable of responding moderately fast ( min) to transient alerts. With the increased event rate of Swift, the P60 is providing observations of the poorly understood early afterglow phase (Fig. 1). Additionally, as a 1.5-m telescope, the P60 can continue the sequence of observations longer than most robotic telescopes. As Figure 2 shows, one day after the burst, most afterglows have faded below ; however, for days or even weeks after that, they remain at levels of accessible to P60 photometry.
In this work, we first outline the high-level design requirements of a robotic system optimized for observations of transient sources (§2). §3 provides the details of the automation procedure, including both the hardware and the software efforts. §4 describes the current system performance (as of May 2006), which will primarily be of use for those interested in observing with the P60. Finally, in §5, we conclude with a summary of the project status and a discussion of possible future improvements to the robotic system.
2 General Design Considerations
Designing a robotic system for transient astronomy presents a unique set of challenges from both a hardware and a software perspective. It is necessary to create an intelligent system that can reliably handle the roles usually provided by the observer and night assistant at a standard facility (see, e.g., Genet & Hayes 1989).
Given our scientific objectives, we identified following system requirements for the Palomar 60-inch Automation Project:
-
1.
Automated transient response in min. GRB afterglows are predicted to decay in time as a power-law () with index 1–2, depending on whether the emission is dominated by the forward (; Sari et al. 1998) or reverse (; Sari & Piran 1999) shock. For (optically) bright bursts, rapid response enables studies of the afterglow at its brightest, shedding light on the poorly understood early afterglow phase (Figure 1). For the fainter bursts, rapid response is required simply to obtain a detection or even a meaningful upper limit (Figure 2). Our desired response overhead is limited primarily by the telescope slew time.
-
2.
CCD Readout in s. Given the expected power-law behavior, densely-sampled observations are necessary to accurately characterize the early afterglow decay. And since our current system is not equipped with an automated guider, deep observations must be broken down into many individual exposures (and hence many accompanying readouts). Given typical values for our telescope slew (3 min) and exposure (1–3 min) times, we determined a readout time s would not significantly affect our sampling rate or efficiency.
-
3.
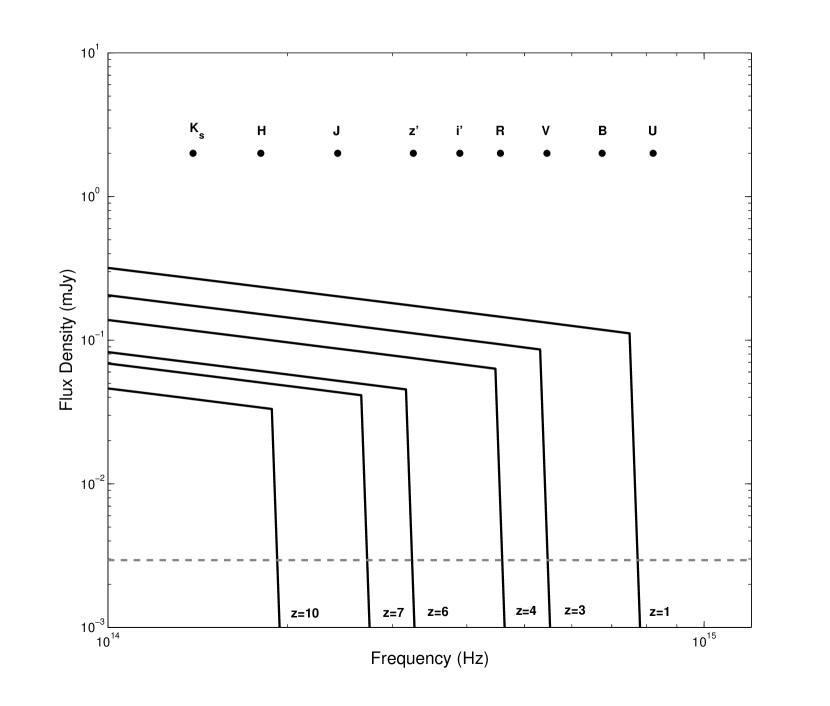
Photometry from the near ultra-violet to the near-infrared: GRB redshifts can be estimated photometrically by modeling afterglow spectral energy distributions (SEDs). Ly- absorption in the Inter-Galactic Medium (IGM) causes a steep cut-off in the SED, the location of which indicates the afterglow redshift (Lamb & Reichart, 2000). To constrain as large a spectral range as possible (), we require coverage over the entire optical bandpass (see Figure 3). The ideal solution would be a multi-band camera, providing simultaneous imaging in multiple filters. The cost of either purchasing or building such an instrument, however, was too high for our first generation of operations. Instead, we employ a 12-position filter wheel, with coverage spanning from Johnson -band ( Å) to Sloan ( Å).
-
4.
Intelligent observation oversight. Like a virtual night assistant, a centralized source of information is required to effectively manage nightly observations (i.e. telescope, weather, and instrument status information). Under ideal conditions, this is not a difficult task. More challenging, however, is implementing a robust capability to intelligently respond to adverse conditions.
-
5.
Queue scheduling system for non-TOO mode. Since not all of the telescope time is devoted to rapid-response GRB observations, a scheduler is needed to handle standard scientific observations, as well as calibration images. We chose to implement a queue-scheduler, as it is capable of providing real-time management of observations (i.e. targets can be submitted to the queue at any time) with a minimal amount of daily oversight (night-to-night memory ensures that there is no need to write daily target lists). Furthermore, a queue-scheduler is ideally suited for long-term monitoring of transient objects; SNe and GRBs can be left in the queue for regular monitoring on time scales of weeks or even months.
-
6.
Automated, real-time ( min) data reduction. Real-time data reduction is necessary for several reasons. First and foremost, feedback is required for standard system oversight commonly performed by observers present at the telescope. Focusing is the simplest example. Secondly, rapid identification of optical counterparts is critical for intelligent follow-up observations. High-resolution absorption spectroscopy in particular requires a rapid turn-around with large facilities. Finally, properly handling the large amounts of data produced on a nightly basis requires that data reduction be fully automated.
-
7.
Fully searchable, web-based data archive. The average P60 data rate, including daily calibration files, is 5 GB per night. Furthermore, with our queue-scheduling system, science images are obtained for a large number of users () on most nights. We therefore opted for a high-capacity, fully searchable data archive for ease of data storage and distribution.
3 Automation Procedure
In the previous section we outlined the design requirements for the automated system. Here we describe the techniques we have used to meet these requirements in a more thorough manner.
3.1 New CCD & Electronics
The previous P60 CCD took almost three minutes to read out, unacceptably long given our desired response time of minutes. Furthermore, the camera was only accessible via a local microVAX terminal, making automated observations impossible. To meet our design requirements, we chose to build a new camera using the latest San Diego State University controller, Generation III electronics (SDSU-III; Leach & Low 2000). This system is capable of better performance than an off-the-shelf product, with the trade-off that a significant time investment was required for development and testing. In the following two sections, we describe the new electronics (§3.1.1) and the software used to control the camera (ArcVIEW; §3.1.2).
3.1.1 SDSU-III Electronics
The telescope was equipped with a new SITe 2K 2K back-illuminated CCD. While we have not measured the quantum efficiency of the new device, our observations indicate its quantum efficiency is comparable to that of the previous camera (which was an identical SITe 2k 2k CCD). For reference, we include a quantum efficiency plot from the old CCD in Figure 4.

The new CCD is controlled by an SDSU-III controller (Leach & Low, 2000). The new controller contains a faster optical link than the Generation II system, as well as a newly designed timing board. The system is capable of reading out four channels in parallel. However, to reduce costs and simplify fabrication, we currently utilize only two amplifiers for readout.
Temperature sensors were placed in thermal contact with the CCD, the dewar neck and can, as well as on board the electronics. These sensors are capable of triggering an alarm under abnormal conditions, for example when the dewar runs out of liquid nitrogen and begins to warm.
In addition to the standard full-frame readout mode, two additional capabilities have been implemented. Using the region-of-interest (ROI) functionality, we can read out only a subsection of the chip. This is particularly important for small GRB error circles, helping to improve both the sampling rate and efficiency of our system. Additionally, the ability to manipulate charge independent of the readout (“parallel shift”) greatly decreases the time required for a focus loop. This has been of utmost importance, given the difficulties we have encountered maintaining system focus throughout the night (see §4.3).
The relevant characteristics of the new camera are outlined in Tables 1 and 2. The P60 camera was the first developed under an engineering scheme designed to standardize enclosures and cabling for new instruments on the mountain. The lessons learned have been extended to future instruments being developed for Palomar Observatory.
| Property | Amplifier 1 | Amplifier 2 | Full Chip |
|---|---|---|---|
| Array Size | |||
| Pixel Size (m) | 24 | ||
| Plate Scale (arcsec pixel-1) | 0.378 | ||
| Field of View (arcmin) | |||
| Gain (e- ADU-1) | 2.2 | 2.8 | |
| Read Noise (e-) | 5.3 | 7.8 | |
| Dark Current (e- s-1) | |||
| Charge Transfer Efficiency | 99.999% | 99.999% | |
| Full Well Capacity (e-) | 130,000 | 140,000 | |
| Bias Level (ADU) | 610 | 445 | |
| Saturation Limit (ADU) | 50,000 | 45,000 |
| Fraction of Array | Sky Size | Readout Time |
|---|---|---|
| (arcmin) | (s) | |
| Full | 24 | |
| 18 | ||
| 10 |
3.1.2 Instrument Control System: ArcVIEW
The software used to control instrument operation is called ArcVIEW, a package that was developed at the Cerro Tololo Inter-American Observatory and Caltech. It is based on Labview (interfaces and communication) and C (real time data processing and drivers API).
The ArcVIEW architecture consists of a set of software modules that can be loaded or unloaded dynamically to control different processes. The core of the software receives commands and passes them to the appropriate module for processing. A translation layer built into the system allows for transparent hardware control (i.e. the standard command set available to the user is independent of the details of the hardware being controlled).
ArcVIEW commands are sent as plain ASCII strings passed through raw sockets. Graphical User Interfaces (GUIs) are not needed to control the system; however, some of them are provided in order to handle data taking, filter movements, TCS commands, and low-level engineering commands in a user-friendly way.
Besides the normal command/response channel, ArcVIEW contains an optional asynchronous message channel, that allows the system to send asynchronous alarm messages (temperatures, power supplies, etc.), callbacks, or event messages to the connected client. Using this extra channel it is possible to perform simultaneous actions (e.g. moving the telescope while reading out the array).
The final output of the system is an image (or sequence of images) written in FITS format and containing user-defined header information. The two P60 amplifiers are read out and stored as a multi-extension FITS file.
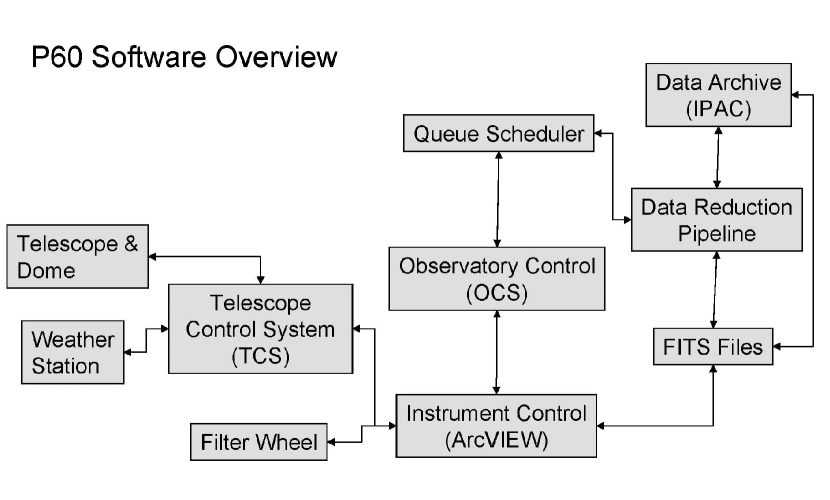
We have chosen a modular design for our major software components, as illustrated in Figure 5. Each component acts independently, with a well-defined communication protocol between the different modules. This makes software upgrades easier, allows for a clean division of labor and responsibilities, and guarantees a more robust system, as failure in one component does not necessarily imply complete system failure. Modular designs have long been in use at automated facilities and have proved both reliable and effective (see, e.g., Honeycutt & Turner 1992; Steele & Carter 1997; Granzer et al. 2001; Bloom et al. 2005).
On the P60, ArcVIEW acts as a single point of contact between hardware operation (telescope, CCD, and filter wheel), and all other system components (see Figure 5).
3.2 Observatory Control System
The purpose of the Observatory Control System (OCS) is to provide intelligent oversight of nightly observations and to coordinate information from all system components (Fig. 5). We identify four primary tasks for which the OCS is responsible, each discussed below.
First, at the beginning of each night, the OCS spawns the queue-scheduling software in a separate process (see §3.3). These two systems communicate throughout the night via a socket, as real-time target selection depends on the success of previous observations.
After receiving an observation request, the OCS is then responsible for executing it in a safe and efficient manner. Communication with the Telescope Control System (TCS), via the transparent ArcVIEW intermediary, ensures that external conditions permit the requested observation. All component tasks that can be completed in parallel (e.g. moving the telescope and filter wheel) are done so to improve system efficiency. An observation is considered to have completed successfully when the readout of the final exposure begins.
Third, after the successful completion of the first images on any given night, the OCS spawns the data reduction pipeline in a separate process (see §3.4). These two systems communicate to ensure the integrity of science images, most notably by maintaining telescope focus throughout the night (see §4.3).
Finally, the OCS handles any errors that arise during the normal course of operations. Each error condition is assigned a level in a hierarchy of functionality. Lower levels correspond to more basic, elementary functionality, and vice versa. When an error is discovered, the OCS will begin at the appropriate error level and work downward until the depth of the error condition is determined. The OCS then works to restore the system to functionality. If no solution can be found, the system goes into a safe mode, closing the dome and terminating observations. Email notices and text messages are sent to alert users of this condition.
As an example, we consider an error generated by the focus encoder during routine operation. The OCS first verifies communication with the TCS. If this fails and cannot be restored, the system checks communication with ArcVIEW, as it is responsible for routing most communication. If this too fails and cannot be restarted, the OCS checks for internet connectivity. This process continues until either a solution is discovered or human intervention is required. Similar systems have been utilized successfully on other automated facilities (Honeycutt & Turner, 1992; Granzer et al., 2001).
3.3 Observation Scheduling System
In the design of the Observation Schedule System (OSS), we have deliberately pursued a “short-sighted” strategy of selecting targets in real-time. That is, observations are chosen at each point in the night when the OCS reports being in a ready state – rather than attempting to optimize a sequence of observations over the course of a full night (or over multiple nights). This strategy is relatively well suited to ground-based observations, where future observing conditions are unknown and observing overheads are a relatively minor concern. Moreover, the scheduling protocol and target list for P60 observations are modest enough that a full evaluation of the target list can be performed in a matter of seconds. This principle of “just in time” scheduling has also been pursued at several larger-scale queue-observing facilities (Chavan et al., 1998; Sasaki et al., 2000; Adamson et al., 2004), as well as more modest robotic observatories (Honeycutt et al., 1990; Fraser & Steele, 2004).
Target scores are determined on the basis of raw target priorities, which are fixed in advance, combined with the application of several parametric weightings. The most important of these for scheduling purposes are the Airmass and Night weighting variables, which take as input the current airmass of the target and the number of hours left before the target becomes unobservable (due to target-set or morning twilight), respectively.
The nature of the effect of each weighting is the same. Based on the value of the input variable, the weight is calculated and applied as a multiplier to the target score (initially, the target priority). If the weighting is found to be zero then the target score is necessarily zero; otherwise, the target score will be increased or decreased depending on whether the weight in question is calculated to be greater or less than one.
The full list of possible weighting variables includes:
-
•
Airmass, with input variable the current airmass of the target. This weighting prefers sources that are close to transit (minimum airmass).
-
•
Night, with input variable the number of hours until the source becomes unobservable. This weighting helps ensure efficiency of the scheduler operations since it prefers sources that are setting rather than rising. The estimated duration of the target’s full exposure sequence is included in the calculation.
-
•
Moondeg, with input variable 180 degrees minus the current angular distance from the target to the moon. This avoids taking images with high sky background due to moonlight.
-
•
Seeing, with input variable the current seeing in arcseconds. This allows the segregation of programs according to whether their science is adversely affected by poor seeing.
-
•
Extinction, with input variable the current magnitude of extinction, in the band, due to clouds. This allows segregation of programs according to how strongly they are affected by reduced sensitivity.
The Seeing and Extinction weightings are not yet in operation, but should be applied dynamically within the OSS by the end of summer 2006.
In addition to these parametric weightings, target scores are also adjusted based on timing criteria. The default logarithmic timing scheme steadily increases the score of a target from night to night until it has been observed. Alternate timing schemes allow for periodic (ephemeris-based) or regular aperiodic (“best effort”) monitoring of targets, or for target activation within a specified window of time only.
Finally, we have found it important to increase the score of targets once they have been observed on a given night, so that they are more likely to be observed to completion (one or more sets of the requested exposure sequence) during that night. This prevents fragmentation of observer programs, and reduces overheads which are mostly incurred on a per-target basis.
3.4 Image Analysis Pipeline
The constituent routines for our image analysis pipeline are composed within the context of Pyraf111http://pyraf.stsci.edu/, a Python wrapper for the IRAF data reduction environment of the NOAO222http://iraf.noao.edu/. The pipeline is instantiated in a single Python script which can be run from the Linux command line. The script runs continuously throughout the night, identifying new raw images as they are copied into the target directory, and processing them in real-time.
Pyraf allows access to IRAF routines from within Python, a scriptable, object-oriented, high-level language environment. In particular, Python performs active memory management and, with its various included modules, supports mathematical and logical operations on array variables, regular-expression matching against text strings, and easy access to FITS headers and data.
Python scripts which access arbitrary Pyraf routines can be executed from the command line. The speed of these scripts is not as fast as compiled C routines. However, the single most substantial overhead for script execution is incurred at startup as the Pyraf libraries (including IRAF) are loaded into memory. Once cached in memory, the speed of execution of our scripts is competitive with native IRAF and adequate to our purposes.
The routines of the P60 pipeline execute the following reduction steps in sequence: (1) De-mosaicking, which performs overscan-subtraction on the separate image extensions produced by the two amplifiers, and combines them into a monolithic image while preserving the values of unique header keywords associated with each extension; (2) Bias subtraction against our nightly bias image; (3) Flat-fielding against the dome-flat images taken during the afternoon or previous morning, sky-subtraction, and addition of the dead-reckoning world-coordinate system (WCS); (4) Masking of bad pixels, using the nightly bad pixel mask; (5) Object detection, using a spawned Sextractor333http://terapix.iap.fr/soft/sextractor/ process; (6) WCS refinement via triangle-matching against the USNO B-1.0 catalog444http://www.nofs.navy.mil/data/FchPix/, using the ASCFIT software (Jørgensen et al., 2002); (7) Seeing and zero-point estimation using USNO B-1.0 catalog stars identified in the image.
If an insufficient number of stars are identified during the WCS refinement process for an image, then the dead-reckoning WCS is left untouched and the seeing and zero-point estimation steps are skipped. Calibration products are produced from raw calibration bias and dome-flat images at the start of the night as a separate process.
The final analysis task, which is performed by a special single-purpose script, is to determine our best focus value and current seeing from a single focus-run (multiple exposures and a single readout) on a bright star. For the sake of speed, this task omits most of the standard processing steps.
Additional routines have been coded but are not run in an automated fashion, either because of difficulty in robustly defining their operations, or because of excessive processing requirements. These include: fringe image creation and defringing of and -band images; co-addition of multiple dithered images to achieve greater depth of field; and mosaic co-addition of multiple images, using Swarp555http://terapix.iap.fr/soft/swarp/, to cover areas significantly larger than the CCD field of view.
The P60 pipeline routines are general and can be readily applied to other data reduction tasks; indeed, we have already adapted them to the construction of an interactive pipeline for Wide-Field Infrared Camera (WIRC; Wilson et al. 2003) data reduction at the Hale 200” Telescope.
3.5 Data Archive
The P60 data archive is designed to securely store data collected at the robotic facility, and to provide efficient and convenient access to users from the P60 partner institutions. In return for a share of telescope time, the Infrared Processing and Analysis Center (IPAC) has assumed responsibility for the procurement, installation and maintenance of the archive hardware, as well as for database software development, following specifications provided by the P60 science team at Caltech.
The archive routinely stores the entire set of raw frames, calibration data, and pipeline-processed images collected nightly at the telescope. The data are transmitted down from Palomar mountain to the Caltech campus over the new HPWREN fast data link. The images are transmitted in a non-lossy compressed form, and MD5 checksums are used to verify their integrity. At IPAC, all files are stored on a cluster of Sun computers hosting the archive server and database structure. A RAID5 NEXSAN Ataboy disk farm provides approximately 3 TB of disk space. A second copy of the data is kept on Caltech computers at Robinson Lab as backup. Each nightly batch of data is ingested into the database software, which has an astronomy-optimized architecture similar to other IRSA archives. User access is provided through a web-based interface. Using the archive webpage, users can query the database, locate data they require, and request it from the archive. Data delivery is from a staging area, following email notification to the user. Under normal operating conditions, small data packets can be obtained in this way within minutes.
4 Automated System Performance
The P60 has been running in a fully-automated mode since September 2004. This includes all aspects of operation, from the automated queue-scheduler through nightly ingest of archival data. Here we present an overview of the current system performance, focusing primarily on information relevant for interested P60 observers.
4.1 CCD Camera, Telescope, and Filters
At the current date (June 2006), the camera is performing reliably and has met all relevant specifications. Since the fall of 2004, the amount of time lost due to detector or electronics problems (or related software) is small (%). A summary of the relevant camera details can be found in Tables 1 and 2.
The most relevant characteristic for our science goals is the readout time. The full frame readout time of the system is 24 seconds. This can be significantly reduced, however, by using the region-of-interest mode (§3.1.1). For instance, a 6′ by 6′ field ( of the chip) requires only 10 seconds to read out.
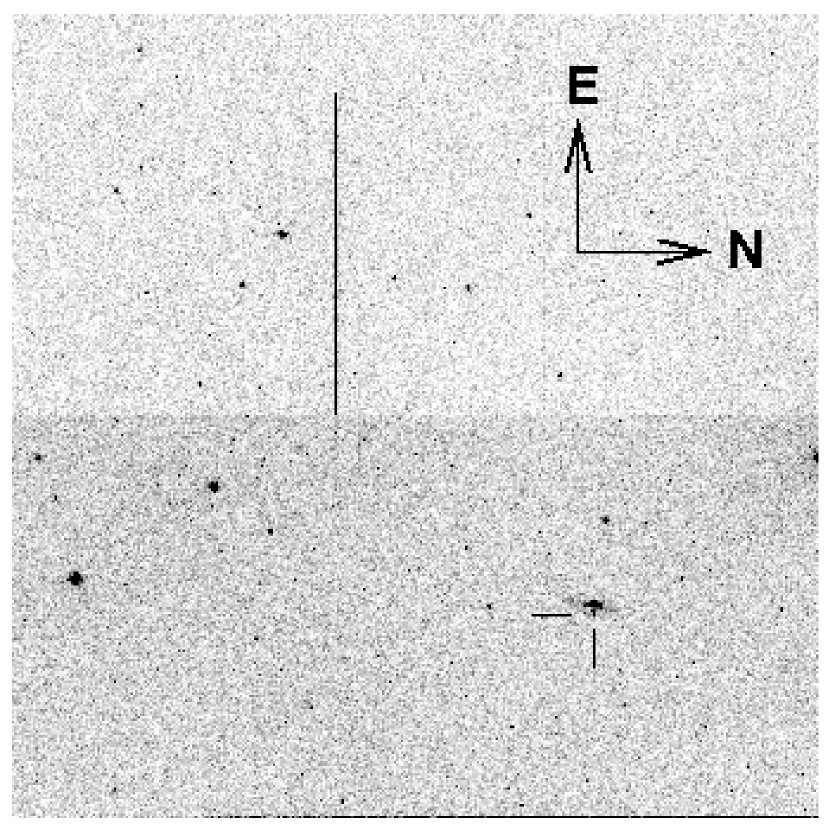
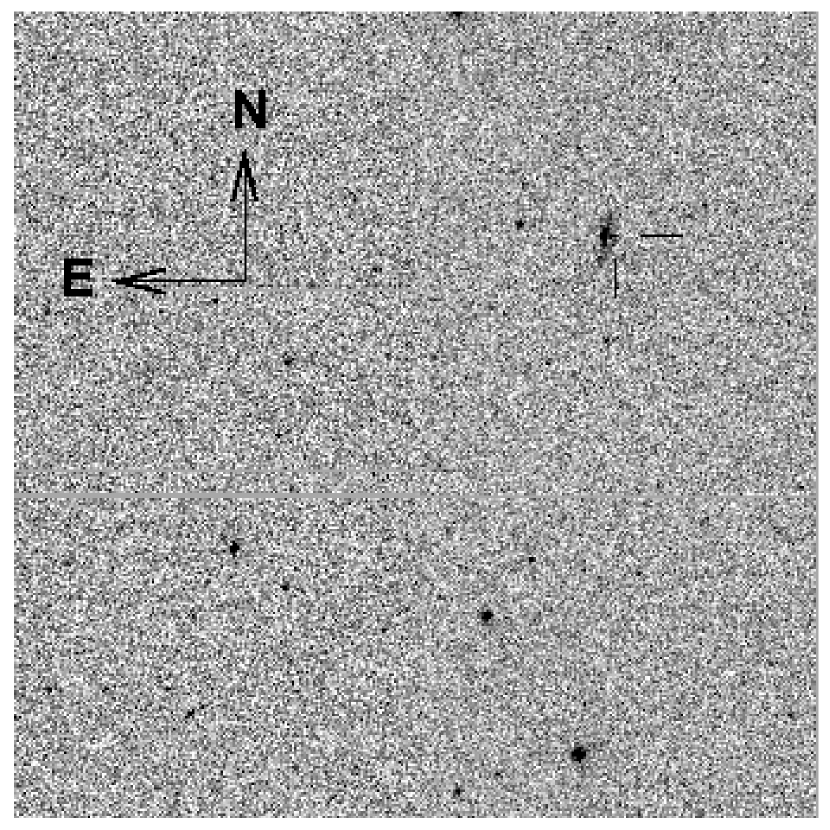
We have found amplifier 1 (the “bottom” amplifier) has a significantly lower read noise than amplifier 2 (the “top” amplifier, 5.3 vs. 7.8 e-). The top region of the CCD is also cosmetically less pleasing than the bottom region, as several adjacent bright columns run through the center portion of the CCD (see Figure 6). We therefore recommend applying a small offset from the central location ( RA, Dec) for non-extended sources. We have added an optional offset parameter to our target specification protocol to make this change easier for users.
The pointing accuracy of the system is more than sufficient for our needs, with typical RMS values of 15″. We have found, however, somewhat deviant behavior (up to 45″ offsets) for targets observed at large airmass (). We believe this is caused by different pointing behavior with the eyepiece mounted (used for rapid manual calculation of the pointing model) than with the CCD camera mounted (nightly observations). We are currently investigating this issue in more depth. However, we note that given our large field-of-view, even pointing errors as large as 1′ are unlikely to cause significant problems.
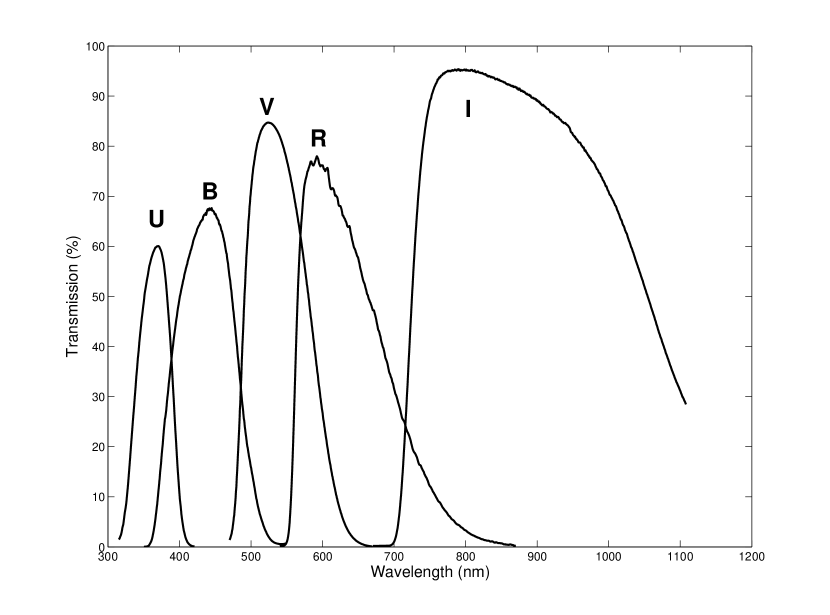
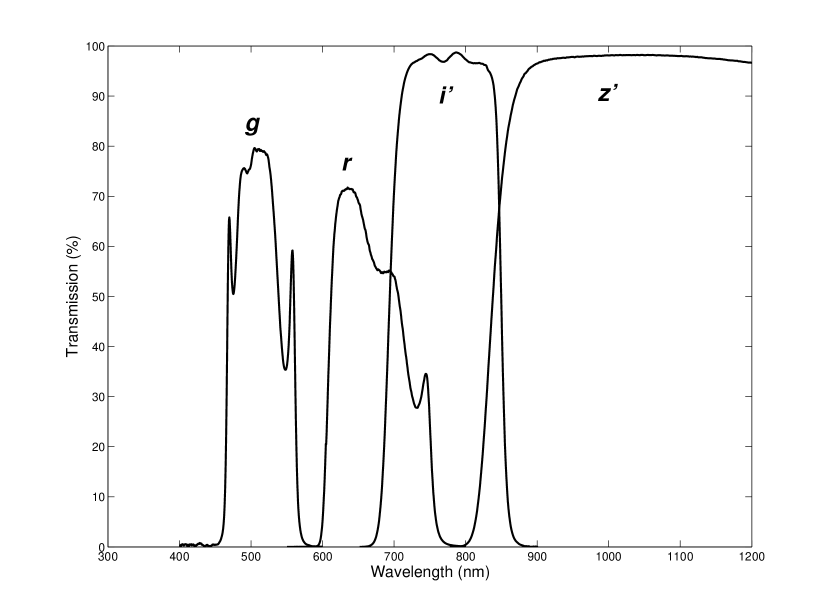
Our typical filter wheel configuration consists of a set of standard broadband filters: Johnson (Bessell 1990 and references therein), Kron (functionally similar to Cousins , Bessell 1990), Sloan (Fukugita et al., 1996), and Gunn (Thuan & Gunn, 1976); two variations on Sloan : and ; and two narrow band Hα filters ( 6564/100, and 6584.65/17.5). We have found significant deviations from the canonical transmission curves for some of our broadband filters. We therefore measured the transmission curves of all of our broadband filters, and the results are shown in Figure 7. These measurements are also available in tabular form online at http://www.astro.caltech.edu/~ams/P60/filters.html.
4.2 Observatory Conditions
Observing conditions at Palomar are highly seasonally dependent. In the summer months, it is rare to lose an entire night due to weather. The average seeing at the P60 in the summer is ″ in -band. The winter months, however, are much worse. As an extreme example, the P60 was closed for 15 full nights in January 2005. Average seeing degrades to ″, and can at times be significantly worse. The seeing we experience at the P60 is often times slightly worse (by ″) than the values reported at the 200” Hale Telescope. We attribute this primarily to the difficultly we have encountered determining and maintaining an accurate focus value (see §4.3).
Sky backgrounds levels are generally good at Palomar, although they have increased somewhat over the last decade as the area has become more populated. In recent images at P60 with the new CCD we have found sky background levels of 19.9, 19.0, 18.8, and 17.7 mag per PSF (here approximated as a circular aperture of 1.5″diameter) in , , , and respectively. The three-sigma limiting magnitudes of our current system are 20.5 mag in , , and , and 19.8 mag in -band for an isolated point source in a one minute exposure. These results are summarized in Table 3.
The shortest recommended exposure time is set by the shutter mechanism. For exposures shorter than two seconds, the shutter speed becomes important and the true opening time (measured from a flat-field linearity curve) is not strictly repeatable. The longest recommend exposure is limited by the fact that we are not using a guider to assist in telescope tracking. This value is therefore dependent upon external conditions. In standard seeing of 1.5″, exposure lengths longer than 180 seconds begin to show image degradation. Under good seeing conditions of 1.0″, we have noticed degradation in images longer than 90 seconds. Users requiring deep images of a field will need to split up their observations into exposures of this length, and thereby sacrifice readout overhead.
4.3 Observatory Efficiency
The P60 currently devotes on average 50% of the time the dome is open for observations to science exposures. This value is quite variable, however, depending primarily on the number of different fields observed each night. An overview of the typical nightly efficiency is presented in Table 4. Please note the values presented are given in terms of the total time the dome is open, not the total available dark time. Additional factors such as weather can affect the overall efficiency significantly.
Besides required operations such as telescope slews, the primary constraint on our system efficiency comes from focusing. We have found the secondary mirror on the telescope to be unstable, particularly at higher elevations. Large telescope slews unpredictably alter the secondary mirror position, thereby taking the telescope out of focus. While engineering work to reinforce the structural support of the secondary in the Spring of 2006 has improved stability, we still conduct a focus loop every time we slew to a new target to maintain focus (this loop is disabled for rapid-response observations). As each individual focus loop takes 3 minutes, visiting a large number of fields each night can have a significant impact on our system efficiency.
| Sky Brightness | ||||
| mag per arcsec2 | 20.8 | 19.9 | 19.6 | 18.6 |
| mag per arcmin2 | 11.9 | 11.0 | 10.8 | 9.8 |
| mag per PSFaaWe approximate our PSF here as a circular aperture of diameter 1.5″. | 20.1 | 19.2 | 19.0 | 18.0 |
| Limiting Magnitude | 20.5 | 20.5 | 20.5 | 19.8 |
| Property | Time Spent |
|---|---|
| Science Exposures | 53% |
| Focusing | 12% |
| Readout Time | 8% |
| Photometric Standards | 4% |
| Scheduler Calculations | 1% |
| Otheraa“Other” includes all additional system components, such as telescope motion, changing filters, adjusting focus, and gathering status information. Because most of these operations are done in parallel, it is impossible to disentangle each individual contribution. | 23% |
| Total | 100% |
Additionally, our relative efficiency is lowered by 5% because the P60 is not equipped with a guider. As mentioned in §4.2, this puts an upper limit on suggested exposure times. In many cases we must use shorter exposures than would otherwise be optimal to minimize the fraction of time spent in CCD readout. We note, however, that real-time scheduling has no noticeable impact on efficiency, as the OSS spends less than 1% of the available time each night calculating which target to observe next.
4.4 Transient Response Time
The telescope response time to transient notices currently varies from 2–6 minutes. Our fastest response time was for GRB 050906, for which we began observations 101 s after receiving the trigger notice (114 s after the GRB; Fox et al. 2005a). Under the current system, observations of transient events do not begin until the previous observation has successfully completed. Even though most exposures are relatively short, this could take up to 5 minutes and explains why we have not met our stated response time goal in all cases. We are currently in the process of implementing an instantaneous interrupt capability, and aim to improve the response time to minutes by the end of Summer 2006.
5 Conclusions
In this paper we have presented our efforts to automate and roboticize the Palomar 60-inch telescope. As of September 2004, all components of the system operate in a fully automated fashion, making P60 one of the few robotic, medium-aperture facilities in the world. The P60 has been routinely responding to Swift GRB alters over the last year and a half, and will continue to do so over the lifetime of the Swift mission. The system is well-positioned for the plethora of optical transients that will be discovered in the upcoming years.
In addition to the current optical camera, we are planning several major upgrades to further improve the scientific capabilities of the system. In the near-term, our top priority is to add a near-infrared (NIR) camera to P60. We have already acquired the NIR detector from the out-of-use Cerro Tololo Infrared Imager (CIRIM666http://www.ctio.noao.edu/instruments/ir_instruments/cirim/cirim.html) and upgraded the controller electronics. We are currently working on both optical design and software development, with the hope of having both cameras mounted and functional in the next year. We also plan to make the P60 fully compliant with the Virtual Observatory Event Network (VOEventNet777http://voevent.net) protocol. In this manner the system can communicate with other observatories around the world without any needed human intervention.
As longer term projects, we are exploring the possibility of adding either a polarimeter or a multi-band camera to the facility. Regardless of the details, we are committed to making the P60 a scientifically productive facility in the years to come.
References
- Adamson et al. (2004) Adamson, A. J., Tilanus, R. P., Buckle, J., Davis, G. R., Economou, F., Jenness, T., and Delorey, K. 2004, in Ground-based Telescopes. Edited by Oschmann, Jacobus M., Jr. Proceedings of the SPIE, Volume 5493, pp. 24-32 (2004)., 24–32
- Akerlof et al. (1999) Akerlof, C. et al. 1999, Nature, 398, 400
- Bessell (1990) Bessell, M. S. 1990, PASP, 102, 1181
- Bloom et al. (2006) Bloom, J. S. et al. 2006, ApJ, 638, 354
- Bloom et al. (2005) Bloom, J. S., Starr, D. L., Blake, C. H., Skrutskie, M. F., and Falco, E. E. 2005, preprint (astro-ph/0511842)
- Chavan et al. (1998) Chavan, A. M., Giannone, G., Silva, D., Krueger, T., and Miller, G. 1998, in ASP Conf. Ser. 145: Astronomical Data Analysis Software and Systems VII, ed. R. Albrecht, R. N. Hook, & H. A. Bushouse, 255–+
- Eichler et al. (1989) Eichler, D., Livio, M., Piran, T., and Schramm, D. N. 1989, Nature, 340, 126
- Fox et al. (2005a) Fox, D. B., Cenko, S. B., and Schmidt, B. P. 2005a, GRB Coordinates Network, 3931, 1
- Fox et al. (2005b) Fox, D. B. et al. 2005b, Nature, 437, 845
- Fox & Moon (2004) Fox, D. B. and Moon, D.-S. 2004, GRB Circular Network, 2734, 1
- Fox et al. (2003a) Fox, D. W. et al. 2003a, ApJ, 586, L5
- Fox et al. (2003b) —. 2003b, Nature, 422, 284
- Fraser & Steele (2004) Fraser, S. and Steele, I. A. 2004, in Ground-based Telescopes. Edited by Oschmann, Jacobus M., Jr. Proceedings of the SPIE, Volume 5493, pp. 331-340 (2004)., ed. P. J. Quinn & A. Bridger, 331–340
- Fukugita et al. (1996) Fukugita, M., Ichikawa, T., Gunn, J. E., Doi, M., Shimasaku, K., and Schneider, D. P. 1996, AJ, 111, 1748
- Galama et al. (1998) Galama, T. J. et al. 1998, Nature, 395, 670
- Gehrels et al. (2004) Gehrels, N. et al. 2004, ApJ, 611, 1005
- Gehrels et al. (2005) —. 2005, Nature, 437, 851
- Genet & Hayes (1989) Genet, R. M. and Hayes, D. S. 1989, Robotic observatories. Remote-access. Personal-Computer astronomy (Mesa, Arizona: AutoScope Corp., 1989)
- Granzer et al. (2001) Granzer, T., Weber, M., and Strassmeier, K. G. 2001, Astronomische Nachrichten, 322, 295
- Hjorth et al. (2003) Hjorth, J. et al. 2003, Nature, 423, 847
- Hjorth et al. (2005) —. 2005, Nature, 437, 859
- Holland et al. (2003) Holland, S. T. et al. 2003, AJ, 125, 2291
- Honeycutt & Turner (1992) Honeycutt, R. K. and Turner, G. W. 1992, in ASP Conf. Ser. 34: Robotic Telescopes in the 1990s, ed. A. V. Filippenko, 77–+
- Honeycutt et al. (1990) Honeycutt, R. K., Vesper, D. N., White, J. C., Turner, G. W., and Adams, B. R. 1990, in CCDs in Astronomy. II. New Methods and Applications of CCD Technology, ed. A. G. D. Philip, D. S. Hayes, & S. J. Adelman, 177–+
- Hu et al. (2004) Hu, J. H., Lin, H. C., Huang, K. Y., Urata, Y., Ip, W. H., Tamagawa, T., and Fox, D. B. 2004, GRB Circular Network, 2744, 1
- Jørgensen et al. (2002) Jørgensen, P. S., Riis, T., Betto, M., and Pickles, A. 2002, in Astronomical Society of the Pacific Conference Series, 207–+
- Kaiser et al. (2002) Kaiser, N. et al. 2002, in Survey and Other Telescope Technologies and Discoveries. Edited by Tyson, J. Anthony; Wolff, Sidney. Proceedings of the SPIE, Volume 4836, pp. 154-164 (2002)., ed. J. A. Tyson & S. Wolff, 154–164
- Khamitov et al. (2004) Khamitov, I. et al. 2004, GRB Circular Network, 2752, 1
- Lamb & Reichart (2000) Lamb, D. Q. and Reichart, D. E. 2000, ApJ, 536, 1
- Leach & Low (2000) Leach, R. W. and Low, F. J. 2000, in Proc. SPIE Vol. 4008, p. 337-343, Optical and IR Telescope Instrumentation and Detectors, Masanori Iye; Alan F. Moorwood; Eds., 337–343
- Li et al. (2003) Li, W., Filippenko, A. V., Chornock, R., and Jha, S. 2003, ApJ, 586, L9
- Li et al. (2004) —. 2004, GRB Circular Network, 2748, 1
- Panaitescu & Kumar (2001) Panaitescu, A. and Kumar, P. 2001, ApJ, 554, 667
- Pandey et al. (2003) Pandey, S. B. et al. 2003, Bulletin of the Astronomical Society of India, 31, 19
- Perlmutter et al. (1999) Perlmutter, S. et al. 1999, ApJ, 517, 565
- Riess et al. (1998) Riess, A. G. et al. 1998, AJ, 116, 1009
- Rykoff et al. (2004) Rykoff, E. S. et al. 2004, ApJ, 601, 1013
- Sari & Piran (1999) Sari, R. and Piran, T. 1999, ApJ, 520, 641
- Sari et al. (1998) Sari, R., Piran, T., and Narayan, R. 1998, ApJ, 497, L17+
- Sasaki et al. (2000) Sasaki, T. et al. 2000, in Proc. SPIE Vol. 4009, p. 350-354, Advanced Telescope and Instrumentation Control Software, Hilton Lewis; Ed., ed. H. Lewis, 350–354
- Silvey et al. (2004) Silvey, J. et al. 2004, GRB Circular Network, 2833, 1
- Stanek et al. (2003) Stanek, K. Z. et al. 2003, ApJ, 591, L17
- Steele & Carter (1997) Steele, I. A. and Carter, D. 1997, in Proc. SPIE Vol. 3112, p. 222-233, Telescope Control Systems II, Hilton Lewis; Ed., ed. H. Lewis, 222–233
- Thuan & Gunn (1976) Thuan, T. X. and Gunn, J. E. 1976, PASP, 88, 543
- Tyson (2005) Tyson, A. 2005, in ASP Conf. Ser. 339: Observing Dark Energy, ed. S. C. Wolff & T. R. Lauer, 95–+
- Wilson et al. (2003) Wilson, J. C. et al. 2003, in Instrument Design and Performance for Optical/Infrared Ground-based Telescopes. Edited by Iye, Masanori; Moorwood, Alan F. M. Proceedings of the SPIE, Volume 4841, pp. 451-458 (2003)., 451–458