XMM-NEWTON Detection of X-ray Emission from the Compact Steep Spectrum Radio Galaxy 3C 303.1
Abstract
Using XMM we detect faint unresolved X-ray emission from the Compact Steep Spectrum radio galaxy 3C 303.1. We detect a thermal component at keV which seems likely to be produced in the ISM of the host galaxy. There is evidence for a second component in the spectrum whose nature is currently ambiguous. Plausible hypotheses for the second component include (1) hot gas shocked by the expansion of the radio source, and (2) Synchrotron self-Compton emission from the southern radio lobe if the magnetic field is below the equipartition value by a factor of .
1 INTRODUCTION
The progenitors of the large-scale powerful classical double (3CR FRII) sources seem likely to be the GHz Peaked Spectrum (GPS) and Compact Steep Spectrum (CSS) radio sources (e.g., O’Dea, Baum, & Stanghellini 1991; Fanti et al. 1990; Fanti et al. 1995; Readhead et al. 1996a,b; O’Dea & Baum 1997, for a review see O’Dea 1998). The GPS and CSS sources have generally simple and convex radio spectra with peaks near 1 GHz and 100 MHz, respectively.
Models for the evolution of powerful radio galaxies (Fanti et al. 1995; Begelman 1996; Readhead et al. 1996b; O’Dea & Baum 1997; De Young 1997; Kaiser & Alexander 1997; Kaiser, Dennett-Thorpe, & Alexander 1997; O’Dea & Baum 1997; Blundell, Rawlings & Willott 1999; and cf Snellen et al. 2000) are generally consistent with a scenario in which these sources propagate from the pc to Mpc scales at roughly constant velocity through an ambient medium which declines in density while the sources decline in radio luminosity.
There is increasing evidence that the GPS and CSS sources interact with the host galaxy as they propagate through it. Broad- and narrow-band HST imaging of CSS radio sources (De Vries et al. 1997, 1999; Axon et al. 2000) have shown that CSS radio galaxies at all redshifts exhibit emission-line gas which is strongly aligned with the radio source. The alignment is much stronger than seen in low redshift large-scale radio galaxies and is similar to that seen in high redshift () radio galaxies. The close association between the gas and the radio source suggests that the latter interacts strongly with the ambient medium as it propagates through the ISM.
In 3C 303.1 cooling time arguments (e.g., Pedlar, Dyson, & Unger 1985; Taylor, Dyson, & Axon 1992) applied to the gap between the radio hot spots and the onset of bright emission-line gas are consistent with lobe expansion velocities km s-1 for ambient densities of cm-3 (De Vries et al. 1999). The broad and highly structured spatially integrated [OIII] line widths observed by Gelderman & Whittle (1994) strongly suggest that the radio source is dominating the emission-line kinematics. HST/STIS long-slit medium-dispersion spectroscopy of the aligned emission-line gas has shown that the kinematics of the gas are consistent with cloud motions driven by interaction with the expanding radio source (O’Dea et al. 2002). Constraints on the bow shock velocity from lifetime and cooling arguments are in the range few km s-1 to few km s-1 (O’Dea et al. 2002). Analysis of the low dispersion STIS spectra reveals that the ionization diagnostics are consistent with strong contributions from shocked gas (Labiano et al. 2005). HST UV imaging shows a clear detection of UV continuum light tightly aligned with the radio source (Labiano et al. 2006). These observations are all consistent with the radio source in 3C 303.1 interacting with gas clouds in its environment, shocking them and triggering star formation.
The interaction of the radio source with its environment may also produce observable signatures in the X-ray. Heinz, Reynolds & Begelman (1998) suggested that compact evolving radio galaxies might create shells of hot shocked gas as they expand into the ambient medium. X-ray observations have found examples of both hotter (e.g., Kraft et al. 2003; Wilson, Smith & Young 2006) and cooler (e.g., Nulsen et al. 2005; Soker, Blanton & Sarazin 2002; Blanton et al. 2001) shells of ambient gas swept up by expanding radio galaxies.
In this paper we present XMM-Newton X-ray observations of the CSS radio galaxy 3C 303.1. We discuss the results and their implications for our understanding of CSS radio sources.
2 THE XMM OBSERVATIONS AND RESULTS
The properties of the source are given in Table 1. We observed 3C 303.1 with XMM-Newton for about 40 ks on August, 18, 2003. Three EPIC cameras, MOS-1, MOS-2 and pn, were operated with medium optical blocking filters in “Prime Full Window” mode, which covers the full field-of-view (FOV) of 30’ diameter. Because a fraction of the flux collected by the telescopes hosting the MOS cameras is directed to dispersing grating arrays, the photons collected by each MOS camera are fewer than those collected by the pn camera.
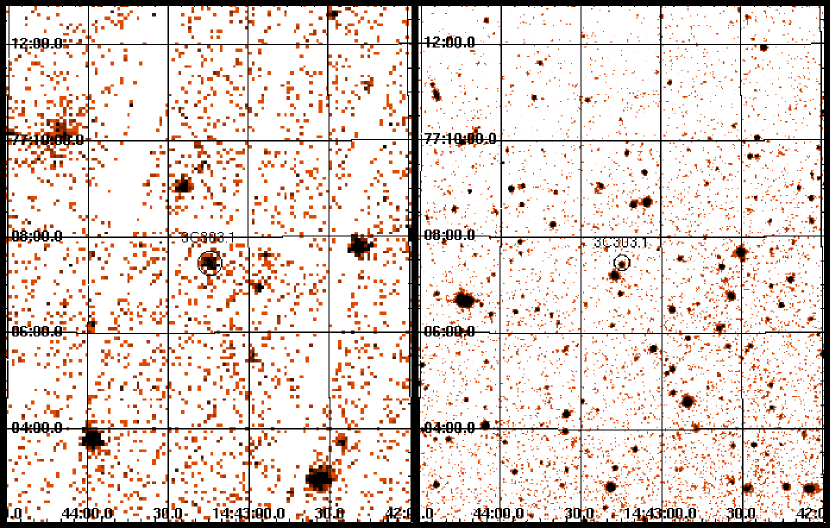
The data were reprocessed using the XMM-Newton Science Analysis System (SAS) v6.1.0. EMCHAIN and EPCHAIN were employed to obtain the photon event lists. Then we used EVSELECT to select single, double, triple and quadruple (PATTERN ) for MOS, and single and double events (PATTERN ) for pn with the energy range from 0.2 keV to 12 keV. FLAG was set to zero to reject the events which are close to the CCD gap and bad pixels. Because of the high EPIC background due to contamination by solar protons we restricted the data using Good Time Interval (GTI) filters. Details of the resultant exposure times and count rates in the three cameras are given in Table 2. The pn image, showing the detection of a faint source at the location of 3C 303.1 is given in the left-hand panel of Figure 1.
2.1 Source Size
The radial profiles of the source counts are consistent with the X-ray source being unresolved by the pn and MOS detectors. This is consistent with the emission being produced by the radio source (1.7 arcsec) and/or the host galaxy (20 kpc = 4.9 arcsec). Galaxy counts by Harvanek et al. (2001) show no evidence for a cluster of galaxies surrounding 3C 303.1.
2.2 Spectral Fitting
We chose an on-source extraction circle of 40 arc-second radius, which at 1.5 keV corresponds to encircled energy for the MOS and encircled energy for the pn. The MOS local background region was an annulus surrounding 3C 303.1 with inner and outer radii of 40 and 80 arcsec, respectively, with two unrelated sources masked. For the pn the background region was a circle the same size as the on-source region but from a source-free region of the same RAWY. For each camera the task ESPECGET was employed to generate a background-subtracted spectrum, grouped with 25 counts minimum per spectral bin to improve the statistics, a Redistribution Matrix File (RMF), and an Auxiliary Response File (ARF). Data above 8 keV and below 0.4 keV were excluded from the spectral model fitting due to the poor statistics at these energies. The resulting count rates are given in Table 2.
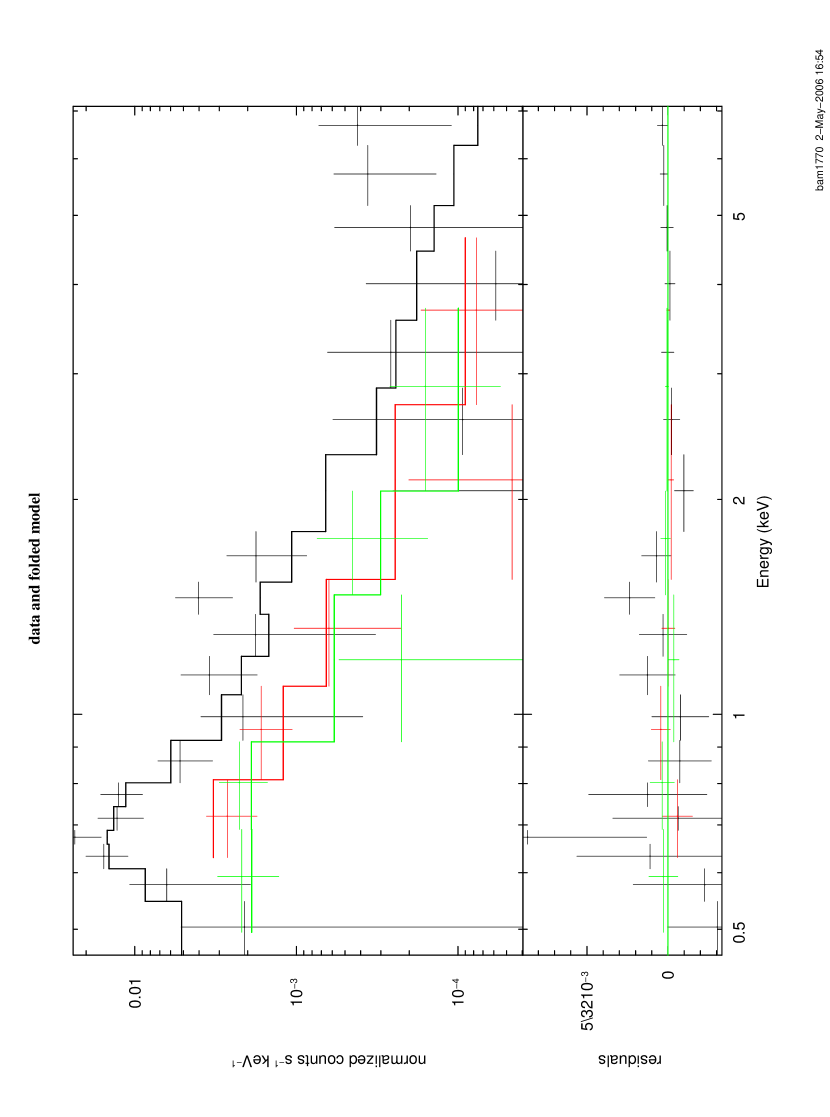
We fitted the pn and MOS spectra simultaneously with several models consisting of different combinations of absorption with power law (PL) and Raymond-Smith (RS) thermal models using XSPEC 12.2.0cf. The results are given in Tables 3–5. We obtain an acceptable fit for a RS model with Galactic absorption (frozen), solar abundance (frozen), and a temperature of kT keV (Table 3). We do not obtain an acceptable fit with a single PL model with either Galactic absorption alone or excess intrinsic absorption. Our single RS fit improves if we add a PL component (Table 4), though the photon index is very poorly constrained by our data. Assuming a plausible photon index, e.g., , there is no need for absorption in excess of Galactic towards the PL component. In order to constrain a possible hot component due to gas shocked by the radio source (§3.2) we considered a two temperature model with and keV (Table 5). Such a model is also an improvement over a single temperature thermal model. Figure 2 shows the spectral data together with the model components of Table 4 folded through the detector response files.
3 DISCUSSION
3.1 The Thermal Component
The luminosity ( ergs s-1) and temperature (kT keV) of the RS component are consistent with the values found in elliptical galaxies hosting radio sources (e.g., Worrall & Birkinshaw 2000) and possibly small groups (e.g., Helsdon & Ponman 2000). However, the X-ray emission is both too faint and too cool to be consistent with a cluster of galaxies (e.g., Arnaud & Evrard 1999). This suggests that we have detected the ISM of the host galaxy or possibly the intragroup medium (if there is a galaxy group).
3.2 Constraints on shock heated gas
The expanding radio source will run over and shock the ambient gas possibly producing detectable emission (e.g., Heinz et al. 1998). We calculate the expected properties of the shocked gas following Worrall et al. (2005). The sound speed in the 0.8 keV ISM is km s-1. If the propagation velocity of the radio source is as high as 6000 km s-1 as suggested by the cooling-time arguments for the emission line nebula (De Vries et al. 1999), the Mach number is M . For such a strong shock the Rankine-Hugoniot conditions give a temperature ratio between shocked and pre-shocked gas of , which implies keV. We note that a two-temperature model with and keV is permitted by the data (Table 5).
Taking into account the uncertainties, Table 5 shows that the normalizations of the heated (shocked) to cool (unshocked) gas is a factor of roughly 0.9 to 6. The 1-keV normalization is proportional to , where is the number density of electrons or protons and is the volume. Since the Rankine-Hugoniot conditions for a strong shock give , the X-ray spectral results are consistent with to 18. What is the volume of the shocked gas? We detect radio emission from the cocoon but not from the hot shocked gas which lies between the cocoon and the bow shock. We use the numerical simulations of Carvalho & O’Dea (2002) as a guide to estimate the ratio of the volumes of hot shocked gas and cocoon. The estimated ratio is model dependent and varies with the jet density contrast and Mach number. For a light, supersonic jet the numerical simulations suggest a value of about 3 for the ratio of hot shocked gas to cocoon volume. Adopting a value of 3 along with the estimates of cocoon volume from the MERLIN observations gives a volume of shocked gas of about 14 kpc3. We find the volume of unshocked gas is large enough to be consistent with a realistic galaxy atmosphere if is towards the upper value permitted by the X-ray spectral fitting. For example, if is 18, a spherical galaxy of uniform density would be required to have a radius of about 4 kpc. Such a galaxy has a similar to one of the same central density modeled with a model of and core radius of kpc. Chandra measurements of the atmospheres around relatively powerful nearby radio galaxies are fitted to models that typically bracket these parameter values (e.g., Kraft et al. 2005, Worrall & Birkinshaw 2005). High-resolution X-ray imaging spectroscopy would probe the density and temperature structure and should confirm whether such a high-temperature component exists.
3.3 The Power-Law Component
Here we consider the possibility that there is a significant non-thermal power-law component, i.e., the second component in the fit to the spectrum is not due to a hot shocked gas. The lack of a high intrinsic absorbing column towards the PL component suggests that it is not from accretion-disk emission that would be expected to be obscured in this powerful two-sided radio galaxy, and the fact that the nucleus is undetected both at 1.6 GHz (Sanghera et al. 1995) and at 5.0 GHz (Lüdke et al. 1998) disfavors the X-ray emission originating from a small-scale jet. X-ray binaries produce emission that can mimic a hard power law, but the luminosity of ergs s-1 is one or two orders of magnitude more than is typically measured in elliptical galaxies (e.g., Kim & Fabbiano 2004).
The most likely explanation for a power-law component would appear to be inverse Compton emission from the lobes of the radio galaxy. We estimate the expected flux (e.g., Harris & Grindlay 1979; Harris & Krawczynski 2002; Hardcastle, Birkinshaw & Worrall 1998) using the MERLIN radio measurements of Sanghera et al. (1995), where at 1.6 GHz the Southern lobe contains about 90% of the total radio flux density. We find that, because of the small size of the lobes, Synchrotron self-Compton (SSC) dominates the X-ray yield from scattering of the cosmic microwave background radiation.
Results of the SSC calculations are presented in Table 6. In these calculations we adopt a single-component power-law electron spectrum of slope consistent with the observed radio synchrotron spectrum (Sanghera et al.). In order to maximize the SSC output under the equipartition assumptions, we set the minimum electron energy to no lower than is required to produce the radio emission, and we assume no non-radiating particles (protons) are present. If the magnetic field is at the equipartition strength, the predicted SSC X-ray flux is too low by factors of in the Northern lobe and in the Southern lobe. However, if the field is below the equipartition level by factors of and , in the N and S lobes, respectively, the predicted flux is comparable to that in the measured PL component. There is some evidence that the magnetic fields in some radio lobes are indeed about 1/3 of the equipartition strength (e.g., Carilli, Perley & Harris 1994; Wellman, Daly & Wan 1997; Croston et al. 2005), and thus there is additional justification for the PL component arising from SSC emission primarily in the S lobe of 3C 303.1, with a magnetic field about 1/3 of the equipartition value. If this is the correct interpretation it suggests that the mechanism for keeping the average B field below equipartition occurs in young radio galaxies and is not just a feature of large FRIIs.
3.4 Comparison with other Radio Galaxies
There are now X-ray observations of a dozen GPS radio galaxies (O’Dea et al. 1996, 2000; Iwasawa et al. 1999; Guainazzi et al. 2004, 2006; Vink et al. 2006). 4C+55.16 appears to be in a cluster with a cooling flow (Iwasawa et al. 1999). The others are dominated by a power-law component with intrinsic absorption of to cm-2 (Guainazzi et al. 2006; Vink et al. 2006). This intrinsic absorption is larger than the HI absorption along the line of sight to the radio emission in the small number of cases where the radio measurements have been made (Vink et al.), thus suggesting that the absorbed X-ray emission arises from the vicinity of an accretion disk.
Large narrow-emission-line FRII radio galaxies generally have two nuclear X-ray components (Belsole et al. 2006). One has intrinsic absorption similar to that measured for most GPS sources, and is interpreted as accretion related, and the other is unabsorbed and identified as arising from jet emission within the radio core. Our X-ray measurements of the CSS radio galaxy 3C 303.1 find no evidence for absorbed emission – it is either absent or very weak. If absent, it may suggest that the central engine of 3C 303.1 is more similar to that of an FRI radio galaxy, where absorbed X-ray components are rarely seen (Evans et al. 2006 – but note the cases of Cen A [Evans et al. 2004] and NGC 4261 [Zezas et al. 2005]). The radio core of 3C 303.1 is undetected, and if the second X-ray spectral component is indeed non-thermal, then it is much more plausibly associated with the radio lobes than with the radio core. The alternative hypothesis is that we are seeing shocked gas. In either case this hard emission should be spatially resolved in Chandra observations. It appears that the weak core of 3C 303.1 is an advantage in allowing other X-ray components to be seen more clearly.
4 SUMMARY
Using XMM we detect faint unresolved X-ray emission from the CSS radio galaxy 3C 303.1. We detect a thermal component at kT keV which seems likely to be produced in the ISM of the host galaxy. There is evidence for a second component in the spectrum whose nature is currently ambiguous. It does not appear to be related to the core, giving 3C 303.1 the advantage over other GPS/CSS radio galaxies that extended components show up more clearly. Plausible hypotheses include (1) hot gas shocked by the expansion of the radio source, and (2) SSC emission from the southern radio lobe if the magnetic field is below the equipartition value by a factor of about 3.5. In the former case this would be the first detection of strongly shocked gas around an FRII radio source. In the latter case it would be a rare instance of the detection of SSC emission from a radio lobe, as distinct from a small localized hot spot. Deep Chandra observations could confirm the presence of this extended component and improve our understanding of its origin.
References
- (1)
- (2) Arnaud, M., & Evrard, A. E., 1999, MNRAS, 305, 631
- (3)
- (4) Axon, D. J., Capetti, A., Fanti, R., Morganti, R., Robinson, A., & Spencer, R., 2000, AJ, 120, 2284
- (5)
- (6) Begelman, M.C. 1996, in: “Cygnus A – Study of a Radio Galaxy”, eds. C. Carilli and D. Harris, (Cambridge: Cambridge University Press), p. 209
- (7)
- (8) Belsole, E., Worrall, D. M., & Hardcastle, M. J., 2006, MNRAS, 366, 339,
- (9)
- (10) Blanton, E. L., Sarazin, D. L., McNamara, B. R., Wise, M., 2001, ApJ, 558, L15
- (11)
- (12) Blundell, K. M., Rawklings, S., & Willott, C. J., 1999, AJ, 117, 677
- (13)
- (14) Carilli, C. L., Perley, R. A., & Harris, D. E. 1994, MNRAS, 270, 173
- (15)
- (16) Carvalho, J. & O’Dea, C. P., 2002, ApJS, 141, 337
- (17)
- (18) Croston, J. H., Hardcastle, M. J., Harris, D. E., Belsole, E., Birkinshaw, M., & Worrall, D. M., 2005, ApJ, 626, 733
- (19)
- (20) de Vries, W. H., O’Dea, C. P., Baum, S. A., Sparks, W. B., Biretta, J., de Koff, S., Golombek, D., Macchetto, F., McCarthy, P., & Miley, G. K., 1997, ApJS, 110, 191
- (21)
- (22) de Vries, W. H., O’Dea, C. P., Baum, S. A., & Barthel, P. D., 1999, ApJ, 526, 27
- (23)
- (24) De Young, D. S., 1997, ApJ, 490, L55
- (25)
- (26) Evans, D.A., Kraft, R.P., Worrall, D.M., Hardcastle, M.J., Jones, C., Forman, W.R., Murray, S.S., 2004, ApJ, 612, 786
- (27)
- (28) Evans, D.A., Worrall, D.M., Hardcastle, M.J., Kraft, R.P., Birkinshaw, M., 2006, ApJ, 642, 96
- (29)
- (30) Fanti, R., Fanti, C., Schilizzi, R. T., Spencer, R. E., Rendong, N., Parma, P., van Breugel, W. J. M., & Venturi, T. 1990, A&A, 231, 333
- (31)
- (32) Fanti, C., Fanti, R., Dallacasa, D., Schilizzi, R. T., Spencer, R. E., & Stanghellini, C., 1995, A&A, 302, 317
- (33)
- (34) Gelderman, R. & Whittle, M., 1994, ApJS, 91, 491
- (35)
- (36) Guainazzi, M., Siemiginowska, A., Rodriguez-Pascual, P., & Stanghellini, C., 2004, A&A, 421, 461
- (37)
- (38) Guainazzi, M., Siemiginowska, A., Stanghellini, C., Grandi, P., Piconcelli, E., Azubike Ugwoke, C., 2006, A&A, 446, 87
- (39)
- (40) Hardcastle, M. J., Birkinshaw, M., & Worrall, D. M., 1998, MNRAS, 294, 615
- (41)
- (42) Harris, D. E., & Grindlay, J. E., 1979, MNRAS, 188, 125
- (43)
- (44) Harris, D. E., & Krawczynski, H., 2002, ApJ, 565, 244
- (45)
- (46) Harvanek, M., Ellingson, E., Stocke, J. T., & Rhee, G., 2001, AJ, 122, 2874
- (47)
- (48) Heinz, S., Reynolds, C. S., & Begelman, M. C., 1998, ApJ, 501, 126
- (49)
- (50) Helsdon, S. F. & Ponman, T. J., 2000, MNRAS, 315, 356
- (51)
- (52) Iwasawa, K., Allen, S. W., Fabian, A. C., Edge, A. C., & Etori, S., 1999, MNRAS, 306, 467
- (53)
- (54) Kaiser, C. R., & Alexander, P., 1997, MNRAS, 286, 215
- (55)
- (56) Kaiser, C. R., Dennett-Thorpe, J., & Alexander, P., 1997, MNRAS, 292, 723
- (57)
- (58) Kim, D.-W., Fabbiano, G., 2004, ApJ., 611, 846
- (59)
- (60) Kraft, R. P., V zquez, S. E., Forman, W. R., Jones, C., Murray, S. S., Hardcastle, M. J., Worrall, D. M., & Churazov, E. 2003, ApJ, 592, 129
- (61)
- (62) Kraft, R.P., Hardcastle, M.J., Worrall, D.M., Murray, S.S., 2005, ApJ, 622, 149
- (63)
- (64) Labiano, A. et al., 2005, A&A, 436, 493
- (65)
- (66) Labiano, A. et al., 2006, in preparation
- (67)
- (68) Lüdke, E., Garrington, S. T., Spencer, R. E., Akujor, C. E., Muxlow, T. W. B., Sanghera, H. S., & Fanti, C., 1998, MNRAS, 299, 467
- (69)
- (70) Murgia, M., Fanti, C., Fanti, R., Gregorini, L., Klein, U., Mack, K.-H., Vigotti, M., 1999, A&A, 345, 769
- (71)
- (72) Nulsen, P. E. J., McNamara, B. R., Wise, M. W., David, L. P., 2005, ApJ, 628, 629
- (73)
- (74) O’Dea, C.P., Baum, S.A., & Stanghellini, C. 1991, ApJ, 380, 66
- (75)
- (76) O’Dea, C.P., Worrall, D. M., Baum, S.A., & Stanghellini, C., 1996, AJ, 111, 92
- (77)
- (78) O’Dea, C.P., & Baum, S.A., 1997, AJ, 113, 148
- (79)
- (80) O’Dea, C. P., 1998, PASP, 110, 493
- (81)
- (82) O’Dea, C.P., De Vries, W. H., Worrall, D. M., Baum, S.A., & Koekemoer, A., 2000, AJ, 119, 478
- (83)
- (84) O’Dea, C. P., et al., 2002, AJ, 123, 2333
- (85)
- (86) Pedlar, A., Dyson, J. E., & Unger, S. W., 1985, MNRAS, 214, 463
- (87)
- (88) Readhead, A. C. S., Taylor, G. B., Xu, W., Pearson, T. J., Wilkinson, P. N., & Polatidis, A. G., 1996a, ApJ, 460, 621
- (89)
- (90) Readhead, A. C. S., Taylor, G. B., Pearson, T. J., & Wilkinson, P. N., 1996b, ApJ, 460, 634
- (91)
- (92) Sanghera, H. S., Saikia, D. J., Lüdke, E., Spencer, R. E., Foulsham, P. A., Akujor, C. E., & Tzioumis, A. K., 1995, A&A, 295, 629
- (93)
- (94) Snellen, I. A. G., Schilizzi, R. T., Miley, G. K., de Bruyn, A. G., Bremer, M. N., & Röttgering, H. J. A., 2000, MNRAS, 319, 445
- (95)
- (96) Soker, N., Blanton, E. L., & Sarazin, C. L., 2002, ApJ, 573, 533
- (97)
- (98) Taylor, D., Dyson, J. E., & Axon, D. J., 1992, MNRAS, 255, 351
- (99)
- (100) Vink, J., Snellen, I., Mack, K.-H., & Schilizzi, R., 2006, MNRAS, 367, 928
- (101)
- (102) Wellman, G. F., Daly, R. A., & Wan, L., 1997, ApJ, 480, 96
- (103)
- (104) Wilson, A. S., Smith, D. A., & Young, A. J., 2006, astro-ph/0603435
- (105)
- (106) Worrall, D. M. & Birkinshaw, M., 2000, ApJ, 530, 719
- (107)
- (108) Worrall, D.M., Birkinshaw, M., 2005, MNRAS, 360, 926
- (109)
- (110) Worrall, D. M., Kraft, R. P., Birkinshaw, M., Hardcastle, M. J., Forman, W. R., Jones, C., Murray, S. S., 2005, in Proceedings of X-Ray and Radio Connections (eds. L.O. Sjouwerman and K.K Dyer) Published electronically by NRAO, http://www.aoc.nrao.edu/events/xraydio
- (111)
- (112) Zezas, A., Birkinshaw, M., Worrall, D.M., Peters, A., Fabbiano, G., 2005, ApJ, 627, 711
- (113)
| Parameter | 3C 303.1 |
|---|---|
| ID | G |
| redshift | 0.267 |
| RA (J2000) | 14:43:14.8 |
| DEC | 77:07:28 |
| scale (kpc/arcsec) | 4.07 |
| radio power log10P5GHz (Watts Hz-1) | 26.53 |
| radio source total angular size (arcsec) | 1.7 |
| linear size (kpc) | 6.9 |
| integrated emission line flux F(OIII5007) ( ergs s-1 cm-2) | 28 |
| spectral age (yr) | |
| advance speed (v/c) | 0.07 |
Note. — We adopt the standard cosmology with km s-1 Mpc-1, , and . The integrated emission line flux is from Gelderman & Whittle (1994). The spectral age is estimated by fitting a continuous injection model to the integrated radio spectrum and is taken from Murgia et al. (1999). The advance speed is estimated using 2 v = linear size / spectral age.
| Parameter | pn | Mos1 | Mos2 |
|---|---|---|---|
| Net Exposure Time (ksec) | 25.93 | 32.13 | 32.67 |
| Net Count Rate (counts/s) | 8.15E-3 1.92E-3 | 2.15E-3 7.22E-4 | 1.62E-3 6.97E-4 |
| Total Counts | 628 | 218 | 191 |
| Total Counts 0.4-8 keV | 483 | 127 | 128 |
| Net Countsa 0.2-12 keV | 211 | 69 | 53 |
Note. — These numbers are after GTI filtering. Observation date is August, 18, 2003. a background subtracted.
| Parameter | Value |
|---|---|
| External Absorption ( cm-2) | 0.031a |
| Abundance | 1.0b |
| Temperature kT (keV) | |
| Luminosity 0.4-8.0 keV ( ergs s-1) | 2.4 |
| 1 keV normalization ( photons cm-2 sec-1 keV-1) | |
| Chi-squared | 24.63 |
| degrees of freedom | 27 |
Note. — A fit to wabs*raymond using the energy range 0.4 to 8.0 keV over 29 bins. aAbsorption is frozen at the foreground Galactic value. bAbundance is frozen at the solar value.
| Parameter | Value |
|---|---|
| External Absorption ( cm-2) | 0.031a |
| Abundance | 1.0b |
| Temperature kT (keV) | |
| Luminosity 0.4-8.0 keV ( ergs s-1) | 2.0 |
| 1 keV normalization ( photons cm-2 sec-1 keV-1) | |
| Absorption towards the PL ( cm-2) | |
| Photon index | 1.5c |
| 1 keV PL normalization ( photons cm-2 sec-1 keV-1) | |
| Luminosity 0.4-8.0 keV ( ergs s-1) | 2.2 |
| Chi-squared | 17.17 |
| degrees of freedom | 25 |
Note. — A fit to wabs*(raymond + zwabs*pow) using the energy range 0.4 to 8.0 keV over 29 bins. aAbsorption is frozen at the foreground Galactic value. bAbundance is frozen at the solar value. cThe power-law photon index is poorly constrained by our data, so we froze a value of . A value of produces similar results.
| Parameter | Value |
|---|---|
| External Absorption ( cm-2) | 0.031a |
| Abundance | 1.0b |
| Temperature kT (keV) | 0.8c |
| Luminosity 0.4-8.0 keV ( ergs s-1) | 1.7 |
| 1 keV normalization ( photons cm-2 sec-1 keV-1) | |
| Temperature kT (keV) | 45c |
| 1 keV normalization ( photons cm-2 sec-1 keV-1) | |
| Luminosity 0.4-8.0 keV ( ergs s-1) | 2.8 |
| Chi-squared | 18.77 |
| degrees of freedom | 27 |
Note. — A fit to wabs*(raymond + raymond) using the energy range 0.4 to 8.0 keV over 29 bins. aAbsorption is frozen at the foreground Galactic value. bAbundance is frozen at the solar value. cTemperature frozen at 0.8 and 45 keV.
| Parameter | N Lobe | S Lobe |
|---|---|---|
| Radio size (mas) | 440 x 200 | 180 x 80 |
| 1.6 GHz radio flux density (mJy) | 140 | 1435 |
| radio spectral index | 1.1 | 1.2 |
| minimum electron Lorentz factor | 1000 | 400 |
| Equipartition B field (milliGauss) | 0.17 | 0.7 |
| Predicted SSC X-ray 1 keV flux density (Jy) | ||
| B field correction factor | 0.06 | 0.29 |
Note. — The radio data are from 1.6 GHz MERLIN observations presented by Sanghera et al. (1995). The B field correction factor is the factor needed to reduce the B field so that the predicted SSC emission is consistent with the observed PL component.