Minimal Stereoscopic Analysis for Imaging Atmospheric Cherenkov Telescope Arrays
Abstract
The trajectory of a primary -ray detected with an array of at least four atmospheric Cherenkov imaging telescopes can be reconstructed from the shower image centroid positions and geometrical considerations independent of the primary energy. Using only the image centroid positions some cosmic-ray discrimination is also possible. This minimal approach opens the possibility of pushing the analysis threshold to lower values, close to the hardware threshold.
1 Introduction
The rapid development of ground-based high-energy astronomy during the last ten years weekes03 is closely associated with the success of the Atmospheric Cherenkov Imaging technique hillas96 developed with the Whipple Observatory 10m telescope weekes89 and elsewhere. Cosmic rays and -rays entering the atmosphere generate cascades of particles radiating Cherenkov light. At ground level, the Cherenkov light front extends over more than from the shower axis. Thus, a single imaging telescope achieves an effective collection area of more than . The shape of the image can be used to preferentially select -ray events over the much more frequent cosmic-ray events. Furthermore, the elongated image of a -ray shower points back to the source on the sky, providing information on its arrival direction.
Most of the present generation experiments (CANGAROO, HESS, MAGIC and VERITAS) consist of arrays of imaging telescopes. Following earlier pioneering studies krennrich98 ; chadwick96 , the power of the stereoscopic technique grindlay75 , was plainly illustrated with the HEGRA experiment kohnle96 ; pulhofer03 and more recently with the HESS experiment hinton04 which achieved unprecedented levels of -ray discrimination.
In these arrays, each telescope records an image of the same shower. For a -ray primary, the major axis of each image points back to the source so that superposing the images produces the source location on the sky. Furthermore, the position of the image around the source corresponds to the position of the shower around the line from the telescope to the source. Combining this information from two or more telescopes provides the position and orientation of the shower axis. In other words, each telescope can be associated with a plane that contains the shower axis and the telescope. As the shower axis is the line of intersection of the planes associated with each of the array telescopes, only two telescopes are required to extract this axis. Since accurate reconstruction is difficult or impossible when the impact point is closely aligned with the two telescopes, a minimum of three telescopes is preferable.
The stereoscopic technique described above requires that each image contains a sufficient number of pixels for the major axis to be clearly identified. However, this is generally not the case for events close to the detection threshold and for which some or even all of the images can consist of only a few pixels significantly above noise fluctuations. Only the image positions are then available for a reconstructive analysis. In this paper, we study the possibility of reconstructing -ray events using only the shower image centroid position from each telescope. Such a minimalist analysis might be particularly important for the lowest energy events. The next section describes the method and in the following section, we use Monte-Carlo simulations to present an illustration of the method. Finally, we discuss approaches for discriminating against cosmic-rays when the image positions are the only available significant information.
2 Stereoscopy with minimal imaging
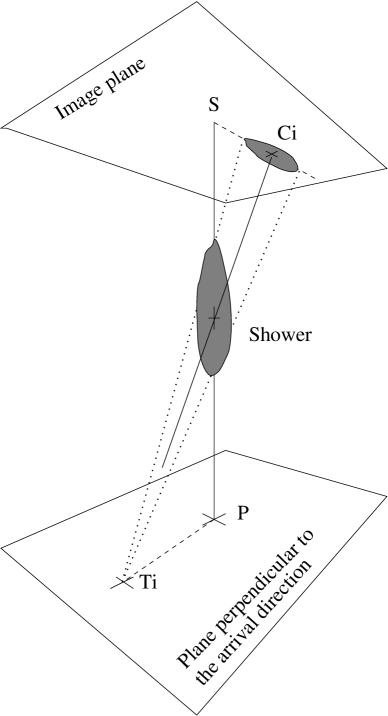
Consider a plane perpendicular to the shower axis. Let be the intersection point of the shower axis in this plane. Project the location of each telescope along the direction of the shower axis to the plane; label these points . Locate the source, , and the image centroid, , on the sky. We assume the image centroid to lie on the shower axis projected on the sky so that , , and S are coplanar as shown on figure 1. As a result the lines, and , are parallel. Expressing this result using convenient coordinate systems on the sky and in the plane perpendicular to the source direction yields:
| (1) |
where i ranges from 1 though the number of telescopes, N. Since there are four unknown quantities, N must generally be at least equal to four for the system to have a discrete number of solutions. A minimum of four telescopes is necessary for reconstructing the shower axis from the image centroids. In fact, the minimal telescope number could in principle be reduced to three or even two through the geometrical connection between the distance and the impact parameter to telescope . However, this relationship, by relying on the physics as well as the geometry of the atmospheric shower, depends on the primary energy and is more susceptible to fluctuations than our assumption that the image centroid lies on the shower axis image. We prefer not to use such a complicated relationship at this stage.
Because of the projection of the telescope locations onto the plane perpendicular to the primary direction, and depend on the primary arrival direction. However, we note that the field of view of atmospheric Cherenkov imaging telescopes remains relatively small, less than 2 or 3 degrees in radius. Thus, to a good approximation, we can perform the projection along the tracked direction instead of the arrival direction. For a typical array with distances between telescopes of the order of 100m, this approximation will affect the relative positions of the telescopes in the projection plane by much less than the physical size of the telescopes.
We can now directly use, for example, the first two equations in 1 to express and as functions of and . These expressions can then be substituted into the remaining equations. For more than four telescopes, the system is over-constrained. In the case of a four-telescope array, the system consists of two coupled quadratic equations in and with no apparent analytical solution. We thus use a numerical approach to find the source and impact point by minimizing the function:
| (2) |
.
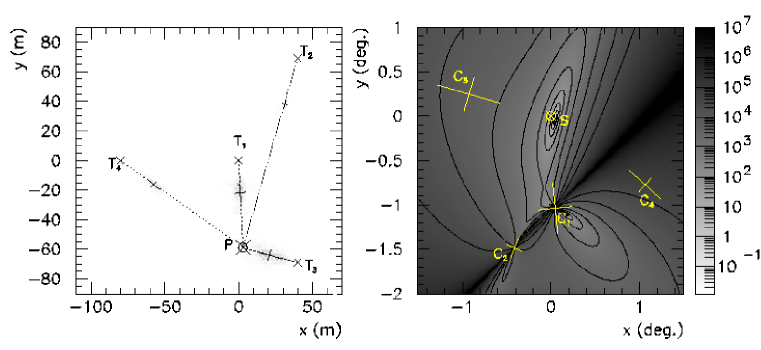
Since the equations for telescopes 1 and 2 are used to express and , the sum extends from up to , the total number of telescopes. This function reaches a minimum at the source position. In practice, by further manipulating the equations, the minimization becomes one-dimensional. For an array of more than four telescopes (), two approaches are possible: a full four-dimensional minimization or one-dimensional minimizations for all groups of three telescopes. In the latter case, the solution will depend on the specific order of equation choices in reducing the problem to a one-dimensional optimization. The solutions have to be combined into a single solution. Our examples only use this one-dimensional minimization with a four-telescope-array. Figure 2 illustrates the geometry and the function for a simulated vertical 500 GeV shower and a four-telescope array () arranged in a centered equilateral triangle. Because of the high primary energy, the major axes of the images precisely point toward the source position and impact point.
The function reaches a minimum near because the lines connecting to the various image centroids are approximately parallel to the lines connecting to the various telescopes. In the following section, we present the capabilities of this method for this array.
3 Example Application
3.1 Reconstruction capabilities
In the case of a four-telescope array, the function reaches zero in two points. On figure 2, one solution is close to the actual source position; the second solution is near . A fifth telescope could in principle select the proper solution, but we can also include additional, as yet unused, information. For example, each image centroid should lie on the the impact position side of the source point as indicated by the spatial position of the impact point with respect to the corresponding telescope. Unfortunately, this criterion does not always select only one of the two the solutions. As previously discussed, we have not incorporated the distance from the source to the image centroid. For -rays, this distance is approximately linearly correlated with the impact parameter . The slope of the relationship depends on the elevation and primary energy. Hence, we can require that the ratio, have approximately the same value for each telescope. In practice, when the first criterion does not select a unique solution, we compute the standard deviation of the four distance ratios for both solutions and retain the solution with the smallest standard deviation.
To test and illustrate this method, we used the GrISU simulation package grisu to simulate vertical 100-GeV rays with a VERITAS-like array of four 12m-telescopes. Each shower image is polluted by a typical level of night sky background. The individual telescope trigger conditions demanded that three channels coincidently exceed a threshold corresponding to four photoelectrons. All four telescopes must trigger to record an event. These are detailed Monte-Carlo simulations generated for a generic ACT array; hence, they do not include the level of specificity required to characterize a particular instrument.
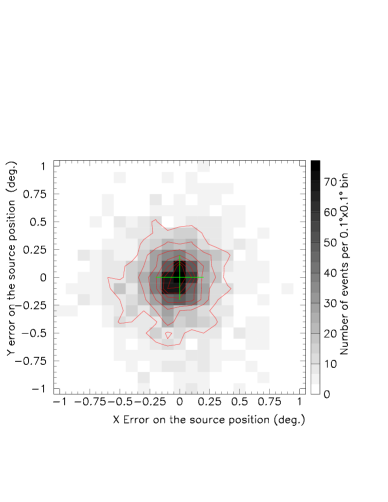
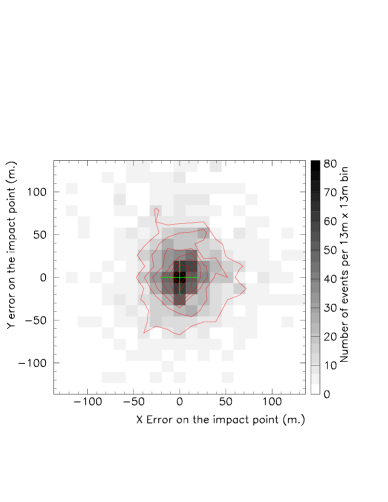
Figure 3 shows the error distribution of the source position and impact-point reconstruction. The standard deviation from the actual source position is and the standard deviation from the actual impact point is . This analysis only uses the image centroids. We realize that an analysis using the distribution of light in the image, when the image is sufficiently bright, might give more accurate results. However, it is important to note that no threshold nor cosmic-ray discrimination criteria have been applied yet.
3.2 Discrimination possibilities


In the case of point sources, the angular resolution provides an important factor of discrimination against cosmic-rays. Further discrimination is possible using only the image centroid locations and the image brightness. A more detailed image analysis would be more efficient at rejecting cosmic rays, especially the high energy ones. Here we just concentrate on the exercise of only using the centroid position information and total image brightness.
The ratio , described in the previous section can now be used as a discrimination tool against cosmic rays. As is often the case, different parts of a cosmic-ray shower are seen by different telescopes. Thus, the almost linear relationship between the and distances breaks down and the values will exhibit larger fluctuations between telescopes for a given cosmic ray shower. On the left panel of figure 4 we compare the distributions of the relative standard deviation, , of the values for simulated 100-GeV -rays and 100-GeV to 10-TeV protons. A cut on the parameter can preferentially select rays.
Additionally, we have not used the quantity of light in each image. The amount of Cherenkov light received by each telescope from a -ray shower should follow the well-known Cherenkov light-pool density profile hillas96 . For vertical showers the profile is relatively flat for impact parameters less than . On the contrary, cosmic rays produce Cherenkov light pools on the ground that are more patchy and irregular. On the right panel of Figure 4, we compare the distribution of the relative standard deviation of the quantity of light . Here again a cut on this parameter permits some discrimination against cosmic rays. As an example, selecting and preserves of our simulated rays while rejecting of the protons.
For an array of more than four telescopes (), the reconstruction process provides a method for rejecting cosmic rays. With the minimum of will generally not be zero. The value of the minimum will depend on how well the optimal source position and impact point account for the image centroid positions in all the N telescopes. Events for which the lines are not all precisely parallel to the lines, will have larger minimal values of . As each telescope collects Cherenkov light from different parts of the cosmic-ray showers, cutting on the minimized value of provides one more discrimination criterion.
4 Conclusion
By using only the image centroid positions from imaging atmospheric telescopes, the axis of -ray showers can be reconstructed for arrays of at least four telescopes. For a four-telescope array, we have verified that the analysis provides reasonable precision. Applied to events close to detector threshold, this method can provide a good starting point for more sophisticated and much more computation-demanding methods involving, for example, detailed models of the Cherenkov images lebohec ; deneroy03 .
We have identified criteria useful for discriminating against cosmic rays while still using only the first-order image parameters, the image centroids and brightnesses. These criteria could be combined with more sophisticated image analysis, such as producing a global image width from the light distribution across the line connecting the image centroid to the reconstructed source position.
Since the analysis presented here uses the minimal amount of information from the recorded Chenenkov images, the results must provide the lowest analysis energy threshold for a given experiment. This analysis, in comparison to analysis techniques using higher-order image parameters, could result in lower energy thresholds for modern air Cherenkov imaging telescope arrays. This technique could also be used in the design of future detectors and suggests that coarser pixels with perhaps smaller light collectors than in HESS and VERITAS could be cost saving and still produce accurate results in future very large arrays.
5 Acknowledgment
We thank Dirk Putzfeld for his help and we acknowledge support by the Department of Energy High Energy Physics Division.
References
- (1) Chadwick, P. M., et al., 1996, Space Science Rev., 75, 153
- (2) de Naurois, M. et al., Proc. 28th Int. Cosmic Ray Conf., Tsukuba (2003), Univ. Academy Press, Tokyo, p. 2907
- (3) Duke, C. & LeBohec, S., http://www.physics.utah.edu/gammaray/GrISU)
- (4) Grindlay, J.E., et al., 1975, ApJ 201, 82
- (5) Hillas, A. M., 1996, Space Science Rev., 75,17
- (6) Hinton, J. A., 2004, New Astronomy Rev., 48,331
- (7) Kohnle, A., et al., 1996, Astropart.Phys., 5,119
- (8) Krennrich, F., et al., 1998, Astropart.Phys., 8, 213
- (9) LeBohec, S., et al., 1998, Nucl.Instrum.Meth. A416, 425
- (10) Pulhofer, G., et al. 2003, Astropart.Phys., 20,267
- (11) Weekes, T.C. 2003, Very High-Energy Gamma Ray Astronomy, Series in Astronomy and Astrophysics, Ed. Institute of Physics Publishing
- (12) Weekes, T.C. 1989, ApJ, 342, 379