Thermonuclear (type-I) X-ray bursts observed by the Rossi X-ray Timing Explorer
Abstract
We have assembled a sample of 1187 thermonuclear (type-I) X-ray bursts from observations of 48 accreting neutron stars by the Rossi X-ray Timing Explorer, spanning more than ten years. The sample contains examples of two of the three theoretical ignition regimes (confirmed via comparisons with numerical models) and likely examples of the third. We present a detailed analysis of the variation of the burst profiles, energetics, recurrence times, presence of photospheric radius expansion, and presence of burst oscillations, as a function of accretion rate.
We estimated the distance for 35 sources exhibiting radius-expansion bursts, and found that in general the peak flux of such bursts varies typically by 13%, We classified sources into two main groups based on the burst properties: both long and short bursts (indicating mixed H/He accretion), and consistently short bursts (primarily He accretion), and calculated the mean burst rate as a function of accretion rate for the two groups. The decrease in burst rate observed at () is associated with a transition in the persistent spectral state and (as has been suggested previously) may be related to the increasing role of steady He-burning. We found many examples of bursts with recurrence times min, including burst triplets and even quadruplets.
We describe the oscillation amplitudes for 13 of the 16 burst oscillation sources, as well as the stages and properties of the bursts in which the oscillations are detected. The burst properties are correlated with the burst oscillation frequency; sources spinning at Hz generally have consistently short bursts, while the more rapidly-spinning systems have both long and short bursts. This correlation suggests either that shear-mediated mixing dominates the burst properties, or alternatively that the nature of the mass donor (and hence the evolutionary history) has an influence on the long-term spin evolution.
Subject headings:
stars: neutron — X-rays: bursts — nuclear reactions — stars: distances1. Introduction
Thermonuclear (type-I) X-ray bursts manifest as a sudden increase in the X-ray intensity of accreting neutron stars (NSs), to many times brighter than the persistent level. Typical bursts exhibit rise times of between and s, and last from tens to hundreds of seconds (Fig. 1). These events are caused by unstable burning of accreted H/He on the surface of neutron stars in low-mass X-ray binary (LMXB) systems (e.g. Strohmayer & Bildsten, 2006), in contrast to type-II bursts, which are thought to be caused by sudden accretion events (e.g. Lewin et al., 1993). The H/He fuel for type-I bursts is accreted from the binary companion and accumulates on the surface of the neutron star, forming a layer several meters thick. The accreted material is compressed and heated hydrostatically, and if the temperature is sufficiently high any hydrogen present burns steadily into helium via the “hot” (-limited) carbon-nitrogen-oxygen (CNO) process. After between 1 and several tens of hours, the temperature and density at the base of the layer become high enough that the fuel ignites, burning unstably and spreading rapidly to consume all the available fuel on the star in a matter of seconds. Such bursts have been observed to date from more than 70 sources (e.g. in ’t Zand et al., 2004c).
The burst X-ray spectrum is generally consistent with a blackbody of color temperature –3 keV. Time-resolved spectral fits give evidence for an initial rise in followed by a more gradual decrease following the burst peak, giving an approximately exponential decay in X-ray brightness back to the persistent level. This is naturally interpreted as heating resulting from the initial fuel ignition, followed by cooling of the ashes once the available fuel is exhausted. The primary evidence that the energy source for type-I bursts is thermonuclear comes from comparisons of the time-integrated persistent and burst flux. The ratio of the integrated persistent flux to the burst fluence is the standard measure of the relative efficiency of the two processes. Early in the study of type-I bursts it was determined that the energy derived from accretion was between 40 and a few hundred times greater than the energy liberated during the bursts. These values are comparable to those predicted assuming that the burst energy arises from nuclear burning.

Numerical models of unstable nuclear burning on the surface of a neutron star reproduce the observed rise times (seconds), durations (minutes), recurrence times (hours), and total energies of the bursts (– ergs; e.g. Fujimoto et al., 1981; Ayasli & Joss, 1982; Fushiki & Lamb, 1987; Fujimoto et al., 1987; Bildsten, 1998; Cumming & Bildsten, 2000; Narayan & Heyl, 2003; Woosley et al., 2004). The frequency, strength, and time scales of thermonuclear bursts all depend on the composition of the burning material, as well as the metallicity (here referring to the CNO mass fraction, ) of the matter accreted onto the neutron star; the amount of hydrogen burned between bursts; and the amount of fuel left-over from the previous burst. Variations from source to source are also expected because of differences in the core temperatures of the neutron stars and the average accretion rate onto the surface (Ayasli & Joss, 1982; Fushiki & Lamb, 1987; Narayan & Heyl, 2003).
The recently discovered class of extremely long-duration bursts or “super” bursts are also thought to arise from thermonuclear processes. The fuel for these bursts is probably carbon rather than H/He, giving distinctly different time scales, recurrence times and energetics Strohmayer & Brown (2002); Cumming (2004). However, the predicted temperatures in the fuel layer are too low to give carbon bursts with the observed fluences, suggesting that the cooling in the crust may be less efficient than previously thought Cumming et al. (2006). Superbursts have been detected from around 10% of the Galactic X-ray burst population, with recurrence times estimated at 1.5 yr in ’t Zand et al. (2004a), and tend to quench the regular type-I bursts for weeks–months afterwards. The connection with intermediate-duration ( min) events observed from a few systems is not clear in ’t Zand et al. (2004b).
1.1. Bursts as a Function of Accretion Rate
Theoretical ignition models for H- and He-burning thermonuclear bursts predict how burst properties in an individual system change as the accretion rate onto the neutron star varies (e.g., Fujimoto et al., 1981; Bildsten, 1998; Narayan & Heyl, 2003). Several regimes of thermonuclear igntion may be identified, depending upon the local accretion rate (111Following the usual convention, we refer to the accretion rate per unit area as , and the total accretion rate integrated over the neutron star as .), which is usually expressed as a fraction of the local Eddington rate ( , or averaged over the surface of a 10 km NS). However, the quantitative values of the accretion rates separating these regimes of burning are a matter of some debate, as we outline below, and summarize in Table 1.1.
At the lowest accretion rates (, referred to as case 3 by Fujimoto et al., 1981),222See, e..g, Bildsten (1998) for dependences of these critical accretion rates on the metallicities, and Narayan & Heyl (2003) for dependences on neutron star compactness. the temperature in the burning layer is too low for stable hydrogen burning; the hydrogen ignites unstably, in turn triggering helium burning, which produces a type I X-ray burst in a hydrogen-rich environment. At higher accretion rates (case 2; ), hydrogen burns stably into helium between bursts, leading to a growing pure helium layer at the base of the accreted material. The fuel layer heats steadily until He ignition occurs and the He burns via the triple- process. At these temperatures and pressures, helium burning is extremely unstable, and a rapid and intense helium burst follows. At yet higher accretion rates, hydrogen is accreted faster than it can be consumed by steady burning (limited by the rate of -decays in the CNO cycle), so that the helium ignites unstably in a H-rich environment (case 1; ). Finally, at the highest accretion rates, helium also begins to burn steadily between bursts. At just below 0.9 in Heger et al. 2007b; see also Narayan & Heyl 2003), an over-stability may arise that leads to oscillatory H and He burning, and in turn to intermittent bursts. Once the accretion rate exceeds (“case 0” in Fujimoto et al. 1981), stable helium burning depletes the fuel reserves and causes bursts to cease altogether.
Although the gross features of these regimes should be robust, several factors (some poorly-understood) could significantly change the accretion rates at which the bursting regimes occur. First, the burst behavior may be sensitive to certain individual thermonuclear reaction rates. One reaction that has drawn particular attention is the “break-out” reaction 15ONe, which removes a catalyst from the CNO cycle (e.g., Fisker et al., 2006). A low rate for this reaction causes more H burning to occur, which produces a hotter burning layer in which steady helium burning also occurs Cooper & Narayan (2006). As a result, unstable burning will cease altogether at 0.3, in contrast to predictions using higher rates Fujimoto et al. (1981); Bildsten (1998); Heger et al. (2007b) but in partial agreement with observations. Recent experimental measurements however favor the original, higher 15ONe rate (Fisker et al., 2007), and the reduction in the uncertainty means that this reaction cannot explain the cessation of bursts for most sources around 0.3.
Second, sedimentation or mixing in the burning layer could change the composition at the base of the burning layer. At low accretion rates (), CNO elements may settle to the bottom of the burning layer, which may prevent unstable H burning from inducing unstable He burning. Therefore, most case 3 bursts would be pure hydrogen. However, a large He layer would also build up that would eventually produce a very energetic burst (Peng et al., 2007), such as those seen from “burst-only” sources (Cornelisse et al., 2004). On the other hand, at high accretion rates (), turbulent mixing of accreted fuel into deeper layers could increase the amount of steady burning in between bursts (Piro & Bildsten, 2007).
Third, the accreted nuclear fuel may not be distributed evenly on the neutron star (e.g., Inogamov & Sunyaev, 1999; Bildsten, 2000; Popham & Sunyaev, 2001). If the material is deposited at the equator, a latitudinal gradient could develop in the amount of fuel burned steadily between bursts. Whether such inhomogeneous distribution of fuel will produce bursts that are confined to one hemisphere (Bhattacharyya & Strohmayer, 2006a), or ignite slowly-propagating fires that burn fuel over limited regions of the neutron star (e.g., Bildsten, 1995) is uncertain. The variation in the effective gravity between the equator and higher latitudes could also lead to different ignition regimes, depending upon the spin rate of the neutron star Cooper & Narayan (2007b). The spin rate may also affect the spreading via Coriolis forces, which may give rise to vortices that drift relative to the star as the burning spreads Spitkovsky et al. (2002).
Understanding these mechanisms is important, because current models for X-ray bursts have met with only partial success in explaining how their rates, energetics, and time scales vary with accretion rates. The basic predictions of Fujimoto et al. (1981; see also Cumming & Bildsten 2000) have found validation with the success of models in reproducing the energetics of case 3 mixed H/He bursts from EXO 0748–676 at an accretion rate of (Boirin et al., 2007), case 2 He bursts bursts from SAX J1808.4–3658 at an accretion rate of (Galloway & Cumming, 2006), and regularly-recurring case 1 mixed H/He bursts from GS 1826–24 at (Galloway et al., 2004b).
On the other hand, for several sources the burst rate decreases as the accretion rate increases. This decrease typically begins at , well below the rate at which He-burning is expected to stabilize. These sources include 4U 1636536 (Lewin et al., 1987) and 4U 170544 (Langmeier et al., 1987), as well as most of the sources in the sample assembled by Cornelisse et al. (2003). Furthermore, no correlation was found between persistent flux and burst recurrence times in Ser X-1 (Sztajno et al., 1983) or 4U 173544 (Lewin et al., 1980; van Paradijs et al., 1988b). These observations may be evidence for “delayed mixed bursts” (between cases 1 and 0; Narayan & Heyl, 2003), in which helium begins to burn between bursts (see also Bildsten, 1995; Heger et al., 2007b). A drop in burst frequency at comparable accretion rates has also been observed from 3A 1820303 (Clark et al., 1977), which, with it’s evolved donor, likely does not accrete any hydrogen. Alternatively, these observations may indicate that the accretion rate per unit area (which sets the burst ignition conditions) is decreasing even though the total accretion rate is increasing (e.g. Bildsten, 2000), or perhaps that the persistent fluxes are not a good measures of the accretion rates in these sources.
The change in the composition of the fuel layer as increases also affects the properties of the bursts. Helium burning occurs via the triple- process, which is moderated by the strong nuclear force and proceeds very quickly at the temperatures and densities of the burning layer. Hydrogen burning proceeds more slowly, because it is limited by -decays moderated by the weak force. Therefore, faster, more intense bursts characteristic of a helium-rich burning layer should occur at relatively low accretion rates (case 2), while hydrogen-rich bursts with slower rise and decay times should occur at higher rates (case 1). Surprisingly, most sources behave in the opposite manner. The decay time scales of bursts has been observed to decrease as the apparent increases from 0.01–0.1 for 4U 160852 (Murakami et al., 1980b), 4U 1636536 (Lewin et al., 1987), 4U 170544 (Langmeier et al., 1987), KS 1731260 (Muno et al., 2000), and in the sample of Cornelisse et al. (2003, which includes several of the above LMXBs). This discrepancy has been taken as evidence that steady helium burning is more prolific than expected at 0.3 (e.g. Narayan & Heyl, 2003; Cooper & Narayan, 2006). Some support for this hypothesis has been found in the appearance of low-frequency noise and mHz QPOs at these same accretion rates, that has been attributed to marginally unstable helium burning (Bildsten, 1995; Revnivtsev et al., 2001; Narayan & Heyl, 2003; Heger et al., 2007b).
| Burst | ||||
|---|---|---|---|---|
| Case | Steady Burning | Composition | Ref. | |
| 3/V | 0.01 | none | mixed H/He | [1,2] |
| 2/IV | 0.01 – 0.1 | stable H | pure He | [3,4] |
| 1/III | 0.1 – 1.0 | stable H | mixed H/He | [4,5,6] |
| -/II | 1.0 | over-stable H/He | mixed H/He? | [7,8] |
| 0/I | 1.0 | stable H/He | none | [9] |
Note. — The names for each of the burst cases are taken from (Fujimoto et al., 1981, Arabic numerals) and (Narayan & Heyl, 2003, Roman numerals). The ranges in accretion rate (; normalized to the Eddington rate) for each case are taken from Fujimoto et al. (1981); note that Narayan & Heyl (2003) predict lower rates for their cases II and I (). The references represent recent examples of calculations and/or comparisons to observations in each regime.

1.2. Bursts as Standard Candles
The peak flux for very bright bursts can reach the Eddington luminosity at the surface of the NS, at which point the (outward) radiation pressure equals (or exceeds) the gravitational force binding the outer layers of accreted material to the star. Such bursts frequently exhibit a characteristic spectral evolution in the first few seconds, with a local peak in blackbody radius and at the same time a dip in color temperature, while the flux remains approximately constant (Fig. 2). This pattern is thought to result from expansion of the X-ray emitting photosphere once the burst flux reaches the Eddington luminosity; the effective temperature must decrease in order to maintain the luminosity at the Eddington limit, and excess burst flux is converted into kinetic and gravitational potential energy in the expanded atmosphere.
The largest uncertainty in the theoretical Eddington luminosity arises from possible variations in the photospheric composition. The limiting flux for a composition with hydrogen present at solar mass fraction will be a factor of 1.7 below that of a pure helium atmosphere. Nevertheless, the Eddington luminosities measured for LMXBs with independently-known distances are generally consistent to within the uncertainties, at a value estimated as by Lewin et al. (1993), or, more recently, (cf. with equation 7; Kuulkers et al., 2003). This result is consistent with the narrow ranges for masses and surface redshifts expected for the neutron stars in these bursters. Consequently, these photospheric radius-expansion (PRE) bursts can be used as distance indicators Basinska et al. (1984). Time-resolved spectroscopy of radius-expansion bursts also allow in principle measurement of the surface gravitational redshift (e.g. Damen et al., 1990; Smale, 2001), although this has proved a considerable challenge (see e.g. Özel, 2006, for a more recent study).
1.3. A New Diagnostic of Nuclear Burning
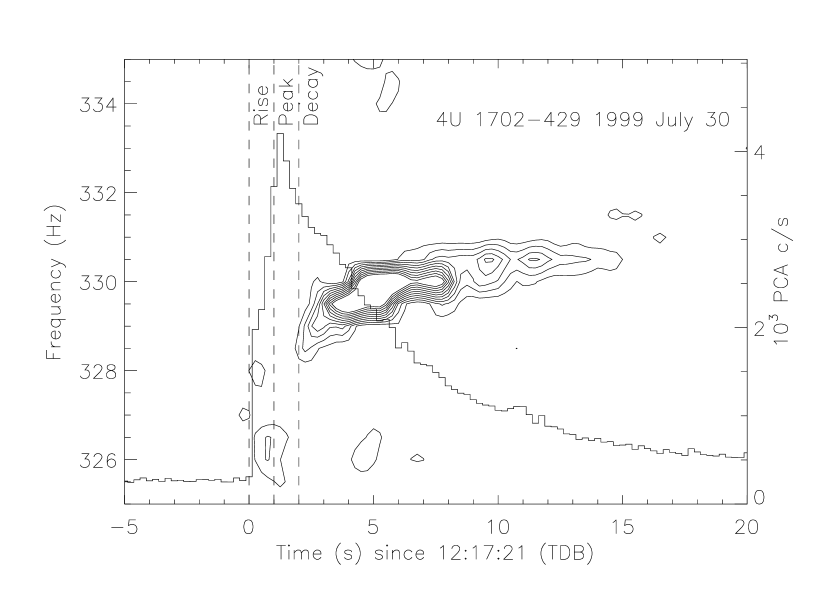
One of the key capabilities of RXTE is for high temporal resolution X-ray timing studies. Since 1996, this capability has led to the discovery of several distinct types of kHz variability in LMXBs (for a recent review, see Galloway, 2008). Highly coherent burst oscillations with fractional amplitudes in the range 5–20% rms have been detected in thermonuclear bursts from 16 sources to date (Strohmayer et al. 1996; see also Strohmayer & Bildsten 2006). As the burst evolves, these “nuclear-powered pulsations” typically increase in frequency by a few Hz, most approaching an asymptotic value which is stable for a given source from burst to burst (e.g. Fig. 3; Muno et al., 2002a). That the asymptotic frequency traces the NS spin has been confirmed by the detection of burst oscillations at the spin frequency in the millisecond pulsars SAX J1808.43658 Chakrabarty et al. (2003) and XTE J1814338 Strohmayer et al. (2003), as well as the prolonged oscillation detected during a superburst in 4U 1636536 Strohmayer & Markwardt (2002).
Substantial questions remain regarding the mechanism of burst oscillations, as well as what conditions determine whether or not the oscillations will be detectable in a given burst, or a given source. The oscillations have been suggested to result from initially localized nuclear burning, which spreads over the surface of the neutron star during the early stages of the burst Strohmayer et al. (1996). However, this explanation does not account for the oscillations which persist as long as 5–10 s after the burst rise. The frequency drift is likely too large to be explained by angular momentum conservation in a decoupled expanded burning layer Cumming et al. (2002), and may instead result from changes in the velocity of a pattern in the surface brightness. Slow-moving (in the rotating neutron star frame) anisotropies in the surface brightness may originate from hydrodynamic instabilities (Spitkovsky et al., 2002) or modes excited in the neutron star ocean (Cumming & Bildsten 2000; see also Heyl 2004; Piro & Bildsten 2005 and references therein). Recently, the phenomenology has become even more complex with the observation of intermittent persistent pulsations which appear to be in some cases related to the occurence of bursts Galloway et al. (2007); Altamirano et al. (2008) but in other cases not Casella et al. (2007).
1.4. The Need for a Global Study
It is generally unfeasible to to study the variation in burst properties over a wide range of accretion rate using data from a single source. Typically only a narrow range of accretion rates is observed, and insufficient exposure time is available, leading to only a small number of bursts in total. A few previous observational studies have focussed on the properties of bursts from more than one source. A compilation of 45 measurements in the literature from ten LMXBs by van Paradijs et al. (1988a) revealed a global decrease in burst duration with increasing persistent flux, similar to that seen individually for several sources. They also found that was correlated with the (normalized) persistent flux, more strongly than was predicted by numerical models (e.g. Fujimoto et al., 1981). The normalized fluence depended principally on the burst interval , which suggested that continuous stable burning between bursts is a general phenomenon. More recently, Cornelisse et al. (2003) analysed six years of BeppoSAX observations of 37 LMXBs, with a combined sample of 1823 bursts, and identified a transition between long, H-rich bursts (assumed to result from case 3 ignition) to short, pure He bursts (case 2), inferring the onset of steady H burning at a persistent luminosity of (equivalent to ), a factor of 10 higher than predicted by theory. Below this level, bursts were long, frequent and occurred quasi-periodically, typified by GS 182624 and KS 173126. Above the burst rate dropped by a factor of five, and the bursts were short and occurred irregularly (although short bursts were also observed in the low accretion rate regime). At even higher luminosities, bursts ceased altogether in these sources (although are subsequently observed at in two sources, GX 17+2 and Cyg X-2).
To date, the Rossi X-ray Timing Explorer (RXTE) has observed 66 of the known thermonuclear burster sources, and discovered several new ones. The RXTE data are unparalleled for studies of bursts and bursters, thanks to the large instrumental effective area and high timing resolution. New data enter the public archive continually, and published analyses rarely take advantage of all the available bursts in all the public observations, let alone all the bursts from all the known bursters. To date, no global comparisons of theory with these data have been made. The wealth of observational data motivate the present work, which seeks to present a uniform analysis of all thermonuclear bursts from the bursters observed by RXTE through 2007 June 3. By combining the bursts from different sources we achieve much larger burst numbers and a larger range of for global characterization of burst behaviour than is possible for any individual source. We also include information on the presence of burst oscillations, which is only available in the RXTE data. While RXTE has also observed several superbursts, we do not analyse these events in this paper.
We present the contents of the catalog, and the results of our studies, as follows. In §2 we describe the analysis methods and products, and relate to the physical properties of the bursts. We summarise the properties of the catalog in §3, and present our detailed analysis in the subsequent sections. In §3.1 we measure the mean peak flux of radius-expansion bursts, and determine the source distances. We analyse the properties of the individual bursts in §3.2, and explore the consistency of the burst behaviour of different sources as a function of accretion rate in §3.3. In §3.4 we combine the bursts from various sources in an attempt to quantify the global burst properties as a function of accretion rate and compare these properties to predictions from burst theory. We further discuss the global behaviour of the burst energetics in §3.5. We attempt to place observational limits on the boundaries of the theoretical ignition regimes in §3.6. We discuss the properties of the millisecond oscillations in §3.7. Finally, we present a number of outstanding theoretical challenges in §3.8, and summarise our results in §4. In appendix A we present the results for individual bursters on a case-by-case basis; we constrain the origin for bursts in crowded fields in appendix B.
2. Observations and analysis
Public data from RXTE observations of thermonuclear burst sources are available through the High-Energy Astrophysics Science Archive Research Center333http://heasarc.gsfc.nasa.gov (HEASARC), dating from shortly after the launch of the satellite on 1995 December 30. This paper includes all publicly available data through 2007 June 3. RXTE carries three instruments sensitive to X-ray photons. The All-Sky Monitor (ASM; Levine et al., 1996) consists of three scanning shadow cameras sensitive to photons between 1.5 and 12 keV with a total effective area of , which provide 90 s exposures of most points on the sky every 96 min. The High-Energy X-ray Timing Experiment (HEXTE; Gruber et al., 1996) is comprised of two clusters of NaI/CsI scintillation detectors sensitive to X-rays between 15 and 250 keV with a total effective area of . The Proportional Counter Array (PCA; Jahoda et al., 1996) consists of five identical, co-aligned proportional counter units (PCUs), sensitive to photons in the energy range 2–60 keV. The field-of-view of both the PCA and HEXTE is circular with radius . Photon counts from the PCA are processed independently by up to 6 Event Analyzers (EAs) in a variety of configurations. Two EAs are permanently set to two standard observing modes, Standard-1 (with 0.125 s time resolution but only one energy channel) and Standard-2 (16 s binned spectra on 129 energy channels between 2–60 keV). The remaining EAs may be configured by the observer to give time resolution down to and up to 256 spectral channels.
We extracted 1-s lightcurves covering the full 2–60 keV PCA energy range from Standard-1 mode data of all public observations covering known burst sources. The PCA field of view is approximately in radius, and the effective area drops off approximately linearly as a function of off-axis angle. Thus, we extended our lightcurves to offset pointings of up to , frequently including the end of the satellite’s slew to the source and the beginning of the slew away. We also searched observations of fields centered less than away from known burst sources. We searched each lightcurve for bursts as follows. For each observation we calculated the overall mean and standard deviation of the 1-s count rate measurements, and identified burst candidates in bins which exceeded the mean by more than . We then visually inspected the lightcurves to confirm or reject each candidate. Candidates were rejected if they were attributable to other events which can produce sharp jumps in the count rate, such as detector breakdowns, gamma-ray bursts, or particle events. For a few weak events, time-resolved spectral analysis (see below) failed to show significant cooling in the decay; for others, data modes with sufficient temporal and spectral evolution were not available to undertake spectral analysis at all. We include these events in the catalog, but they must be viewed as burst candidates, only.
2.1. Characterizing the persistent emission
In order to coarsely characterise the persistent spectrum, we computed hard and soft X-ray colors as the ratio of the background-subtracted detector counts in the (8.6–18.0)/(5.0–8.6) keV and the (3.6–5.0)/(2.2–3.6) keV energy bands, respectively. We used 64 s integrations to calculate the colors when the source intensity was above 100 counts s-1, and 256 s integrations otherwise. We corrected the measured count rates for gain changes over the life of the mission by normalizing count rates from the Crab Nebula in each PCU to constant values for each energy band (totaling 2440 counts s-1 PCU-1 in the 2.2–18.0 keV band) using linear trends. When this correction is applied, the hard and soft colors from the Crab Nebula have values of 0.679 and 1.358, with standard deviations of only 0.1% and 0.5% respectively.
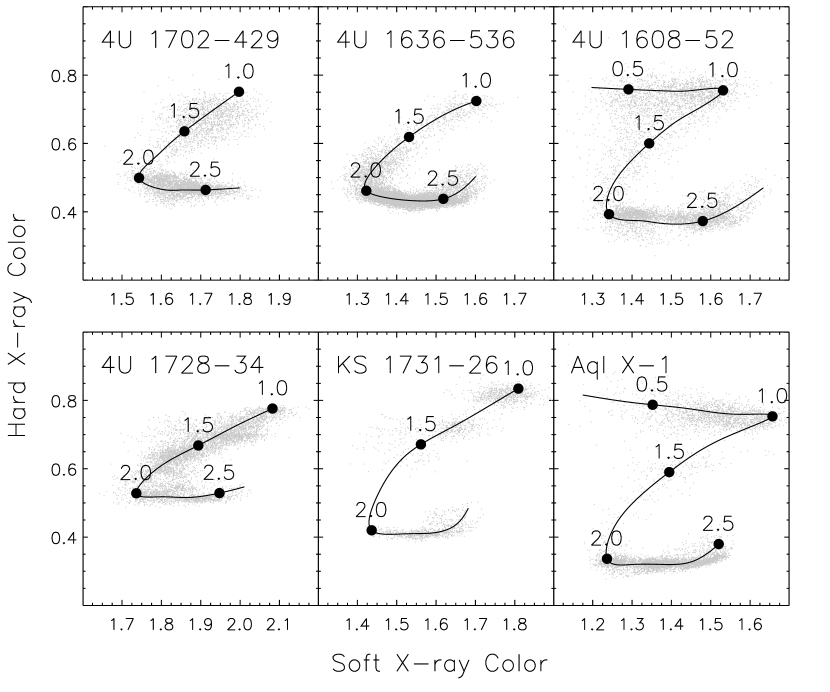
We show examples of the distribution of source colors (color-color diagrams) in Fig. 4. As onto the neutron star increases, a source moves from the top-left to the bottom-right, roughly tracing a Z-shaped pattern (Hasinger & van der Klis, 1989; Muno et al., 2002b; Gierliński & Done, 2002). Most bursting LMXBs are classified as “atoll” sources, and trace out their full Z-shaped pattern as they vary in intensity by a factor of (see Muno et al., 2002b, for a discussion). Nine atoll sources were observed on both the top and bottom portions of their color-color diagrams: 4U 160852, 4U 1636536, 4U 1702429, 4U 170544, 4U 172834, KS 1731260, 4U 174637, XTE J2123058 and Aql X-1. For those sources, we parameterized the position on the diagram by defining a curve that followed the middle of the Z-shaped track (Fig. 4; Dieters & van der Klis, 2000). We first selected several points to define the basic shape of the curve. From these points, we defined a smooth curve using a spline interpolation. We then assigned to the upper-right vertex of the Z-shape and to the lower-right vertex, and defined the unit arc-length as the distance along the curve between these two points. The value of for any given point on the color-color diagram by finding the nearest point on the curve, and finding the value of the arc-length there. We then defined the mean value from the mean colors for each observation of the sources listed above. Although is thought to be proportional to (e.g. Vrtilek et al., 1990), the absolute calibration is not well determined.
We also estimated the persistent source flux at the time of the bursts from spectra extracted from Standard-2 mode data, separately for each PCU within each observation (excluding a typically s interval covering each burst). We fit these spectra over the range 2.5–25 keV with an empirical model consisting of blackbody and power law components, each attenuated by neutral absorption with solar abundances. For many of the spectra, residuals were present around 6.4 keV which we interpreted as fluorescent Fe emission, and where these residuals resulted in a reduced- we added a Gaussian component to improve the fit. For particularly bright sources such a model did not give a good fit, and for these we used instead a continuum component describing Comptonisation in a homogeneous environment (compTT in xspec; Titarchuk, 1994a). The particular choice of the continuum did not significantly affect the measured flux within the energy range covered by the PCA. We then integrated the model over the energy range 2.5–25 keV444The Crab flux in this band is to estimate the source flux detected by each PCU. For each source we calculated the mean PCU-to-PCU offset averaged over all the public RXTE observations, and renormalized the flux measurements relative to PCU 2. We adopted the mean and standard deviation of the rescaled flux measurements as the flux and error for that observation.
While the majority of the burst flux is emitted in the range 2.5–25 keV, this is generally not true for the persistent emission. In order to estimate the bolometric persistent flux we chose representative (preferably long) observations for selected sources and undertook combined fits of each PCU spectra (as described above) along with HEXTE spectra above 15 keV. We set the upper energy limit for the HEXTE spectra individually depending upon the maximum energy to which the source could be detected (typically 40–80 keV). Persistent spectra from bursters frequently exhibit a spectral cutoff between 15 and 50 keV, and so we fit the broadband spectra with a Comptonisation continuum component attenuated by neutral absorption, also sometimes with a Gaussian component representing fluorescent Fe emission around 6.4 keV. We generated an idealized response covering the energy range 0.1–200 keV with 200 logarithmically spaced energy bins, and integrated the model flux also over this range. We then calculated a bolometric correction as the ratio between the 0.1–200 and 2.5–25 keV fluxes measured from the broadband spectral fits. The error on the bolometric correction was estimated as the standard deviation of the derived correction over the available PCUs. Altogether we estimated bolometric corrections for observations of 24 bursting sources, ranging between 1.05 (from a 1997 September observation of 4U 172834) and 2.14 (for a 2002 October observation of SAX J1808.43658; Table 2). The corrections for the accretion-powered pulsars tended to be larger than for the non-pulsing burst sources, and we found the maximum value for the latter sources to be 1.93. In the mean, for the non-pulsing sources, and we adopt this value except where we calculated a correction specifically for that source or observation. The likely error introduced is thus no more than %.
| Dur. | Flux | Soft | Hard | |||||
|---|---|---|---|---|---|---|---|---|
| Source | Obs ID | Start time (UT) | (ks) | ()aaFlux in the 2.5–25 keV band, averaged over the entire observation (excluding any bursts present). | color | color | ||
| EXO 0748676 | 10108-01-07-01 | 1996 Aug 15 21:24:00 | 1.86 | 2.30 | 0.98 | |||
| 1M 0836425 | 70031-03-01-00 | 2003 Jan 24 06:10:03 | 6.00 | 1.99 | 0.892 | |||
| 4U 125469 | 60044-01-02-00 | 2001 Dec 7 00:02:04 | 44.8 | 1.55 | 0.440 | |||
| 4U 132362 | 20066-02-01-00 | 1997 Apr 25 22:00:02 | 21.1 | 2.14 | 0.894 | |||
| 4U 160852 | 60052-03-01-01 | 2001 Nov 20 23:48:03 | 3.78 | 1.56 | 0.694 | 1.19 | ||
| 4U 1636536 | 40028-01-13-00 | 2000 Jan 22 01:29:03 | 16.1 | 1.58 | 0.449 | 2.63 | ||
| 60032-05-15-00 | 2002 Feb 28 13:43:04 | 25.9 | 1.53 | 0.464 | 2.57 | |||
| 4U 1702429 | 20084-02-01-00 | 1997 Jul 19 08:50:03 | 20.5 | 1.63 | 0.460 | 2.28 | ||
| 40025-04-01-01 | 1999 Feb 22 02:44:03 | 4.44 | 1.55 | 0.520 | 1.93 | |||
| 4U 170544 | 20073-04-01-00 | 1997 Apr 1 13:25:02 | 13.8 | 1.86 | 0.712 | 1.15 | ||
| XTE J1710281 | 60049-01-01-00 | 2001 Aug 12 07:05:03 | 24.8 | 1.40 | 0.488 | |||
| XTE J1723376 | 40705-01-03-00 | 1999 Feb 3 21:53:03 | 10.4 | 1.95 | 0.380 | |||
| 4U 172834 | 20083-01-02-01 | 1997 Sep 21 15:42:02 | 13.9 | 1.87 | 0.513 | 2.33 | ||
| 50030-03-06-02 | 2001 Jul 22 12:09:03 | 4.92 | 1.83 | 0.634 | 1.67 | |||
| KS 1731260 | 30061-01-02-01 | 1998 Oct 2 13:04:02 | 3.60 | 1.67 | 0.731 | 1.30 | ||
| 4U 173544 | 20084-01-02-03 | 1997 Sep 1 08:52:03 | 8.76 | 1.66 | 0.561 | |||
| XTE J1739285 | 91015-03-04-04 | 2005 Nov 7 03:26:04 | 10.1 | 1.54 | 0.473 | |||
| SAX J1748.92021 | 60035-02-02-03 | 2001 Oct 8 07:44:04 | 10.6 | 1.49 | 0.403 | |||
| EXO 1745248 | 50054-06-03-00 | 2000 Aug 6 12:56:04 | 4.62 | 2.05 | 0.840 | |||
| 4U 174637 | 10112-01-01-00 | 1996 Oct 25 00:13:00 | 22.0 | 1.65 | 0.767 | 0.751 | ||
| SAX J1808.43658 | 70080-01-02-00 | 2002 Oct 18 02:09:03 | 23.2 | 1.42 | 0.688 | |||
| XTE J1814338 | 80418-01-01-09 | 2003 Jun 12 13:19:04 | 9.12 | 1.56 | 0.883 | |||
| GX 17+2 | 30040-03-02-00 | 1998 Nov 18 06:41:02 | 20.8 | 1.84 | 0.377 | |||
| GS 182624 | 20089-01-01-02 | 1997 Nov 5 21:09:02 | 15.6 | 1.66 | 0.857 | |||
| Ser X-1 | 70027-04-01-01 | 2002 May 27 15:05:04 | 5.76 | 1.48 | 0.383 | |||
| 4U 1916053 | 30066-01-02-08 | 1998 Jul 23 11:27:02 | 13.2 | 1.57 | 0.667 | |||
| XTE J2123058 | 30511-01-05-00 | 1998 Jul 22 05:11:02 | 26.5 | 1.49 | 0.471 | 2.24 |
From the persistent flux and the distance (derived from the peak flux of radius-expansion bursts), we may also estimate the accretion rate per unit area at the neutron star surface, . We assume that the X-ray luminosity is
| (1) |
where is the NS radius, and is the energy released per nucleon during accretion (). Here we assume implicitly that the accreted fuel covers the neutron star surface evenly, and that the persistent emission is isotropic. Because the neutron star has such a strong gravitational field, the luminosity measured by an distant observer is significantly lower than at the NS surface due to gravitational redshift. Thus, we correct the quantities at the NS surface by a factor , where is the surface redshift; for a NS with mass and radius km. Both mass measurements Thorsett & Chakrabarty (1999) and predictions from a range of plausible equations of state (e.g. Lattimer & Prakash, 2001) suggest that the masses and radii of neutron stars (and hence the compactness ) span relatively narrow ranges. A surface redshift has only been tentatively measured (via redshifted absorption lines) in one burster, EXO 0748676, at Cottam et al. (2002); subsequent analyses have failed to confirm this result Cottam et al. (2007). Thus, our assumption of a constant redshift of for all the bursters in our sample unavoidably introduces a small systematic error when combining burst measurements from different sources (see §2.5). Then
| (2) | |||||
It is generally thought that is proportional to within intervals of days, but that the absolute calibration can shift substantially on longer timescales (e.g. Méndez et al., 2001).
2.2. Temporal and spectral analysis of individual bursts
Once each burst was located, high time- and spectral resolution data (where available) from the PCA covering the burst (100–200 s) were downloaded and processed to provide a range of analysis products. For most bursts, multiple spectral channels were available with time resolution of 0.25 s or better. We extracted 2–60 keV spectra within intervals of 0.25–2 s covering the entire burst. We set the initial integration time for the spectra at 0.25, 0.5, 1 or 2 s depending upon the peak count rate of the burst (, 3000–6000, 1500–3000 or respectively, neglecting the pre-burst persistent emission). Each time the count rate following the peak decreased by a factor of we doubled the spectral time bin size. Since the evolution of the burst flux is slower in the tail, this increase in time bin size does not adversely affect the data quality.
We fitted each burst spectrum with a blackbody model multiplied by a low-energy cutoff, representing interstellar absorption using the cross-sections of Morrison & McCammon (1983) and solar abundances from Anders & Ebihara (1982). A spectrum extracted from a (typically) 16 s interval prior to the burst was subtracted as the background; this approach is well-established as a standard procedure in X-ray burst analysis (e.g. van Paradijs & Lewin, 1986; Kuulkers et al., 2002). The observations span multiple PCA gain epochs, which are defined by instances where the gain was manually re-set by the instrument team (on 1996 March 21, 1996 April 15, 1999 March 22 and 2000 May 13). In addition to these abrupt changes more gradual variation in the instrumental response is known to occur, due to a number of factors. To take into account these gain variations we generated a separate response matrix for each burst using pcarsp version 10.1555We note that the geometric area of the PCUs was changed for this release for improved consistency between PCUs and with (e.g.) canonical models of calibration sources, particularly the Crab pulsar. These changes have the effect of reducing the measured flux compared to analyses using previous versions of the response generating tools, by 12–14%. See Jahoda et al. (2006) for more details., which is included as part of lheasoft version 5.3 (2003 November 17). The initial fitting was performed with the absorption column density free to vary; subsequently it was fixed at the mean value over the entire burst to estimate the bolometric flux. The bolometric flux at each timestep was calculated according to
| (3) | |||||
where is the blackbody temperature, is the effective radius of the emitter, is the distance to the source, and is the normalisation of the blackbody component (we assume isotropic emission for the burst flux throughout, unless stated otherwise). For bursts observed in slews or offset pointings, we rescaled the measured peak flux and fluence by , where is the offset between the pointing angle and the source position (see appendix B). It is important to note that the apparent blackbody temperature for a distant observer and the apparent temperature measured at the surface differ by a factor of . Furthermore, spectral hardening arising from radiation transfer effects in the atmosphere increase the apparent surface temperature compared to the effective temperature (e.g. London et al., 1986; Titarchuk, 1994b; Madej et al., 2004). Unless otherwise stated, we make no correction for the effects of redshift or spectral hardening, and quote the observed parameters for distant observers only.
Implicit in equation (3) is the bolometric correction to the burst flux measured in the PCA bandpass; this correction adds % to the peak 2.5–25 keV PCA flux of radius expansion bursts. Should the emitted spectrum deviate significantly from a blackbody outside the PCA passband, equation (3) will not give the correct bolometric flux. Reassuringly, the blackbody model gave a good fit to the vast majority of the burst spectra (e.g. Fig. 5), although we consider that systematic errors of order as large as the bolometric correction may yet be present in the flux estimates presented here. The model fits tended to result in poor values preferentially at low fluxes, in the burst tail; 13% of the burst spectra with fluxes of the peak in that burst had , while only 4.6% of the spectra with flux of the peak had . For a distribution with 24 degrees of freedom (which is the typical number for the fits) we expect only 2.5% of reduced- values in excess of 2, indicating that the distribution even for the bright spectra was skewed to higher values. The largest values of were obtained in bright bursts with extreme radius expansion, like those from 4U 1724307 (see §A.15) and 4U 2129+12 (§A.47; see also §3.1).
Fixing the at the mean derived over each burst may introduce additional errors into the burst flux and fluence, if this value is substantially different from the true column towards the source at the time of the burst. Due to its modest low-energy response, the PCA can generally accurately determine the only when it is . Alternative approaches, such as fixing the absorption at the measured Galactic line-of-sight column density, gave poorer fits overall and hence less reliable fit parameters. Furthermore, the local contribution to the line-of-sight can vary with time in LMXBs due to changes in the local distribution of matter, and in the absence of contemporaneous measurements by instruments with better low-energy response we must rely on the values measured by the PCA. Errors in the fluence from incorrect values for individual time-resolved spectra are likely to average out in the sum, so that the remaining parameter most likely to be affected by this source of error is the peak flux . The magnitude of the introduced error is per ; that is, for every we overestimate the column for the spectral fits, we calculate an unabsorbed flux larger. We can estimate the magnitude of the error by comparing the peak flux determined from the spectral fits with fixed, to those where it is free to vary. We find that these values are consistent for 90% of the bursts, and for the remainder the peak flux with fixed is consistently less than the peak flux with free to vary. This is because the fitted value for a few low signal-to-noise spectra in some (typically very long) bursts are much higher than the mean, resulting in an erroneously large peak (unabsorbed) flux. Thus, through our approach we avoid these erroneously high peak fluxes by re-fitting with the frozen at the mean, and the additional error introduced to the are likely comparable to our estimated uncertainty on those values.

We defined the burst start time to be the time when the burst flux first exceeded 25% of the peak flux (see e.g. Fig. 3). The rise time is the interval from to when the burst flux exceeds 90% of . These definitions were chosen for ease of implementation and insensitivity to Poisson or systematic variations in the burst rises during, for example, strong radius expansion bursts. In order to describe the entire lightcurve quantitatively, we also fitted an exponential curve with decay constant to the bolometric flux from where the flux first dropped below 90% of through the decay. For many bursts, the evolution was not consistent with a single exponential decay, and so we fitted a subsequent exponential curve, with an independent decay constant until the end of the interval over which we extracted burst spectra (128 s by default666We extracted data over longer windows for sources with typically long bursts, e.g. GS 182624 and GX 17+2.). Note that the decay curves for most bursts were not statistically consistent with this “broken” exponential model, mainly due to variations on smaller time-scales (for this reason we do not quote uncertainties for the decay constants and ). However, we chose the time ranges to fit the exponential segments so as to qualitatively described the burst decay with as few parameters as possible, even if the actual fit was poor.
We measured the fluence by summing the measured fluxes over the burst, and integrating the final exponential curve to account for any additional flux beyond the data window. We found significant emission compared to the pre-burst level at the end of the window particularly for long bursts. We extrapolated the second (or first, in cases where only one exponential was used to fit the lightcurve) decay curve beyond the end of the data window, and integrated to estimate the burst flux missed by truncating the high-resolution data. Where this extrapolated contribution to the fluence was greater than the propagated error, we adopted it as the uncertainty instead of the propagated error. We also calculated for each burst a simpler, less model-dependent time scale traditionally used to characterise burst evolution (e.g. van Paradijs et al., 1988a) for which we estimated the uncertainties by propagating the errors on and .
From the observed (bolometric) integrated burst flux , we estimate the column depth at which the burst is ignited as
| (4) | |||||
where is the total burst luminosity, and the energy released, MeV/nucleon for material with solar abundances. For sub-solar hydrogen fraction , where (strictly speaking) is averaged over the burning layer; this expression assumes % energy loss due to neutrinos during the rp process (e.g. Fujimoto et al. 1987; see also Schatz et al. 1999, 2001). As with the persistent emission, we assume that the burst emission is isotropic.
For bursts where the recurrence time could be measured unambiguously, we calculated the ratio of the integrated persistent flux to the burst fluence:
| (5) |
We propagated the errors on each of the observeable parameters (excluding , for which the fractional measurement errors were negligible) to calculate the error on . By substituting expressions 4 and 2 into the simple equality (assuming implicitly that all the accreted fuel is burnt during the burst) we obtain the expected value of , which depends upon the compactness of the star and the burst fuel composition:
| (6) | |||||
We note that if the burst fuel is not completely consumed, the observed fluence will be lower than expected (given the available fuel), and the measured (equation 5) will thus be in excess of the expected value.
2.3. Photospheric radius-expansion
The time-resolved spectral analyses result, for each burst with high temporal and spectral data coverage, in time-series of blackbody temperature (units of keV) and normalization (units of ) throughout the burst. We examined the spectral variation throughout each of the bursts in the catalog and classified them according to the following criteria. We considered that radius expansion occurred when 1) the blackbody normalization reached a (local) maximum close to the time of peak flux; 2) lower values of were measured following the maximum, with the decrease significant to or more; and 3) there was evidence of a (local) minimum in the fitted temperature at the same time as the maximum in . Bursts where just one or two of these criteria were satisfied we refer to as “marginal” cases, in which the presence of PRE could not be conclusively established777We note, however, that in the case of 4U 172834, the marginal cases have an identical flux distribution as the confirmed radius expansion bursts Galloway et al. (2003); so excluding these bursts from the sample of PRE bursts may be overly conservative..
For spherically symmetric emission, the Eddington luminosity measured by an observer at infinity is given by Lewin et al. (1993)
| (7) | |||||
where is the effective temperature of the atmosphere, is a coefficient parametrizing the temperature dependence of the electron scattering opacity ( K-1; Lewin et al., 1993), is the mass of the proton, the Thompson scattering cross-section, and is the mass fraction of hydrogen in the atmosphere ( for cosmic abundances). The final factor in square brackets represents the gravitational redshift at the photosphere , which may be elevated significantly above the NS surface (i.e. ). Kuulkers et al. (2003) analysed all bursts detected from the 12 bursters in globular clusters, for which independent distance estimates are available, in order to rigorously test whether the radius-expansion bursts reached a “standard candle” luminosity. They found that for about two-thirds of the sources the radius-expansion bursts reached . This value is consistent with equation 8 only for H-poor material and where the radius expansion drives the photosphere to very large radii; we note however that the spectral evidence generally does not support the latter condition (e.g. Sugimoto et al., 1984).
Given the observed peak flux of a PRE burst , we estimated the distance as
| (8) | |||||
We discuss the properties of the radius-expansion bursts in §3.1.
2.4. Burst oscillations
We searched for burst oscillations in data recorded with s (122 s) time resolution. We computed fast Fourier transforms of each 1 s interval of data for the first 16 s of the burst, and searched for signals in bursts from sources with previously-detected burst oscillations within 5 Hz of the known oscillation frequencies. We considered a signal to be a detection if it had less than a 1% chance of occurring due to noise given the 160 trial frequencies searched for each burst. A signal was considered significant if it passed any of three tests: (1) having a probability of that it was produced by noise in a single trial, (2) persisting for two adjacent (independent) time and frequency bins with a chance probability of , or (3) occurring in the first second of a burst with a chance probability of .
If oscillations were detected during a burst, we then determined whether they were observed during the rise, peak or decay of the burst. We defined these characteristic times during the burst using data with 0.25 s time resolution. The rise of the burst was defined to start 0.25 s before the first time bin in which the count rate rose above 25 % of the peak count rate, and ended in the last time bin for which the count rate was less than 90% of the peak count rate. The peak of the burst was defined to last from the end of the rise until the count rate dropped back below 90% of the peak count rate. The decay of the burst commenced at the end of the peak, and lasted through to the end of the high-time resolution data (typically s duration).
Figure 3 illustrates how these times were defined for a burst from 4U 1702–429. Oscillations were detected during the rise and decay of this burst, but not during the peak. Note that the over-sampled dynamic power spectrum displayed in this figure was not used to search for oscillations; only non-overlapping power spectra were used for the oscillation search. Where oscillations were not detected in any of the 1-s intervals, we also computed FFTs of 4-s intervals covering the burst. We used a probability threshold of to determine when the oscillations occurred, corresponding to a 1% chance of observing a spurious signal during each 1 s interval (10 trial frequencies).
We computed the amplitudes of the oscillations according to
| (9) |
where is the power from the Fourier spectrum, is the total number of counts in the profile, and is the estimated number of background counts. We estimated the background using the mean count rate 16 seconds prior to the start of the burst. Since the detection threshold is a fixed power, the minimum detectable amplitude depends on the number of counts produced by a burst. We discuss the global properties of the bursts from burst oscillation sources in §3.7.
2.5. Combined burst samples
We combined samples of bursts from different sources in order to analyse larger samples than would be possible for a single source. Throughout this paper we refer to these combined samples as “label” where label corresponds to the selection criteria. The details of each subsample discussed in the text are listed in Table 7.
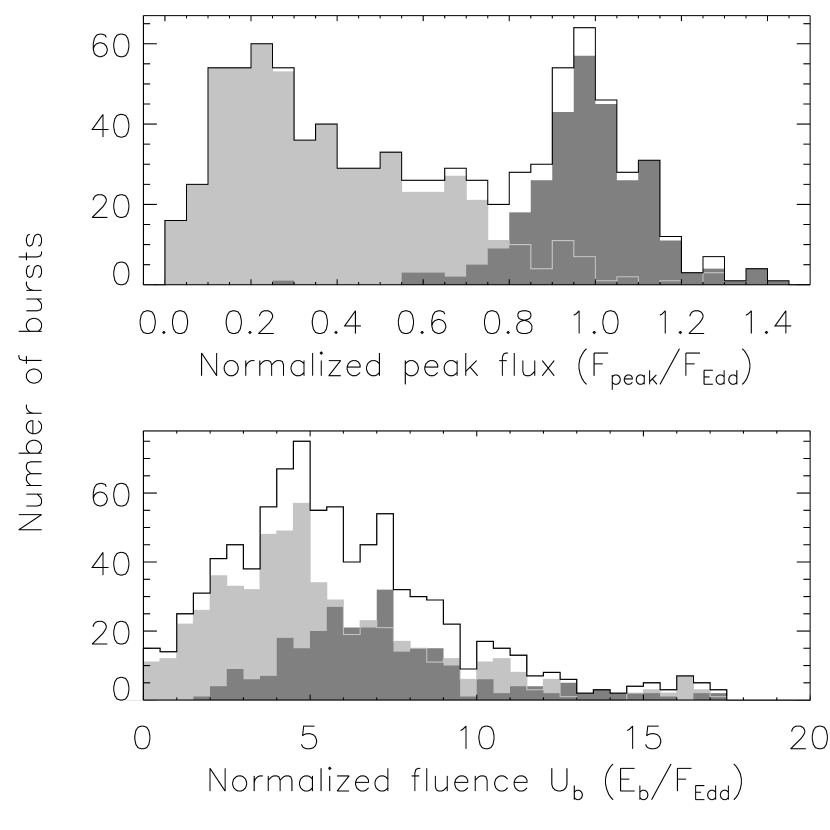
We assembled two principal samples using the two measures of the accretion rate (see §2.1). First, we calculated the mean peak flux of the radius-expansion bursts from each source that exhibited at least one. We identify this value as the flux corresponding to the Eddington luminosity for that source, . For each observation we then calculated the dimensionless persistent flux , rescaling the measured persistent flux (see §2.1) by the for that source (this approach follows van Paradijs et al., 1988a)888For reference, corresponds to between 1.6– (depending upon the maximum radius and atmospheric composition in Equation 7).. We excluded sources for which the PCA field of view contains other active sources, since we cannot reliably estimate the persistent flux in those cases (GRS 1741.92853, 2E 1742.92929 and SAX J1747.02853). It is possible that the Eddington luminosity varies from source to source, e.g. due to variations in the composition of the photosphere, and this may introduce a bias when combining data based on of up to a factor of 1.7. We also neglect the precise bolometric correction for each observation, which introduces an error up to a factor of two (see §2.1). Ideally, is approximately equal to the accretion rate as a fraction of the Eddington rate, i.e. . This approach has the advantage of being independent of assumptions about exactly what is the value of the Eddington limit reached by the bursts. The principal drawback is that it is only possible for those sources with at least one detected PRE burst, although these sources represent the majority of the bursts contributing to our sample. We refer to this sample as (see Table 7 for a summary). We also calculated the normalized peak burst flux and fluence in order to measure the combined distribution of those parameters in §3.1.
There is substantial evidence that may not strictly track (e.g. Hasinger & van der Klis, 1989), so that may not be the best available measure of . Thus, we assembled a second sample of bursts from only those sources with a well-defined color-color diagram, in this case adopting the position along the color-color diagram as a proxy for (see §2.1; we refer to this sample as , Table 7). We show in Fig. 6 the comparison between the observation-averaged and for eight of the nine sources with both well-defined color-color diagrams. For most of the sources, was proportional to when (upper or “island” horizontal branch in Fig. 4) and (lower or “banana” branch). However, between these two branches is essentially constant at between 0.006 and 0.06, indicating that the transition between the two branches takes place at a roughly constant flux. For two sources, 4U 160852 and KS 173126, the relationship is more complex, and some observations with very hard spectra () actually have very low .


We measured mean burst rates for the combined burst samples and as a function of accretion rate (by proxy). In order to guarantee reasonable statistics, we defined bins such that some minimum number of bursts fell into each bin. We then calculated the mean burst rate within each bin as the number of bursts divided by the total duration of observations which also fell into that bin. We also measured recurrence times from a third sample comprising successive pairs of bursts with recurrence times hr. In general the measured separation of a pair of bursts is an upper limit on the recurrence time, due to the possibility of missing intervening events in data gaps arising from Earth occultations. Additional data gaps arise from satellite passages through the South Atlantic Anomaly, during which the PCA is turned off to protect the electronics from damage. We can estimate the recurrence time with more confidence when the burst is observed within a high duty-cycle observing interval, or where the source is bursting regularly999We note that this sample is not complete, but is limited to sources of particular interest; see Table 7.. For each pair of bursts matching this criteria we calculated the instantaneous burst rate as . We note that also includes bursts with very short separations min, for which the occurrence is episodic and thus not indicative of a steady recurrence time (see §3.8.2).
We also calculated mean -values (which we designate ) for the combined samples and . For the bursts arising from observations which fall in a bin (defined as a range in or , for samples and , respectively) we calculated
| (10) |
where is the duration of each observation. We note that calculated in this manner is an underestimate of the true value, since is calculated from the 2.5–25 keV flux, which broad-band spectral fits indicate contributes typically 60–90% of the bolometric persistent flux (depending upon the source and the spectral state). We measured the values directly for pairs of bursts from sample . Here we determined the bolometric correction appropriate for the observations(s) in which the bursts occurred (see §2.1) and calculated according to equation 5. We discuss the variations in burst properties, including , as a function of in §3.4.
| Time | Mean burst | ||||||||
|---|---|---|---|---|---|---|---|---|---|
| Source | TypeaaSource type, adapted from Liu et al. (2001); A = atoll source, D = “dipper”, G = globular cluster association, O = burst oscillation, P = pulsar, S = superburst, T = transient, Z = Z-source. We omit the “B” designation indicating a burst source. | RA | Dec | (hr) | (ks) | rate (hr-1) | |||
| 4U 051340 | G | 05 14 06.6 | -40 02 37 | 555 | 1200 | 7 | 0.021 | 1 | |
| EXO 0748676 | TD | 07 48 33.8 | -67 45 08 | 3.82 | 489 | 1390 | 94 | 0.24 | 3 |
| 1M 0836425 | T | 08 37 22.7 | -42 53 08 | 29 | 143 | 17 | 0.43 | ||
| 4U 091954 | 09 20 26.8 | -55 12 24 | 79 | 387 | 4 | 0.037 | 1 | ||
| 4U 125469 | DS | 12 57 37.2 | -69 17 20 | 3.93 | 26 | 279 | 5 | 0.064 | |
| 4U 132362 | D | 13 26 36.1 | -62 08 10 | 2.93 | 15 | 264 | 30 | 0.41 | |
| 4U 160852 | TAOS | 16 12 42.9 | -52 25 22 | 546 | 1650 | 31 | 0.068 | 12 | |
| 4U 1636536 | AOS | 16 40 55.5 | -53 45 05 | 3.8 | 454 | 2790 | 172 | 0.22 | 46 |
| MXB 1659298 | TDO | 17 02 06.3 | -29 56 45 | 7.11 | 80 | 356 | 26 | 0.26 | 12 |
| 4U 1702429 | AO | 17 06 15.2 | -43 02 09 | 196 | 1300 | 47 | 0.13 | 5 | |
| 4U 170544 | A | 17 08 54.6 | -44 06 02 | 140 | 605 | 47 | 0.28 | 3 | |
| XTE J1709267 | T | 17 09 30.2 | -26 39 27 | 39 | 145 | 3 | 0.075 | ||
| XTE J1710281 | DT | 17 10 12.4 | -28 07 54 | 63 | 231 | 18 | 0.28 | 1 | |
| XTE J1723376 | T | 17 23 38.0 | -37 39 42 | 4 | 34.1 | 3 | 0.32 | ||
| 4U 1724307 | GA | 17 27 33.2 | -30 48 07 | 93 | 512 | 3 | 0.021 | 2 | |
| 4U 172834 | AO | 17 31 57.3 | -33 50 04 | 346bbFor sources with a neighbor within , we combine all observations which include this source within the field of view (possibly including observations of the neighbor). | 1940bbFor sources with a neighbor within , we combine all observations which include this source within the field of view (possibly including observations of the neighbor). | 106 | 0.20 | 69 | |
| Rapid Burster | GT | 17 33 24.0 | -33 23 16 | 344bbFor sources with a neighbor within , we combine all observations which include this source within the field of view (possibly including observations of the neighbor). | 1900bbFor sources with a neighbor within , we combine all observations which include this source within the field of view (possibly including observations of the neighbor). | 66 | 0.13 | ||
| KS 1731260 | TOS | 17 34 13.0 | -26 05 09 | 78 | 483 | 27 | 0.20 | 3 | |
| SLX 1735269 | T | 17 38 16.0 | -27 00 18 | 53bbFor sources with a neighbor within , we combine all observations which include this source within the field of view (possibly including observations of the neighbor). | 287bbFor sources with a neighbor within , we combine all observations which include this source within the field of view (possibly including observations of the neighbor). | 1 | 0.013 | ||
| 4U 173544 | AS | 17 38 58.2 | -44 26 59 | 4.65 | 82 | 454 | 11 | 0.087 | 6 |
| XTE J1739285 | T | 17 39 54.0 | -28 29 00 | 27ccSimilarly, for sources towards the Galactic center, we combine all observations which include the source in the field of view to calculate the mean burst rate. | 135ccSimilarly, for sources towards the Galactic center, we combine all observations which include the source in the field of view to calculate the mean burst rate. | 6 | 0.16 | ||
| KS 1741293 | T | 17 44 49.2 | -29 21 06 | 452ccSimilarly, for sources towards the Galactic center, we combine all observations which include the source in the field of view to calculate the mean burst rate. | 2090ccSimilarly, for sources towards the Galactic center, we combine all observations which include the source in the field of view to calculate the mean burst rate. | 1 | 0.0017 | ||
| GRS 1741.92853 | O | 17 45 00.6 | -28 54 06 | 440ccSimilarly, for sources towards the Galactic center, we combine all observations which include the source in the field of view to calculate the mean burst rate. | 2070ccSimilarly, for sources towards the Galactic center, we combine all observations which include the source in the field of view to calculate the mean burst rate. | 8 | 0.014 | 6 | |
| 2E 1742.92929 | T? | 17 46 06.2 | -29 31 05 | 440ccSimilarly, for sources towards the Galactic center, we combine all observations which include the source in the field of view to calculate the mean burst rate. | 2070ccSimilarly, for sources towards the Galactic center, we combine all observations which include the source in the field of view to calculate the mean burst rate. | 84 | 0.15 | 2 | |
| SAX J1747.02853 | T | 17 47 02.6 | -28 52 59 | 433ccSimilarly, for sources towards the Galactic center, we combine all observations which include the source in the field of view to calculate the mean burst rate. | 2090ccSimilarly, for sources towards the Galactic center, we combine all observations which include the source in the field of view to calculate the mean burst rate. | 23 | 0.040 | 10 | |
| IGR 174732721 | 17 47 18.1 | -27 20 39 | 114bbFor sources with a neighbor within , we combine all observations which include this source within the field of view (possibly including observations of the neighbor). | 560bbFor sources with a neighbor within , we combine all observations which include this source within the field of view (possibly including observations of the neighbor). | 2 | 0.013 | |||
| SLX 1744300 | 17 47 25.9 | -30 02 30 | 39ccSimilarly, for sources towards the Galactic center, we combine all observations which include the source in the field of view to calculate the mean burst rate. | 290ccSimilarly, for sources towards the Galactic center, we combine all observations which include the source in the field of view to calculate the mean burst rate. | 3 | 0.037 | |||
| GX 3+1 | A | 17 47 56.0 | -26 33 48 | 106bbFor sources with a neighbor within , we combine all observations which include this source within the field of view (possibly including observations of the neighbor). | 539bbFor sources with a neighbor within , we combine all observations which include this source within the field of view (possibly including observations of the neighbor). | 2 | 0.013 | 1 | |
| 1A 1744361 | TD? | 17 48 14.0 | -36 07 30 | 15 | 40.6 | 1 | 0.089 | ||
| SAX J1748.92021 | TG | 17 48 53.4 | -20 21 43 | 27 | 149 | 16 | 0.39 | 6 | |
| EXO 1745248 | TG | 17 48 55.7 | -24 53 40 | 51 | 148 | 22 | 0.54 | 2 | |
| 4U 174637 | GA | 17 50 12.6 | -37 03 08 | 5.7 | 51 | 445 | 30 | 0.24 | 3 |
| SAX J1750.82900 | TO | 17 50 24.0 | -29 02 18 | 42ccSimilarly, for sources towards the Galactic center, we combine all observations which include the source in the field of view to calculate the mean burst rate. | 161ccSimilarly, for sources towards the Galactic center, we combine all observations which include the source in the field of view to calculate the mean burst rate. | 4 | 0.090 | 2 | |
| GRS 1747312 | GDT | 17 50 45.5 | -31 17 32 | 12.36 | 114bbFor sources with a neighbor within , we combine all observations which include this source within the field of view (possibly including observations of the neighbor). | 670bbFor sources with a neighbor within , we combine all observations which include this source within the field of view (possibly including observations of the neighbor). | 7 | 0.038 | 3 |
| XTE J1759220 | D? | 17 59 42.0 | -22 01 00 | 17 | 107 | 1 | 0.034 | ||
| SAX J1808.43658 | PT | 18 08 27.5 | -36 58 44 | 2.01 | 316 | 1390 | 6 | 0.016 | 5 |
| XTE J1814338 | TP | 18 13 40.0 | -33 46 00 | 4.27 | 90 | 447 | 28 | 0.23 | |
| GX 17+2 | ZS | 18 16 01.3 | -14 02 11 | 147 | 917 | 12 | 0.047 | 2 | |
| 3A 1820303 | GAS | 18 23 40.5 | -30 21 40 | 0.19 | 186 | 1230 | 5 | 0.015 | 5 |
| GS 182624 | T | 18 29 27.0 | -23 47 29 | 127 | 929 | 65 | 0.25 | ||
| XB 1832330 | GT | 18 35 44.1 | -32 59 29 | 13 | 102 | 1 | 0.035 | 1 | |
| Ser X-1 | S | 18 39 57.5 | +05 02 08 | 41 | 251 | 7 | 0.10 | 2 | |
| HETE J1900.12455 | TP | 19 00 08.6 | -24 55 14 | 1.39 | 194 | 664 | 2 | 0.011 | 3 |
| Aql X-1 | TAO | 19 11 15.9 | +00 35 06 | 19.0 | 411bbFor sources with a neighbor within , we combine all observations which include this source within the field of view (possibly including observations of the neighbor). | 1650bbFor sources with a neighbor within , we combine all observations which include this source within the field of view (possibly including observations of the neighbor). | 57 | 0.12 | 9 |
| 4U 1916053 | D | 19 18 47.9 | -05 14 08 | 0.83 | 51 | 412 | 14 | 0.12 | 12 |
| XTE J2123058 | TA | 21 23 16.1 | -05 47 30 | 5.96 | 5 | 67.2 | 6 | 0.32 | |
| 4U 2129+12 | G | 21 29 58.3 | +12 10 02 | 17.1 | 32 | 343 | 1 | 0.010 | 1 |
| Cyg X-2 | Z | 21 44 41.2 | +38 19 18 | 236.2 | 379 | 1910 | 55 | 0.10 | 8 |
| Total (48 sources) | 1187 | 247 |
3. Thermonuclear X-ray bursts observed by RXTE
We detected a total of 1187 thermonuclear bursts from 48 sources in public RXTE observations up to 2007 June 3. We summarise the numbers of bursts from individual sources in Table 3. The sky distribution of burst sources is shown in Fig. 7. Our burst search included all known thermonuclear burst sources as at 2007 June 3. Recently discovered examples include the faint INTEGRAL source IGR J173642711 Chelovekov et al. (2006); the transients IGR J174642811/XMMU J174716.1281048 Del Santo et al. (2007) and IGR J174732721/XTE J1747274 (see §A.26; Grebenev et al., 2005) and the 294 Hz burst oscillation source IGR J171912821 Klein-Wolt et al. (2007); Markwardt et al. (2007). Eighteen sources previously found to exhibit thermonuclear bursts were observed by RXTE but with no detected bursts (Table 3).
For each source with bursts observed by RXTE we list the relevant analysis results in Table 5. The superscript to the burst number indicates a range of potential analysis issues, as follows:
-
a
The burst was observed during a slew, and thus offset from the source position.
-
b
The observation was offset from the source position. In cases (a) and (b) we scaled the flux and fluence by the mean collimator response appropriate for the position of the source in the field of view, as described in appendix B.
-
c
The origin of the burst is uncertain; the burst may have been from another source in the field-of-view (we rescaled the flux and fluence, if necessary, based upon the assumed origin);
-
d
Buffer overruns (or some other instrumental effect) caused gaps in the high time-resolution data;
-
e
The burst was so faint that only the peak flux could be measured, and not the fluence or other parameters;
-
f
An extremely faint burst or possibly problems with the background subtraction, resulting in no fit results;
-
g
the full burst profile was not observed, so that the event can be considered an unconfirmed burst candidate. Typically in these cases the initial burst rise is missed, so that the measured peak flux and fluence are lower limits only;
-
h
High-time resolution datamodes did not cover the burst.
Column (2) lists the ID for the observation during which the burst was observed; (3) the burst start time in UT and MJD (we neglect corrections to give the time at the solar-system barycenter); (4) the peak flux , in units of ; (5) the burst fluence , in units of ; (6) the presence of radius expansion; (7) rise time (s); (8) peak count rate, per PCU; (9,10) the exponential decay constants , describing the decay of the burst, where available; (11) burst time scale (); and (12) burst fluence normalized by the mean peak flux of the PRE bursts , where available ( in van Paradijs et al., 1988a). From analysis of the persistent spectrum, excluding the bursts (see §2.1) we list in column (13) the persistent flux level prior to the burst (2.5–25 keV, units of ); (14) the persistent flux normalised by ( in van Paradijs et al., 1988a); (15,16) soft and hard color prior to the burst; and (17) position on the color-color diagram , where available. From estimates of the recurrence times of regular and/or approximately contemporaneous bursts from a subset of 23 sources, we compiled a set of 209 values (this we refer to as sample ; see Table 7) from which we derived (18) the inferred burst recurrence time ; using this value and (19) the correction (see also Table 2) used to estimate the bolometric flux from the measured 2.5–25 keV persistent flux, we derived (20) the corresponding -value, calculated according to equation 5. Finally, in column (21) we list references to previously published analyses of the burst. Note that we do not list values for columns 12–17 for those observations where we expect that more than one source is active in the field (see appendix B). We assembled various subsets of the detected bursts, as described in §2.5, for the subsequent analyses; these samples are summarized in Table 7.
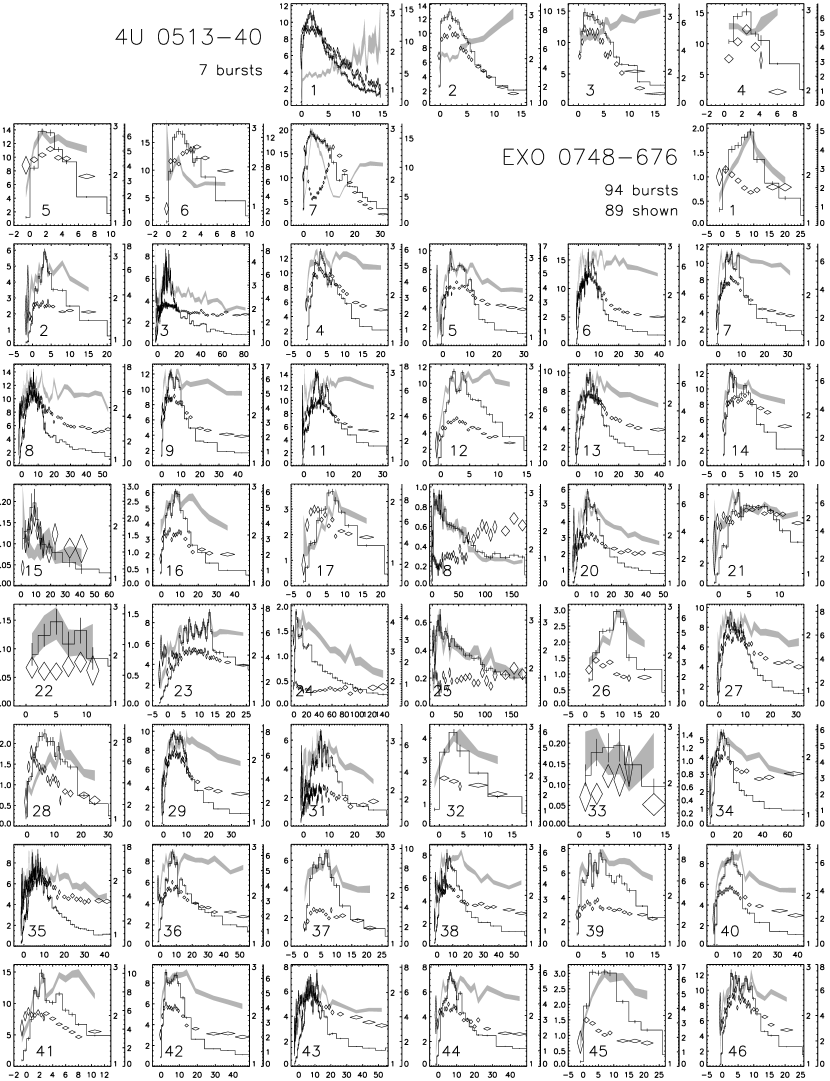
We plot the ASM intensity and burst activity of selected sources in Fig. 8. We also plot lightcurves and spectral evolution for individual bursts for all sources in Fig. 9. Note that only the bursts with time-resolved spectral information are plotted; this excludes bursts flagged with superscripts , , , , or in Table 5.
We searched 515 bursts from sources with previously detected burst oscillations, and detected oscillations from 194 in this manner101010 Our analyses led to the discovery of 267 Hz burst oscillations in 4U 1916053 Galloway et al. (2001), as well as 620 Hz oscillations in 4U 160852 (Hartman et al. 2008, in preparation).; fewer than 10 should be spurious detections of noise signals according to our selection criteria. We omitted 12 bursts from our analysis, principally because they lacked data with sufficiently high time resolution to search for oscillations. We also omitted bursts from EXO 0748676 from our analysis, since the oscillations in that source have only been detected in summed FFTs from many bursts Villarreal & Strohmayer (2004). The bursts from the vicinity of the Galactic center exhibiting 589 Hz oscillations were originally thought to originate from MXB 174329, although we attribute them instead to GRS 1741.92853, a newly-discovered source at the time (§B.6; §A.23).
| Time | ||||||||
|---|---|---|---|---|---|---|---|---|
| Source | TypeaaSource type, as for Table 3 | RA | Dec | (hr) | bbNumber in parentheses is the number of observations analysed to determine the flux range in column 8. | (ks) | () | Ref. |
| 4U 0614+09 | AS | 06 17 07.3 | +09 08 13 | 339(300) | 2161.3 | 0.60–2.7 | [1,2] | |
| 4U 124658 | 12 49 36.0 | -59 07 18 | 15(13) | 21.2 | 0.16–0.52 | [3] | ||
| Cen X-4 | T | 14 58 22.0 | -31 40 07 | 15.1 | 4 | 10.4 | [4,5] | |
| Cir X-1 | TAD | 15 20 40.8 | -57 10 00 | 398.4 | 599(467) | 2667.3 | 0.050–65 | [6] |
| 1E 1603.6+2600 | D? | 16 05 45.8 | +25 51 45 | 1.85 | 12(6) | 30.1 | [7] | |
| 4U 170532 | 17 08 54.4 | -32 18 57 | 1 | 3.6 | 0.11 | [8] | ||
| 4U 170840 | 17 12 23.0 | -40 50 36 | 14 | 61.1 | [9] | |||
| SAX J1712.63739 | T | 17 12 34.0 | -37 38 36 | 2 | 3.8 | [10] | ||
| 2S 1711339 | T | 17 14 17.0 | -34 03 36 | 10(9) | 42.1 | 0.019–0.84 | [11] | |
| 3A 1715321 | 17 18 47.3 | -32 10 40 | 13(5) | 100.2 | 0.020–6.7 | [12] | ||
| GPS 1733304 | G | 17 35 47.6 | -30 28 55 | 7 | 56.6 | [13] | ||
| IGR J173642711 alt. pos. | T? | 17 38 05.0 | -37 49 05 | 1 | 3.8 | 0.086 | [14] | |
| SAX J1752.33138ccFlux measurements are unreliable due to contamination from the nearby ( away) transient GRS 1747312 | 17 52 24.0 | -31 37 42 | 2 | 2.8 | [15] | |||
| SAX J1806.82435 | TA | 18 06 51.0 | -24 35 06 | 19(15) | 62.9 | 0.043–14 | [16] | |
| GX 13+1 | A | 18 14 31.0 | -17 09 25 | 577.6 | 65(37) | 560.8 | [17] | |
| 4U 181212 | A | 18 15 12.0 | -12 04 59 | 27 | 187.6 | [18] | ||
| AX J1824.52451 | 18 24 30.0 | -24 51 00 | 19(10) | 177.2 | [19] | |||
| 4U 185008 | GA | 18 53 04.8 | -08 42 19 | 0.343 | 11 | 65.1 | 0.22–1.4 | [20,21] |
| 1A 1905+00ddFlux measurements are unreliable due to contamination from the nearby ( away) transient Aql X-1 | 19 08 27.0 | +00 10 07 | 13 | 71.9 | [22] | |||
| Total (19 sources) | 1173 | 6290. |
.
References. — 1. Swank et al. (1978); 2. Brandt et al. (1992); 3. Piro et al. (1997); 4. Belian et al. (1972); 5. Matsuoka et al. (1980); 6. Tennant et al. (1986); 7. Hakala et al. (2005); 8. in ’t Zand et al. (2004c); 9. Migliari et al. (2003); 10. Cocchi et al. (2001a); 11. Cornelisse et al. (2002b); 12. Makishima et al. (1981a); 13. Makishima et al. (1981b); 14. Chelovekov et al. (2006); 15. Cocchi et al. (2001b); 16. Muller et al. (1998); 17. Matsuba et al. (1995); 18. Murakami et al. (1983); 19. Gotthelf & Kulkarni (1997); 20. Swank et al. (1976b); 21. Hoffman et al. (1980); 22. Lewin et al. (1976e).
Note. — This table does not include observations towards the Galactic center which cover multiple sources
![[Uncaptioned image]](/html/astro-ph/0608259/assets/x8.png)
We searched for, but did not detect, oscillations at 410 Hz in SAX J1748.92021 (as claimed by Kaaret et al., 2003); this source has subsequently exhibited intermittent persistent pulsations at 442 Hz Gavriil et al. (2007); Altamirano et al. (2008), strongly suggesting the earlier detection was spurious. We also made a targeted search around 1122 Hz for the bursts from XTE J1739-285, without success (cf. with Kaaret et al., 2007). This may be attributable to a different choice of time windows for the 4-s FFTs; in our search the windows do not overlap (to ensure they are independent), while the earlier search adopted overlapping windows beginning each 0.125 s.
We summarise the millisecond oscillation search in Table 8, and list the results for individual bursts in Table 9. Where sufficient signal was available to detect oscillations independently in the rise, peak and decay of the burst, we indicate the detection in the “Location” column (R, P and D, respectively). We also list the maximum Leahy power and the maximum fractional rms for the oscillation.

3.1. Photospheric radius expansion and source distances
Photospheric radius-expansion (PRE) bursts are a key phenomenon which allow measurement of the distance to bursting sources, as well as (in principle) determination of neutron star masses and radii Damen et al. (1990); Özel (2006). For these bursts, the large collecting area of RXTE permitted time-resolved spectral analysis, allowing us to identify radius-expansion episodes from the overwhelming majority of bursts in which they occurred. We were able to satisfy our criteria for radius-expansion (see §2.3) for bursts peaking at fluxes as low as ; the brightest PRE bursts in our sample reached more than . We thus identified photospheric radius-expansion bursts from 35 of the 48 sources with bursts detected by RXTE (Table 10).
We adopt the mean peak flux of radius-expansion bursts as the Eddington luminosity for that source, . Comparisons of bursts from different sources based on this value may be biased, for two reasons. First, PRE bursts from individual sources may not all reach consistent peak fluxes; and second, the Eddington luminosities may vary from source to source. We observed highly significant () variations in the peak PRE burst fluxes for 16 of the 27 sources with more than one PRE burst. For individual bursts, the estimated (statistical) uncertainty on the measured peak flux was typically %, while the fractional variation of peak fluxes from all PRE bursts from a given source was typically 5–10%. The mean fractional standard deviation over all 27 sources was %, with a maximum of 38% for GRS 1747312.
The peak fluxes of the combined sample of radius-expansion bursts, normalized by the value for each source, were in the range 0.26–1.4 (Fig. 10, upper panel). We note that the PRE burst sample includes those with marginal evidence for radius-expansion (see §2.3). The burst with the smallest normalized peak flux in this class was from 4U 1636536 (0.26), although (as discussed by Galloway et al., 2006) the spectral variation in this burst may have instead arisen from the same mechanism that gave rise to the double-peaked bursts (see §A.8). We also plot the distribution of the normalized fluence, , in Fig. 10, lower panel. There was much greater overlap in between the distributions for the PRE and non-PRE bursts, than for the normalized peak flux. The 18 bursts with the highest normalized fluence (, not shown) all exhibited PRE. These include extreme radius expansion bursts from 4U 1724307 (§A.15) and 4U 2129+12 (§A.47), amongst others, as well as the very long bursts from GX 17+2 (§A.38).
Several factors apparently contribute to the scatter in peak PRE burst fluxes for individual sources. Faint, symmetric bursts observed from 4U 174637 and GRS 1747312 appeared to exhibit PRE but reached significantly sub-Eddington fluxes. The three PRE bursts from 4U 174637 reached peak fluxes of (4.5–. At the estimated distance to the host cluster NGC 6441 ( kpc; Kuulkers et al., 2003) this flux indicates a peak isotropic luminosity of (7–, well below the expected luminosity even for the (lower) Eddington limit for H-rich material, (equation 7 with ). Similar results were found for this source by Sztajno et al. (1987). One of the three PRE bursts observed from GRS 1747312 was similarly underluminous, reaching a peak flux of which (for the estimated distance to Terzan 6 of 9.5 kpc; Kuulkers et al., 2003) corresponds to an isotropic luminosity of . Two other PRE bursts were detected from GRS 1747312, both reaching much higher peak fluxes of 1.7 and . The corresponding range of PRE burst peak fluxes for this source was the highest of all the sources in the RXTE sample, with the brightest PRE burst 2.2 times brighter than the faintest. The spectral evolution of these faint PRE bursts was distinctly different from the PRE bursts from other sources (see also Galloway et al., 2004a, 2008), and resembled that of the short, anomalous bursts from Cyg X-2 (see §A.48). These underluminous PRE bursts define a distinct class of bursts which appear to exhibit radius expansion but which reach peak luminosities significantly below the Eddington limit, in some cases resulting in a much greater variation in their peak fluxes (for an individual source) than for typical PRE bursts.
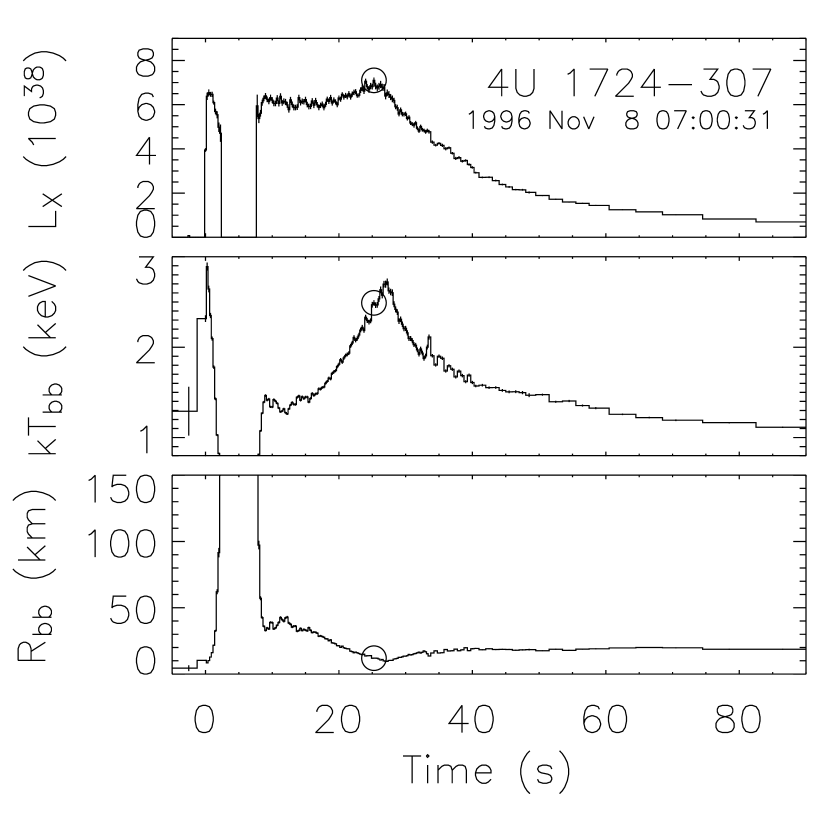
Conversely, the intrinsically most energetic events, exemplified by bursts from 4U 2129+12 and 4U 1724307, tended to reach luminosities significantly in excess of the Eddington luminosity . These “giant” bursts exhibited unusually large fluences (and hence long timescales), and expansion to large radii (e.g. Fig. 11). At the estimated distances to the host globular clusters of these sources, the implied isotropic luminosities reached by these bursts were a factor of 2–3 larger than the expected Eddington luminosity, even for . As with the other PRE bursts, we applied the gravitational redshift correction in equation 7 with . If the photospheric radius is larger at the flux maximum, the intrinsic luminosity will be overestimated. However, examination of the spectral evolution of these two bursts indicates that the blackbody radius at flux maximum is similar to the asymptotic value in the tail of the burst. Thus, the redshift correction alone cannot explain the unusually large peak fluxes. Apparently super-Eddington PRE bursts were also observed from EXO 1745248 (see §A.31). One explanation for these discrepancies is that the globular cluster distances are systematically in error, and the sources are actually significantly closer (note the smaller distance estimate for the host cluster of EXO 1745248 made by Ortolani et al., 2007). However, extremely energetic bursts observed from sources outside globular clusters reached peak fluxes significantly larger than less energetic PRE bursts from the same source. For example, the brightest burst from GRS 1741.92853, on 1996 July, reached a peak flux 25% higher than the next brightest PRE burst. The 1996 July burst had , compared to the next highest value of 23. Similarly, the first burst observed by RXTE from the millisecond accretion-powered pulsar HETE J1900.12455 had a peak flux 20% greater than the second, again with a much higher compared to 15.
While these two factors played a significant role in the overall variation of PRE burst peak fluxes, smaller variations were observed from other sources without notably under- or over-luminous PRE bursts. For example, the peak PRE burst fluxes from 4U 172834 were normally distributed with a fractional standard deviation of 10%. In that case quasi-periodic variations on a timescale of d were observed in both the peak PRE burst flux, and the persistent intensity (measured by the RXTE/ASM; Galloway et al., 2003). The residual variation of for subsets of bursts observed close together in time (once the d trend was subtracted) was consistent with the measurement uncertainties, indicating that the intrinsic variation of the peak PRE burst luminosity is actually %. A correlation between the PRE burst fluence and the peak flux was attributed to reprocessing of the burst flux in the accretion disk. The fraction of reprocessed flux may vary from burst to burst as a result of varying projected area of the disk, through precession of the disk possibly accompanied by radiation-induced warping. That the persistent flux from 4U 172834 varies quasi-periodically on a similar time scale to is qualitatively consistent with such a cause. It is plausible that comparable variations due to similar mechanisms may be present in other sources.
Even assuming that the mean peak flux of PRE bursts approaches the characteristic value for each source, it is to be expected that the Eddington luminosities for different sources are not precisely the same. Inconsistencies are perhaps most likely to arise from variations in the composition of the photosphere (the hydrogen fraction, , in equation 7); the neutron star masses, as well as variations in the typical maximum radius reached during the PRE episodes (which affects the gravitational redshift, and hence the observed ) may also contribute. We can be most confident regarding the photospheric composition in the ultracompact sources like 3A 1820303 (§A.39), where the lack of hydrogen in the mass donor rules out any significant abundance in the photosphere. However, for the majority of bursting sources the uncertainty in is the dominant uncertainty in (for example) distance determination via PRE bursts. One clue as to the composition is provided by the PRE bursts from 4U 1636536, which reach peak fluxes that are bimodally distributed Galloway et al. (2006). The majority of PRE bursts were distributed normally about the mean with standard deviation of 7.6%, but two much fainter bursts reached a peak flux a factor of 1.7 lower than the mean for the remainder. This distribution suggests that the brighter bursts reach (approximately) , while the two faint bursts reach . This observation implies that, although the source is likely accreting H-rich material (see §3.3), once a sufficiently strong burst is triggered, this material is ejected or driven to sufficiently large radii that it become transparent to X-ray photons (see also Sugimoto et al., 1984). The fainter bursts may then arise when the maximum luminosity exceeds , but is not sufficient to drive off the outer layers. If the behaviour of 4U 1636536 is typical, then bursts reaching are rare, and we can assume with reasonable confidence that PRE bursts from sources accreting mixed H/He fuel reach the Eddington limit for essentially pure-He material.
We estimated the distances to the sources with PRE bursts by substituting the values into equation 7. Since the peak flux was typically reached at the end of the PRE episode, when we presume that the photosphere had touched down on the NS surface again (see e.g. Fig. 2), we corrected for gravitational redshift at the surface of a canonical neutron star with km and . We also estimated the upper limits to the distance for sources without PRE bursts, from the maximum peak flux of the non-PRE bursts. We made no correction for the apparently super-Eddington luminosity of bursts from 4U 2129+12 and 4U 1724307, or the apparently sub-Eddington luminosity of bursts from 4U 174637 and GRS 1747312. We did however calculate the distance to 4U 1636536 in Table 10 in a different manner to the other sources with PRE bursts. The listed is for the high peak flux () PRE bursts, and we used this value to calculate the distance assuming that those bursts reach (fifth column). For the distance estimates in columns 4 and 6, with , we used only the two PRE bursts with much lower peak fluxes. The two distances are consistent. The distances and limits for all burst sources are both listed in Table 10.
3.2. Burst duration, time scales and fuel composition
The characteristic time scale has long served as a measure of the lightcurve shape for bursts observed with low-sensitivity instruments, and the marked differences in the burning rates for H and He fuel suggests that should also indicate approximately the fuel composition. Here we investigate the variation in as a function of accretion rate, with a view to identifying systematic trends in the fuel composition. Using the high signal-to-noise data obtained with RXTE, we are also able to test this measure against precisely-determined values. For those bursts with sufficient data to resolve the lightcurve, we measured additional decay constant(s) , for the single or broken double exponential fits to the flux evolution111111 We note that in general and were roughly proportional; for the 1092 bursts with both and , (rms 2.8 s). Similarly for those bursts with two exponential fits and s, we found (rms 8.7 s). A second exponential decay segment was required for fits of 811 of the 1107 lightcurves with sufficient time-resolved flux measurements to fit at all.
As has been observed in earlier burst samples (e.g. van Paradijs et al., 1988a), the burst timescales vary significantly, and systematically, with accretion rate, measured by proxy in the first instance as the rescaled persistent flux (Fig. 12, upper panel). We plot only bursts from sources with at least one radius-expansion burst (and hence a measurement of ) and where the persistent flux measurements are not confused by other nearby sources; this subsample is referred to as (Table 7). The RXTE data extend the range in over which timescales can be measured, with extremely short ( s) bursts from Cyg X-2 and both short and very long bursts from GX 17+2 observed at . The long bursts from GX 17+2 are perhaps the most difficult to understand in the framework of standard burst theory (e.g. Kuulkers et al., 2002), but even the short bursts from this source and Cyg X-2 are not predicted by ignition models at . At this accretion rate both H- and He-burning should be stable, so that the fuel will burn as it is accreted (e.g. Heger et al., 2007b). The long () bursts from 4U 174637 at are the next most signficant outliers from the main sample. These bursts were detected during 1998 November when the source was in a relatively high state; there are other peculiarities regarding the energetics and recurrence times (see §A.32). We omit 75 bursts from sample in Fig. 12, top panel, because the or values (or the presence or absence of radius expansion) could not be determined.

As we discuss further in §3.3, the two main groups of outliers circled in the top panel of Fig. 12 arise from burst sources (4U 174637, GX 17+2 and Cyg X-2) whose behaviour deviates significantly from the broader population. Excluding the bursts from these sources reveals trends for the remaining bursts which differ for the PRE and non-PRE bursts. For the remaining 246 PRE bursts (including those with marginal evidence for radius expansion; see §2.3) the time scale was anticorrelated with (Spearman’s , significant to ). For the 436 non-PRE bursts from sample , we found a substantially weaker correlation, with , and slightly lower significance. The distribution of -values for the non-PRE bursts in the range –0.1 was particularly broad, with short and long bursts almost equally prevalent. The position on the color-color diagram, , for the subset of sources (Table 7) for which this parameter can be measured (see §2.1), provides an alternative measure of which helps to understand the variations of with . Here we find instead a significant anticorrelation between and for the 285 non-PRE bursts (, ) but no relation for the 163 PRE bursts (Fig. 12, lower panel). We omit 50 events due to inadequately measured lightcurves and/or values. The long 1998 November bursts from 4U 174637 again fall in a relatively unpopulated region of the - diagram, this time with in the range 2.3–2.8. The other bursts with similar are all observed at much lower values, .
With a few exceptions, the RXTE data confirms the previously-observed decrease (on average) of the burst timescale with increasing accretion rate (measured by proxy as either or ). However, there are a number of aspects which must be considered for a complete understanding of the data. First, why does the degree of anticorrelation of with accretion rate (by proxy) differ for the radius-expansion and non-radius expansion bursts? Selection effects may play a role, and in particular the lack of correlation between and for the PRE bursts may be partly attributed to the fact that almost half (72 of the 163) PRE bursts with values are from 4U 172834. The burst time scales for this source are consistently short ( s on average; see §A.16), possibly because the accreted fuel is largely helium (see also §3.3). Furthermore, approximately half of the 20 PRE bursts with large -values (including the three bursts with the largest values) are from sources that do not have measured values (and thus are not part of sample ).
However, there are also systematic effects which bias the measured -values for radius-expansion bursts. As also noted by van Paradijs et al. (1988a), regardless of how large is the fluence for a PRE burst, cannot significantly exceed the Eddington flux for the source, so that the value will be lower than it would have been were the peak flux not limited. Furthermore, since for the PRE bursts, , . Thus, the anticorrelation between and observed for the PRE bursts is largely a consequence of an anticorrelation (of almost identical degree) between the normalised fluence and (, significant to ; see also §3.5). For the PRE bursts, the decay constants , for the exponential fits to the burst lightcurve following the peak likely serve as a less biased measure of the burst time scale, and we find flatter correlations between both and (, ) and and (, ) for the PRE bursts.

Second, how do we account for the bimodal -distribution for the non-radius expansion bursts at moderately high (Fig. 12, top panel)? This bimodality is illustrated clearly in Fig. 13 (top panel), which also indicates that the timescale for bursts observed at –0.06 is related to position on the color-color diagram (lower panel). Bursts with s are largely detected in observations with , while the short bursts that are also observed at tend to have . Observations with correspond to a source in the “island” state (e.g. Fig. 4), where the accretion rate is thought to be substantially below that measured when sources are in the “banana” state, with . Thus, the bimodal distribution of the values indicates a mix of high and low accretion rates, despite the narrow range of . This “degeneracy” between and is illustrated clearly in the plot of as a function of , averaged over each observation (Fig. 6). In the range –0.06, is essentially uncorrelated with , and can span almost the full extent of the color-color diagram, –2.5. Thus, the bimodal distribution of -values for bursts at high likely does not reflect a bimodal distribution of timescales at high accretion rates, further supporting the general trend of decreasing burst timescale as a function of .
With the RXTE sample we are in a position to directly compare the measured and values. From our sample of burst pairs for which we can precisely measure (see Table 7), we found that and were strongly anticorrelated. All the bursts with have (Fig. 14), which indicates H-poor bursts in which the H-fraction may have been reduced by steady burning between bursts. For those bursts we find a median , although we also measured values up to 1600 (for Ser X-1). For the bursts with , we instead found a median . Perhaps most significantly, none of the bursts with low had ; this highlights the relatively long time required to burn hydrogen via the rp-process.

When combined with the general trend to shorter timescales with increasing accretion rate that we deduced from the distributions of -values, this result argues for a decreasing H-fraction in bursts as accretion rate increases, particularly above and (). As we shall see in §3.4 and 3.5, this trend is difficult to reconcile with theoretical predictions of burst behaviour as a function of accretion rate.
3.3. Diversity of burst behaviour
It is well known that the burst behaviour of GX 17+2 and Cyg X-2 deviate substantially from that of the majority of burst sources, and this has also been clear from our analysis so far. Here we address the question of whether that remaining majority of burst sources also exhibit significant source-to-source variations in their burst recurrence time and energetics as a function of accretion rate, or instead follow a consistent global behavior. Previous authors analysing burst samples assembled from multiple sources have generally concluded that “all sources have the same global burst behavior as a function of luminosity” (Cornelisse et al. 2003; see also van Paradijs et al. 1988a). However, with the more detailed burst measurements possible with the RXTE sample, it is worthwhile revisiting this issue.

We begin by comparing the two systems with the most bursts in the RXTE sample, 4U 1636536 and 4U 172834. Bursts were observed from both sources over a similar range of inferred accretion rate, of about an order of magnitude in (in the range 0.01–0.1) and over the full extent of the color-color diagrams (see Fig. 4; –2.5). The properties of the bursts from 4U 172834 varied little over these ranges, with consistently short ( s) bursts that tended to exhibit radius-expansion. On the other hand, 4U 1636536 showed both short and long bursts (with up to 30 s), with the latter observed preferentially at low accretion rates (whether measured by or ). For 4U 172834 the burst rate (calculated as described in §2.5) increased with , as we expect theoretically, although only at the level; but no systematic variation was measured with (Fig. 15). For 4U 1636536, on the other hand, we found a steep decrease in burst rate with increasing and , significant to greater than in either case. We also found inconsistent behaviour in the measured -values for these two sources as a function of / (Fig. 15, lower panels). For 4U 172834 we consistently found in the range 60–130 (with measurements from burst pairs all ), and no significant variation as a function of or ( significance in either case). For 4U 1636536, increased significantly with both and , increasing from to between 600 and 700 (significance of in either case). These two sources thus exhibit very different patterns of variation in burst timescale, rate and energetics, over the same range of inferred accretion rate.
One plausible reason for the difference in burst behaviours between these two sources is a different accreted composition. The consistently fast rises and decays, and low -values for bursts from 4U 172834 indicate a consistently low H-fraction at ignition. In contrast, the at-times long bursts (with ) observed from 4U 1636536 are characteristic of fuel with a high proportion of H. While the H-fraction may be reduced by steady burning prior to ignition, so that the value inferred from the burst timescale is a lower limit on the accreted composition , the absence of long bursts characteristic of mixed H/He burning at any or value in 4U 172834121212The “long” bursts that have been observed at times from 4U 172834 exhibit radius-expansion (e.g Basinska et al., 1984), and are quite distinct from the long bursts which indicate mixed H/He fuel (exemplified by bursts from GS 182624) which do not exhibit radius expansion. suggests that the H-fraction in the accreted fuel from that source is significantly lower than in 4U 1636536. The burst properties of 4U 172834 in fact closely resemble those of the ultracompact system 3A 1820303 Cumming (2003), indicating that it may also be a He accretor. For 3A 1820303 the measured orbital period of 11.4 min Stella et al. (1987) requires that the counterpart be evolved and H-poor; in contrast, the orbital period for 4U 172834 is unknown.
With orbital periods known for only about 1/3 of bursters in our sample, it is possible that pure He-accretors may make up a non-neglible fraction of the remaining sources. If H-rich and H-poor accretors indeed exhibit systematically different patterns of burst rate and energetics, as is suggested by the comparison of 4U 1636536 and 4U 172834, it is clearly important to discriminate between these two types of sources when combining bursts. In the absence of a measured orbital period, the only other guide to the composition of the accreted material in the remaining sources is the properties of the bursts. Consequently, we have reviewed the burst properties of each of the sources contributing to our sample, and attempted to classify them phenomenologically. The sources, ordered by burst behaviour, are listed in Table 6, along with pertinent burst parameters. Below we briefly describe the salient points of each of these classifications.
| Category | Source | (hr)aaA representative burst recurrence time, which we take as the shortest burst interval longer than 0.9 hr (thus excluding the atypical short recurrence time bursts). | bbValues in parentheses refer to flux (in units of ) rather than , for those sources with no radius-expansion bursts and thus no measured value of . | ||
|---|---|---|---|---|---|
| very low | EXO 0748676 | 2.1 | |||
| frequent long bursts | 4U 132362 | 1.8 | () | ||
| XTE J1710281 | 3.3 | ||||
| 2E 1742.92929 | 1.1 | ||||
| XTE J1814338 | 1.7 | () | |||
| very low | 4U 091954 | 13, 21 | 1.5, 13 | ||
| “giant” bursts | 1724307 | 6.3–44 | 4.8–54 | ||
| SLX 1735269 | () | ||||
| GRS 1741.92853 | 4.0–65 | ||||
| GRS 1747312 | 5.4–110 | 1.2–160 | |||
| XB 1832330 | ccWhere only one burst was observed, and it exhibited radius expansion, by definition. | ||||
| 4U 2129+12 | ccWhere only one burst was observed, and it exhibited radius expansion, by definition. | 0.0074 | |||
| low | 4U 051340 | ||||
| infrequent short bursts | SAX J1808.43658 | 21 | |||
| HETE J1900.12455 | 16, 51 | 15, 55 | |||
| moderate | 1M 0836425 | 2.0 | () | ||
| frequent long bursts | KS 1731260ddFor KS 173126, we separate out the regular bursts from the less regular (and generally shorter) bursts at higher and lower values of | 2.5 | |||
| GS 182624 | 3.2 | () | |||
| large range | 4U 160852 | 3.5 | 5.6–29 | 0.19–24 | 0.0034–0.10 |
| inhomogeneous bursts | 4U 1636536 | 1.0 | 3.2–32 | 0.13–22 | 0.020–0.15 |
| MXB 1659298 | 1.8 | 3.0–30 | 2.4–9.5 | 0.025–0.055 | |
| 4U 170544 | 0.91 | 4.6–28 | 0.84–11 | 0.017–0.21 | |
| KS 1731260ddFor KS 173126, we separate out the regular bursts from the less regular (and generally shorter) bursts at higher and lower values of | 6.4 | 4.4–20 | 1.6–15 | 0.0087–0.13 | |
| Aql X-1 | 3.5 | 6.0–34 | 2.1–17 | 0.00011–0.11 | |
| moderate–high | 4U 1702429 | 4.5 | |||
| consistently short bursts | XTE J1709267 | () | |||
| 4U 172834 | 1.8 | ||||
| 4U 173544 | 1.1 | ||||
| 3A 1820303 | |||||
| Ser X-1 | 8.0 | ||||
| 4U 1916053 | 6.2 | ||||
| high | GX 17+2 | 5.8 | 5.3, 90–360 | 3.5, 90–370 | |
| Cyg X-2 | 1.0 | ||||
| anomalous | EXO 1745248 | 2.9 | |||
| 4U 174637 | 1.0 | ||||
Note. — Sources not listed have insufficient bursts to assign them to any of the categories described.
| Sample | No. of | Total | |
|---|---|---|---|
| labelaaThroughout this paper we refer to these combined samples as “label” where label corresponds to the selection criteria, as detailed in column 2; see §2.5. | DescriptionbbWe list the sources and/or the selection criteria for each sample, followed by the total number of sources in parentheses. | bursts | duration (Ms) |
| all sources with at least one radius-expansion burst (see Table 10); 4U 051340, EXO 0748676, 4U 091954, 4U 160852, 4U 1636536, MXB 1659298, 4U 1702429, 4U 170544, XTE J1710281, 4U 1724307, 4U 172834, KS 1731260, 4U 173544, GX 3+1, SAX J1748.92021, EXO 1745248, 4U 174637, SAX J1750.82900, GRS 1747312, SAX J1808.43658, GX 17+2, 3A 1820303, XB 1832330, Ser X-1, HETE J1900.12455, Aql X-1, 4U 1916053, 4U 2129+12, Cyg X-2 (29) | 834 | 22.9 | |
| all sources with well-defined color-color diagrams (see §2.1); 4U 160852, 4U 1636536, 4U 1702429, 4U 170544, 4U 172834, KS 1731260, 4U 174637, Aql X-1, XTE J2123058 (9) | 523 | 10.24 | |
| sources with burst interval measurements from closely-spaced burst pairs; EXO 0748676, 1M 0836425, 4U 125469, 4U 132362, 4U 160852, 4U 1636536, 4U 1702429, 4U 170544, XTE J1710281, XTE J1723376, 4U 172834, KS 1731260, 4U 173544, XTE J1739285, SAX J1748.92021, EXO 1745248, 4U 174637, SAX J1808.43658, XTE J1814338, GX 17+2, GS 182624, 4U 1916053, XTE J2123058 (23) | 209 | ||
| sources in with consistently fast bursts (see Table 6); 4U 1702429, 4U 172834, 4U 173544, 3A 1820303, Ser X-1, 4U 1916053 (6) | 190 | 4.95 | |
| sources in excluding sources in , “anomalous” bursters EXO 1745248, 4U 174637, and high- bursters GX 17+2 and Cyg X-2 (see Table 6; 19) | 525 | 14.5 | |
| sources in with consistently fast bursts (see Table 6); 4U 1702429, 4U 172834 (2) | 153 | 2.64 | |
| all sources in excluding sources in and “anomalous” burster 4U 174637 (6) | 340 | 7.15 | |
| all sources with detected burst oscillations (see §3.7); 4U 160852, 4U 1636536, MXB 1659298, 4U 1702429, 4U 172834, KS 1731290, GRS 1741.92853, 1A 1744361, SAX J1750.82900, SAX J1808.43658, XTE J1814338, 4U 1916053 and Aql X-1 (13) | 529 | 12.46 |
Frequent long bursts at very low
These sources accrete at % and below, and exhibit weak, frequent (1–3 hr), long ( s) bursts with characteristic of mixed H/He fuel. Orbital periods are a few hours, where known. These sources also characteristically show short ( min) recurrence time bursts (see §3.8.2).
“Giant” bursts
These sources accrete at similar to the above group, but instead are characterised by extremely energetic bursts, likely arising from a thick layer of pure He built up over days. All the bursts exhibit radius-expansion, and large -values (from the large fluence) but fast rise times. Either H/He accretors in which the accreted H is exhausted via stable burning before ignition, or systems accreting from H-poor donors may give rise to such bursts. Orbital periods are hr, for the two systems where they are known; in contrast, 4U 091954 is a candidate ultracompact based on its optical properties.
Infrequent short bursts at low
Also at comparable values as the previous two cases, these sources typically exhibit fast rise, moderately energetic radius-expansion bursts with characteristic d and . Sources which exhibit giant bursts commonly also exhibit weaker bursts in this category. For two cases where the orbital periods are known they are min and thus likely accrete mixed H/He, so that steady H-burning is required to reduce or exhaust the accreted H prior to burst ignition. This may not be the case for 4U 051340, which is a candidate ultracompact.
Frequent long bursts at moderate
Recurrence times are in the range 2–6 hr, varying inversely with , and the long rise times s, –40, (as well as detailed model comparisons in the case of GS 182624; see §A.40) indicate He-ignition in mixed H/He fuel where the H-fraction is reduced (but not exhausted) by steady burning between the bursts.
Inhomogeneous bursts
These transients routinely span a wide range of during their outbursts. As a result, the burst properties are highly variable, at times frequent and long, or infrequent and short, depending upon the . Orbital periods are a few hours or longer, where known; none of the examples are thought to be ultracompact.
Consistently short bursts
These sources accrete at levels comparable to the previous group, but consistently show short () bursts with characteristic of pure or almost-pure He fuel. In the case of 3A 182030 and 4U 1916053, this is consistent with their ultracompact nature, although this explanation manifestly does not explain 4U 173544 ( hr; see also §3.8.3).
High
Both these sources accrete at , and show either very short bursts (in the case of Cyg X-2) or a mix of short and extremely long (GX 17+2) bursts. These bursts represent a considerable challenge for conventional burst theory (see als §3.8.1).
Anomalous bursts
Two relatively prolific bursters exhibit burst properties that defy explanation via conventional burst theory. During it’s July 2000 outburst, EXO 1745248 exhibited either frequent, long bursts (accompanied by dramatic dipping behaviour), or infrequent, short bursts, at roughly comparable . 4U 174637 exhibits faint, frequent, regular long bursts at moderate to high levels, which are interrupted at times by short bursts with evidence for radius expansion (see also §3.8.3).
It is not unexpected that the first four categories listed in Table 6 can each be identified with one of the theoretically-predicted cases of thermonuclear ignition (see Table 1.1). The frequent, long bursts at low- have properties consistent with unstable H-ignition (case 3); infrequent short and giant bursts with unstable He-ignition in H-poor fuel (case 2); and the frequent long bursts at moderate with unstable He-ignition in a mixed H/He environment (case 1). Additionally, the “inhomogeneous” burst samples are typically accumulated from transients spanning a large range of , and thus likely arise from a mixture of ignition types (although in each case including at times bursts characteristic of mixed H/He fuel). In contrast, the frequent short bursts at moderate (–0.2) cannot be reconciled with the theoretically expected ignition conditions if H is present in the accreted fuel at approximately solar mass fractions . These bursts all exhibit fast rise and decay times, despite (at times) insufficiently short recurrence times to exhaust the accreted H between bursts (unless the accreted H-fraction is sub-solar, or the CNO abundance above solar). Similarly, neither the bursts at high nor the two anomalous cases in Table 6 can be easily identified with any of the theoretically-predicted regimes of bursting.
In summary, by comparing the two most prolific bursters in our sample, we found compelling evidence that the burst behaviour as a function of or is not the same for all sources. In a broader sense, the behaviour of most sources appears consistent with one or more of the ignition cases expected theoretically for sources accreting mixed H/He. However, there are several notable exceptions, the most numerous of which is a significant subgroup of sources which consistently exhibit short bursts, some of which are confirmed ultracompact systems and thus He-accretors.
3.4. Burst frequency as a function of accretion rate
Assuming ideal conditions (accretion over a constant fraction of the neutron star surface, complete consumption of the accreted fuel) and neglecting transitions between H- and He-ignition, we expect the burst rate to increase monotonically with . This increase may be expected to continue until the temperature in the fuel layer reaches the point where He burning is stabilized (expected around ), at which time bursts will essentially cease. This pattern is expected both for sources accreting mixed H/He or pure He, although in the former case steady H-burning between bursts contributes to higher temperatures in the fuel layer, and thus earlier ignition (and more frequent bursts). In order to compare the theoretical predictions with observations, here we construct burst rate curves as a function of accretion rate (by proxy) for various subsamples of the bursts detected by RXTE.
As a consequence of the diversity in burst behaviour established for sources contributing to the RXTE sample (see §3.3), we further restrict the sample of bursters from which we draw our bursts to construct global curves of burst rate as a function of accretion rate. The presence at times of bursts with long timescales for sources in the first five categories listed in Table 6 leads us to conclude that these sources accrete mixed H/He, and thus can be expected to follow broadly consistent patterns of ignition as a function of accretion rate. We also include in this sample, which we refer to as (or , when binning on ) the bursts from unclassified systems (which likely do not contribute sufficient bursts or observations to significantly affect the combined sample). We exclude the sources which exhibit frequent short bursts, bursts at high , and the two anomalous cases in Table 6. We hypothesize that, like 3A 1820303, the sources which consistently show short bursts likely accrete H-poor material, and these systems form a comparison sample which we refer to as (or ; see Table 7 for full descriptions of each of these groups). We further exclude from both samples, bursts with very short recurrence times hr. Such bursts occur episodically (see §3.8.2), and do not reflect the “steady” burst behaviour we are attempting to measure here.

The mean burst rate for the remaining sample of 464 bursts from 19 sources contributing to increased with throughout the range –0.03 (Fig. 16, top panel). The peak rate of 0.3 hr-1 was reached at a corresponding to a source luminosity of 0.5–. At the lowest accretion rates the mean burst rate was between 0.04–0.05 hr-1. Above the mean burst rate decreased steadily, reaching a minimum of 0.08 hr-1 in the range –0.3. No bursts from were observed at ; the only sources bursting at such high persistent flux levels are GX 17+2 and Cyg X-2, which were excluded from this sample. The mean burst rate for these two sources was also in the range 0.07–0.08 hr-1.
For comparison, the source which most closely matches predictions of theoretical burst models for mixed H/He ignition is GS 182624, also known as the “Clocked Burster” due to its consistently regular bursts (e.g. Ubertini et al. 1999, Cornelisse et al. 2003; see also §A.40). The burst recurrence time measured by RXTE between 1997–2002 decreased significantly in response to a gradually increasing persistent flux (i.e. ), proportional to Galloway et al. (2004b). This behaviour is very close to that expected assuming and unvarying fuel composition, and a subsequent comparison of burst lightcurves with time-dependent model predictions confirm an accreted composition of roughly solar metallicity and H-fraction Heger et al. (2007a). Without any radius-expansion bursts or a well-defined color-color diagram, or values could not be calculated for GS 182624, and thus the bursts detected from this source by RXTE were not included in sample or . Instead, we estimated the equivalent based on a distance of 6 kpc (derived from comparisons to theoretical ignition models Galloway et al., 2004b) at 0.06–, which corresponds to –0.06 (taking into account the mean bolometric correction of ). The corresponding variation of burst rate with observed for GS 182624 between 1998–2002 is shown as the solid line in Fig. 16 (top panel). Surprisingly, the mean burst rate calculated for sources contributing to reaches a maximum below the -range in which GS 182624 is active, and in that range the mean rate is in fact decreasing rather than increasing. This discrepancy may be attributed to a systematic error in our calculation of for GS 182624, relative to the sources comprising . On the other hand, the only other source exhibiting long, regular bursts similar to those of GS 182624 in the RXTE sample, KS 173126, also does so at .
As we have seen with the variation in burst timescales (§3.2), the degeneracy between and may affect the averaged burst rates in the range –0.06. The bursts which fall in this range arise from observations both from the “island” state (with ) and the “banana” state (; see Fig. 6). The variation of burst rate as a function of indicates that these two groups of bursts have substantially different intrinsic bursting frequencies (Fig. 16, lower panel), along with their different timescales (Fig. 13). The long burst timescales suggest that GS 182624 is likely persistently in the “island” state, and the discrepancy between the properties of those bursts and the broader sample in Fig. 16 can be explained if most of the sources contributing to in the range –0.06 are instead in the “banana” state. This is supported by the distribution of observation-averaged values (for the sources contributing to ) with in this range; 83% of the observations (79% in terms of exposure) have . Further highlighting the different intrinsic burst rates is the fact that the number of bursts arising from “island” and “banana” state observations with –0.06 is approximately equal, despite the factor of 4 greater exposure in the latter spectral state. Thus, it is likely that the burst rates in the range –0.06 presented here are measured from a sample of bursts with larger dispersion in accretion rate than their -values would suggest. For this reason, apparent variations in the burst rates in this -range must be viewed with some caution. On the other hand, the burst rates at higher and lower are perhaps likely to be measured from more uniform samples, since and are more closely related in those ranges (see Fig. 6).
The variation of burst rate with for 183 bursts from 6 sources with consistently short bursts (sample , excluding the short-recurrence time bursts; Table 7) was similar, reaching a comparable maximum rate although at a slightly higher –0.05 (Figure 16). Above , however, the burst rate dropped much more rapidly by a factor of . Between and 0.05 the burst rate for sample is decreasing, while for sample is increasing. While the variation is only for a few bins in these data, we note that this result is also found from the data from 4U 1636536 and 4U 172834 alone (see Fig. 15).
The recurrence time for closely-spaced burst pairs from (see Table 7), interpreted as an instantaneous burst rate (as distinct from a steady recurrence time measured from a series of regular bursts), are also shown in Fig. 16. Below , the rates measured from burst pairs were mostly in the range 0.2–0.6 hr-1, well above the mean value; these bursts are all from EXO 0748676. That the mean burst rate underestimates the burst pair measurements from EXO 0748676 may be due to the inclusion in this sample of several pure He-accretors in the low- “giant” burst class (see §3.3). These sources are likely to exhibit a much lower burst rate in this range, since H-ignition is not possible. For most of the burst pair measurements, the recurrence times for the sources in are systematically shorter than for the sources in at comparable -values. This is consistent with the expected effects of steady H-burning to boost the burst rates. Between and 0.03 the rates measured from burst pairs roughly follow the mean values, although above there are also measurements substantially in excess of the mean. Sources with frequent ( hr-1) bursts in the range include 4U 1636536, 4U 170544, and SAX J1748.92021; in addition, bursts from EXO 1745248 and 4U 174637 (which are omitted from Fig. 16) also fall in this region of the plot.
We note that there are selection biases in towards regular bursts with short recurrence times, and in particular it is difficult to unambiguously measure burst intervals hr from RXTE observations (SAX J1808.43658 is a notable exception; see §A.36). As a result, the locus of measurements from burst pairs cannot be considered representative. Nevertheless, the extent to which the instantaneous burst rates can deviate from the ensemble-averaged value clearly indicates that the statistical errors on the binned measurements significantly underestimate the true extent of variation.
We also show the burst rate as a function of for the sources for which it was possible to parametrize the color-color diagram, and excluding the anomalous sources and short-recurrence time bursts, in Fig. 16 (lower panel). As with sample , we divided the bursts from sample based on evidence for mixed H/He bursts (5 sources totalling 259 bursts, sample ), or lack thereof (2 sources, with 131 bursts, sample ; see Table 7). The burst rate for sample reached a maximum of hr-1 around , and subsequently decreased steadily as increased further to around 0.04 hr-1. In contrast, the bursts from sample exhibited no steady trend over the range in in which they were observed. As with the mean rates as a function of , the rates measured from burst pairs as a function of correspond only loosely to the mean values. We found variations of up to an order of magnitude compared to the mean rates over all sources. The rates largely reflect the behavior of 4U 1636536 and 4U 172834, which make up the dominant fraction within each sample (Fig. 15).
It is important to keep in mind that the bursts contributing to the mean rates in the lower panel of Fig 16 are a subset of those contributing to the upper panel, since the values could only be determined for a limited number of sources (see §2.1). There are systematic biases which could be introduced by comparing samples from different groups of bursts, particularly if one or a few sources dominate the samples. However, when binned instead as a function of , samples and exhibited the same variations as found for samples and , used for the top panel of Fig. 16. Thus, the two samples have comparable variation in burst rate as a function of .
3.5. Burst energetics and the role of steady burning
The burst rate is perhaps the most straightforward quantity relating to thermonuclear burning to measure, but the possibility of systematic variations in the burst properties as a function of means that the rate alone does not uniquely identify the nature of ignition or the composition of the burst fuel. We have previously seen how the rescaled fluence, , of PRE bursts is anticorrelated with (using as a proxy), leading to an anticorrelation between the burst timescale and (sec. §3.2). This anticorrelation indicates unambiguously that, at least for the PRE bursts, the amount of fuel at ignition becomes systematically less at higher . Since at higher we expect hotter temperatures in the fuel layer and hence earlier ignition, this effect is qualitatively consistent with theory. This trend should be independent of whether or not the burst exhibited radius-expansion; however, we find no systematic correlation for the non-PRE bursts in between and .
This discrepancy between theoretical expectations and our observations mainly arises from the already-established diversity of our burst sample. Burst sources accreting mixed H/He may ignite via unstable H- or He-burning, while He-accretors may only ignite via He burning. For sample , comprising bursts from sources with consistently short bursts (which we infer primarily accrete He; Table 6), we find that is significantly anticorrelated with both for PRE and non-PRE bursts. However, for sample , which includes bursts from sources which we infer are accreting mixed H/He, we find a significant anticorrelation of with (as before) for the PRE bursts, but a significant correlation instead for the non-PRE bursts. That is, for the non-PRE bursts from the sources which we infer are accreting mixed H/He, the bursts tend to get more intense as increases. This correlation arises due to the presence at low of bursts arising from H-ignition. Such events, typified by the bursts from EXO 0748676 (see §A.2), tend to be much more frequent and less energetic than bursts at higher values. As increases through the range where ignition transitions from H- to He-burning (case 3 to case 2), the burst recurrence time increases dramatically, so that the amount of fuel accumulated also increases, leading to much more energetic bursts. This transition, we suggest, is the dominant effect leading to the correlation between and uniquely for the non-PRE bursts from H-rich accretors. It is still possible that within each of the two ignition regimes, the theoretically-expected anticorrelation between and may be measured. However, the much smaller ranges of spanned by each bursting regime, coupled with the difficulty discriminating between the two types of bursts (and the scatter on the measured values at any value) likely make such measurements unfeasible.

Neither the burst rates, nor the burst fluences, allow us to unambiguously determine the energetics of the bursts. For this reason, we here study the variation in the ratio of burst to persistent fluence, , calculated for burst pairs and as a mean for the combined samples (see §2.5). The binned for reached a minimum of between –0.03, where the burst rate also reached a maximum (Fig. 17, upper panel). Below this range varied between 80 and 250, while above increased steadily up to . For the sources with consistently short bursts (sample ), exhibited rather different behaviour, below and increasing by more than an order of magnitude abruptly above. This step coincides with an abrupt drop in the burst rate (Fig. 16). As with the burst rates, the measurements from burst pairs differed from the binned values by almost an order of magnitude. There was no discernable trend in the -values as a function of , although the values for the members of were systematically larger in the mean than those of members of . While agreed well with the -measurements from burst pairs for SAX J1808.43658 at , was significantly in excess of the measured values for EXO 0748676 just below. We also show in the upper panel of Fig. 17 the measurements from GS 182624, which were found to decrease only slightly as the persistent flux increased Galloway et al. (2004b). This decrease was attributed to steady H-burning between bursts, which results in a slightly higher fuel H-fraction (and hence lower ) as the burst interval decreases. The -values calculated for sample (which does not include GS 182624) was somewhat in excess of the values for that source. The variation of with for sample is rather more consistent between the mean and the measurements from burst pairs (Fig. 17, lower panel), with increasing rather steadily from to as increases from 1 to 2.5. Below , . For the bursts from , both the and burst pair measurements varied only slightly, between and 150. The mean -values for GX 17+2 and Cyg X-2 (not shown in Fig. 17) were in the range 1300–4100.
It is worthwhile here to revisit the earlier measurements of as a function of accretion rate from a large sample of bursts by van Paradijs et al. (1988a). Those authors found a steep increase in from to as increased from 0.01 to 0.3. The earlier sample was assembled from measurements in the literature from individual burst sources, including representatives from both the and samples (Table 7). As we have seen, these two samples exhibit systematically different burst behavior as a function of accretion rate; several sources in sample are established ultracompact systems, and thus primarily He-accretors, while those in exhibit bursts with profiles indicative of mixed H/He fuel and thus must also accrete hydrogen. In particular, measurements of for bursts from EXO 0748676 at solely determined the low- end of the van Paradijs et al. (1988a) correlation. These bursts likely arise from H-ignition of mixed H/He fuel (i.e. case 1); were 3A 1820303 (another source contributing to the correlation) accreting at , it is not possible that it would exhibit bursts with , since 3A 1820303 likely accretes pure He from a white dwarf donor (see §A.39). Thus, we suggest that the van Paradijs et al. (1988a) correlation is not indicative of burst behavior for any one source over the range of spanned by the combined sample. In contrast, assuming our subsamples and contain sources with similar accreted composition (as the similarity in burst behavior suggests), the corresponding variation of burst rate and should go closer to reflecting realistic behavior for any of the sources in each sample.
The variation of as a function of differs for the two samples and , to a greater extent than the burst rates. This result lends additional credence to the hypothesis that the sources contributing to (see Table 7) exhibit systematically different burst energetics. That the mean and burst pair -values for these bursts are consistently supports the hypothesis that they are primarily He-accretors, as we inferred from the consistently short burst timescales. We note that the range of is significantly different when binning on or , which may be attributed to the small number of sources contributing to the latter sample; only two sources (4U 1702429 and 4U 172834) with consistently short bursts have measured values in our sample (see Table 7; in contrast, includes 190 bursts from 6 sources). Perhaps the most remarkable feature of the variation in this sample is the significant increase observed at . Even for pure-He fuel, the maximum value expected is 120 (equation 6), strongly suggesting that some of the assumptions that enter into the theoretical prediction break down. Values of indicate that some process is reducing the energy generated from unstable burning. One candidate is the onset of steady He-burning, although is an accretion rate approximately an order-of-magnitude lower than where this phenomenon is predicted to commence theoretically.
3.6. Boundaries of theoretical ignition regimes
Having measured the variation in the properties of bursts observed by RXTE as a function of accretion rate (by proxy), we here assess how well these measurements agree with theoretical predictions. In particular, while the transition values of between the different ignition regimes are generally well-reproduced by different numerical models, there have been few attempts to verify the values observationally.
We consider the bursts from sources contributing to sample (Table 7) only, since it is these systems that we infer accrete the mixed H/He that makes the full range of ignition cases possible. Ignition in mixed H/He (cases 1 and 3) and pure He (case 2) environments are distinguishable by small and large values of respectively, since H nuclei contribute much more energy per nucleon than He (i.e. is larger in equation 6). The transition to steady H-burning (between case 3 and 2), expected around , should thus result in an increase in , as well as a drop in burst rate. Examination of Figs. 16 and 17 indicate that these expectations are largely unmet. The burst rate for sample increases steadily from –0.03 (Fig. 16), with no evidence for a decrease. We do measure an increase in the binned values between the two bins spanning , but the increase is only weakly significant. Furthermore, the lower value is still , which is too large for H-rich fuel.
Given the systematic uncertainties affecting , it is possible that the transtion may take place somewhat above or below . Indeed, the burst rate begins to decrease above , corresponding to 0.5– (based on our uncertainties in the true value of the Eddington limit; equation 7). This decrease has also been observed in the behaviour of individual sources observed with BeppoSAX/WFC Cornelisse et al. (2003), and was attributed by those authors to the onset of stable H burning (i.e. the transition between case 3 to case 2 of Fujimoto et al., 1981). There are several reasons why the RXTE data do not support this conclusion. First, there is no increase in measured coincidental with the decrease in burst rate. In fact, between –0.06 the averaged values is constant to within the errors, possibly decreasing slightly (Fig. 17). Second, at the transition between case 3 and case 2 ignition we would expect to see only a local decrease in the burst rate, followed by a subsequent increase at even higher accretion rates, through the transition from case 2 to case 1. Instead, the burst rate continues to decrease, up to the limit of at which we observe sources contributing to . Third, detailed analysis of bursts from individual sources confirm the presence of case 2 or case 1 bursts at comparable or lower accretion rates. Analysis of bursts from SAX J1808.43658 at indicates that the burst fuel is largely He, so that the accreted hydrogen must have been significantly reduced by steady burning prior to the bursts (i.e. case 2 ignition; Galloway & Cumming, 2006). Additionally, analysis of the bursts from GS 182624 which occur in the range –0.06 confirm that these arise from case 1 ignition (Galloway et al. 2004a; see also in ’t Zand et al. 2004c), suggesting that the transition from case 3 to case 2 must take place at lower ().
The position on the color-color diagram (for those sources where it can be measured, i.e. members of ; Table 7) offers an alternative explanation for the decrease in burst rate above which may not be related to the nuclear physics. The diversity of the burst timescales and values for bursts at discussed in §3.2, coupled with the intrinsic variation in burst rates in the “island” () and “banana” () states (Fig. 16, lower panel) indicates that this decrease in burst rate is related to the transition between these spectral states. That is, above , we increasingly (although not exclusively) find sources with , where the bursts are much less frequent. While there may be a thermonuclear component to this transition, it is not consistent with the expected behaviour through the transition between cases 3 and 2 (or cases 2 and 1, for that matter). As has been suggested earlier, the bursts occuring above may be the “delayed mixed bursts” predicted by Narayan & Heyl (2003) to occur at higher accretion rates than case 1 bursts (see e.g. Table 1.1). The tendency for short burst timescales indicates H-poor fuel, which may constrain the extent of steady burning prior to ignition in this regime.
It seems more probable that the transition in burst behaviour around is related to the onset (or increase in the rate) of stable He-burning, even though the inferred accretion rate is much lower than predicted from models (e.g van Paradijs et al., 1988a). Millihertz oscillations observed around the transition to the “banana” state Revnivtsev et al. (2001) may arise from marginally stable burning, as suggested by Heger et al. (2007b). If fuel is accreted onto some fraction of the neutron star at a high enough (local) rate for He-burning to stabilize, the onto the remainder may be small enough to still permit infrequent bursts, where the accreted H-fraction is reduced by stable H-burning. The variation in effective gravity between the equator and higher latitudes, which depends upon the spin rate, may also contribute to such effects Cooper & Narayan (2007b). A detailed study linking the predictions of theoretical models for accretion (e.g. Inogamov & Sunyaev, 1999) with time-dependent ignition models (e.g. Woosley et al., 2004; Narayan & Heyl, 2003) may help to establish the validity of this hypothesis.
Another contributing factor to the lack of evidence for a transition between case 3 and 2 is the apparent scarcity of bursts from H-ignition at low . At the lowest accretion rates a significant fraction of sources exhibit infrequent, energetic bursts consistent with largely-He fuel (Table 6). It is difficult to determine whether these bursts arise from case 2 ignition following exhaustion of the accreted hydrogen by steady burning, as in the case of SAX J1808.43658 (Galloway & Cumming, 2006, see also §A.36), or from accretion and ignition of intrinsically H-poor material, as might be expected from an ultracompact system with an evolved donor. Indeed, several of the systems with the lowest accretion rates are candidate ultracompacts, based on their X-ray to optical luminosity, or other indirect evidence.
The effect of including these systems in (which we have done in the absence of evidence precluding them accreting hydrogen) will be to reduce the mean burst rate at low , and correspondingly increase the mean -values. The best candidates for H-ignition bursts in this -range are the frequent, weak, long-timescale bursts from EXO 0748676 observed in the range –0.01. Many of these bursts are separated by no more than 5 hours, and both the long timescales and the typical indicate a large fraction of H in the burst fuel. While these properties are also shared by case 1 ignition bursts, exemplified by bursts from GS 182624, the bursts from EXO 0748676 are around a factor of 4 less intense (on average). As suggested by Boirin et al. (2007), and earlier by Gottwald et al. (1986), these properties indicate that the long bursts are ignited by unstable hydrogen ignition131313Bursts arising from H-ignition and occurring as often as every few hours are predicted by the two-zone model of Cooper & Narayan (2007a), although in this accretion rate range the He is expected to accumulate and ignite in an energetic pure-He burst every few days. Such intense He-bursts interrupting trains of much weaker and more frequent H-bursts have not been observed to date. (i.e. case 3), rather than helium ignition (which likely triggers the PRE bursts from this source at higher ; e.g. Wolff et al., 2005). As we have seen, the individual rates for burst pairs from EXO 0748676 are in excess of the mean rate (Fig. 16), and the measured -values lower than the mean (Fig. 17). We note that the upper -limit for the long-timescale, frequent bursts from EXO 0748676 is , which coincides with the -value at which the short, infrequent case 2 bursts from SAX J1808.43658 are observed (e.g. Fig. 16). If the case 3 ignition is indeed giving rise to the bursts from EXO 0748676, and these sources can be taken as representative of the larger group which accrete mixed H/He fuel, then this appears to confirm the prediction that the case 3 to 2 transition takes place close to .
While the case 3 to 2 transition may be expected to result in a fairly sharp change in burst properties with , the case 2 to 1 likely is more subtle. As the accretion rate increases, the burst recurrence time is expected to steadily decrease so that eventually steady H-burning will not be complete, leading to a corresponding steady decrease in . This is roughly as observed. The burst rate increases steadily up to , while the mean -value decreases (on average) from at down to 70 at . The bursts from GS 182624 represent the best-studied example of case 1 ignition, and exhibit a steep (almost 1:1; Galloway et al., 2004b) increase in burst rate with persistent flux (i.e. ) although with only a slight decrease in . The mean -values for sample show little variation in the inferred -range in which the bursts from GS 182624 are observed, but are systematically higher by a factor of (Fig. 17). However, as already noted, the mean burst rate above is already decreasing, likely because the observations in this range are a mix of “island” () and “banana” () states, with their corresponding distinctive bursting behaviours. We conclude that the transition from case 2 to case 1 burning occurs between and 0.03, but note that the weakness of this transition likely makes any further improvement on observational constraints unlikely.
The variations of burst rate and with are even harder to match with theoretical expectations. With fewer sources contributing to sample (Table 7), the measured variations in are on a much coarser grid of binned values. Similar to the burst rate dependence on , we seen a maximum rate at , and lower burst rates above and below. However, the data permits only one bin at lower values of , so that we do not resolve the increase to reach the maximum burst rate, and likely masking the transition between case 3 and case 2. Also at this accretion rate, reaches a minimum of , increasing above and below. It seems likely that the transition to case 1 ignition must also take place near , since the subsequent decrease in burst rate and increase in as increases through is the same effect largely contributing to the drop in burst rates above . As we have discussed above, these variations in burst rate likely do not correspond to one of the transitions in ignition conditions that are predicted by models.
3.7. Millisecond oscillations
Millisecond oscillations during thermonuclear bursts have been detected to date in 16 sources, including two that also show persistent pulsations (SAX J1808.43658 and XTE J1814338). The properties of burst oscillations detected in RXTE data have previously been described in detail in a number of papers (see Strohmayer & Bildsten, 2006, for a review). Several key questions remain. One of the most puzzling aspects is that the burst oscillations are frequently detectable far into the decays of the bursts (Strohmayer et al., 1997a; Smith et al., 1997). During the burst rise, it is expected that the burning will spread to cover the entire surface of the neutron star, so that subsequent anisotropy in the emission will be small. Nevertheless, oscillations are frequently detectable as much as 10 s after the burst peak. Thus, for the combined sample of bursts observed with RXTE, we have examined the detectability of oscillations, where in the bursts they occur, and the properties of the bursts that produce them.

We list the numbers of bursts with oscillations by source in Table 8. We omitted from our search the bursts from EXO 0748676, in which the 45 Hz oscillations cannot be detected in single bursts Villarreal & Strohmayer (2004), and the burst from IGR J17191281 Markwardt et al. (2007), for which the RXTE data was not available at the time of writing. We searched for, but did not detect, oscillations near the 377.3 Hz spin frequency in the two bursts observed by RXTE from the millisecond pulsar, HETE J1900.12455. The persistent pulsations in this system were present only in the first two months of the outburst, which is unusual Galloway et al. (2007). No bursts have been detected by RXTE from 4U 0614+09, preventing a search for the oscillations detected in that source by Swift/BAT Strohmayer et al. (2008).
| Number | Number of Oscillations | ||||||||||
|---|---|---|---|---|---|---|---|---|---|---|---|
| Source | (Hz) | of BurstsaaThe first number is the number of bursts observed from this source, while the number in parentheses is the number of bursts which were searched for oscillations. | Total | 4 s | Rise | RP | Peak | PD | Decay | RD | Cont. |
| 4U 1916053 | 270 | 14(14) | 1 | 1 | |||||||
| with PRE | 12(12) | 0 | |||||||||
| XTE J1814338bbThese sources also exhibit persistent pulsations at the listed frequency. Note that for XTE J1814338, only the last burst observed exhibited marginal evidence for PRE. | 314 | 28(28) | 28 | 3 | 2 | 3 | 20 | ||||
| 4U 1702429 | 329 | 47(47) | 35 | 1 | 2 | 5 | 3 | 9 | 8 | 2 | 5 |
| with PRE | 5(5) | 0 | |||||||||
| 4U 172834 | 363 | 106(104) | 38 | 2 | 5 | 1 | 3 | 11 | 9 | 1 | 6 |
| with PRE | 69(69) | 18 | 2 | 1 | 6 | 8 | 1 | ||||
| SAX J1808.43658bbThese sources also exhibit persistent pulsations at the listed frequency. Note that for XTE J1814338, only the last burst observed exhibited marginal evidence for PRE. | 401 | 6(4) | 4 | 1 | 1 | 2 | |||||
| KS 1731260 | 524 | 27(27) | 4 | 1 | 1 | 1 | 1 | ||||
| with PRE | 4(4) | 3 | 1 | 1 | 1 | ||||||
| 1A 1744361 | 530 | 1(1) | 1 | 1 | |||||||
| Aql X-1 | 549 | 57(55) | 6 | 1 | 2 | 3 | |||||
| with PRE | 9(9) | 5 | 2 | 3 | |||||||
| MXB 1659298 | 567 | 26(25) | 6 | 1 | 2 | 1 | 1 | 1 | |||
| with PRE | 12(12) | 5 | 1 | 2 | 1 | 1 | |||||
| 4U 1636536 | 581 | 172(169) | 59 | 6 | 5 | 5 | 1 | 4 | 17 | 12 | 9 |
| with PRE | 46(45) | 38 | 4 | 1 | 4 | 14 | 10 | 5 | |||
| GRS 1741.92853ccWe attributed bursts with oscillations from the Galactic center region to this source; see §B.6. | 589 | 8(8) | 2 | 2 | |||||||
| with PRE | 6(6) | 2 | 2 | ||||||||
| SAX J1750.82900 | 601 | 4(4) | 3 | 2 | 1 | ||||||
| with PRE | 2(2) | 2 | 1 | 1 | |||||||
| 4U 160852 | 620 | 31(29) | 7 | 2 | 1 | 1 | 1 | 2 | |||
| with PRE | 12(12) | 7 | 2 | 1 | 1 | 1 | 2 | ||||
| Total | 527(515) | 194 | 15 | 21 | 12 | 11 | 31 | 38 | 23 | 43 | |
| PRE | 182(180) | 84 | 9 | 8 | 0 | 3 | 15 | 26 | 15 | 8 | |
Excluding the millisecond pulsars (and sources with less than five bursts total), between 7 and 75% of bursts exhibited oscillations. Two of the millisecond pulsars with bursts (SAX J1808.43658 and XTE J1814314) exhibited oscillations in every burst detected; oscillations were detected in the only burst from 1A 1744361, and three of the four bursts observed from SAX J1750.82900. Excluding these four, the next most frequent burst oscillation source was 4U 1702429, with 75% of bursts exhibiting oscillations.
Also in Table 8 we summarize the number of bursts with oscillations detected in each part of the lightcurve: rise (R), peak (P) and decay (D; see §2.4). For many non-PRE bursts, oscillations were detected in all three phases, i.e. continuously (last column). In the 4th column of Table 8 we list the number of bursts for which we detected no oscillations in the 1-s FFTs, but did detect oscillations in the 4-s intervals. We found that 55% of the oscillations were detected in the rises of bursts, 54% in the peaks, 75% in the tails, and 8% only in the 4-s FFTs (for which the location could not be determined). Even if all the oscillations which were only detected in the 4-s FFTs were actually present only during the burst rise or peak, the most frequent part of the burst in which oscillations were detected remains the burst tail. We confirm the tendency for oscillations to be interrupted during the burst peak for radius-expansion bursts; of the bursts with oscillations detected at the peak, 69% were from non-radius expansion bursts. Oscillations in the burst rise were also preferentially (65%) found in non-radius expansion bursts; only oscillations in the burst tails showed no preference for the presence or absence of radius expansion, being equally prevalent in each type of burst.
In Table 9 we list the properties of the oscillations for individual bursts from each source: where the oscillations occurred, the maximum (Leahy-normalized) power, and the mean % rms. The bursts in which oscillations were detected were unremarkable, compared to the entire sample. We found oscillations in long bursts (with up to 39.4 s), as well as in short; although the proportion of bursts with exhibiting oscillations was, at 25%, rather lower than the proportion of all bursts (from the burst oscillation sources) with (43%). Previously we saw that bursts with are associated with small -values, indicating mixed H/He fuel (see §3.2). The distribution of burst separations were similar; the shortest wait time to a burst with oscillations was 13.6 min; the shortest overall for any of the bursts from sources with oscillations was between min (see §3.8.2). The distribution of (normalized) fluences was also similar. Histograms of the amplitudes of the detected oscillations are displayed by source in Figure 18 (solid lines). The rms amplitudes are typically between 2% and 20%, with a median amplitude of about 5%. When oscillations were not detected, we report the upper limit on the rms amplitude from the first 5 s of the decay in Figure 18 (dotted lines). The median values of the upper limits are typically lower than the detected oscillations. This indicates that the failure to detect oscillations is generally a consequence of lower amplitudes, and not a result of a lack of sensitivity in the relevant bursts.
It has previously been noted that the properties of the bursts in which strong oscillations are observed are correlated with the spin frequency of the neutron star (Muno et al., 2000; Franco, 2001; van Straaten et al., 2001; Muno et al., 2001). Specifically, Muno et al. (2001) claimed, based on the sample of bursts taken through 2001 March, that oscillations appeared preferentially in bursts without radius expansion when the neutron star was spinning slowly (400 Hz), and in bursts with radius expansion when the neutron star was spinning rapidly (400 Hz). A re-examination of the trend using data taken through 2003 August revealed that the division between slow and rapid rotators was not absolute, in that oscillations were often observed in bursts both with and without radius expansion in both classes of source (Muno et al., 2004). This is also evident in our full sample from Table 8, in which only 18% of oscillations appear in bursts with radius expansion in slow rotators, whereas 73% of oscillations in bursts with radius expansion in rapid rotators. Therefore, a trend is present, although the properties of the bursts are not the only determinant of whether or not oscillations occur.

We point out that the sample of burst sources with slow ( Hz) oscillations, i.e. 4U 1916053, XTE J1814338, 4U 1702429 and 4U 172834 is dominated by sources for which we consistently observe short bursts (see Table 6). Conversely, none of the burst sources with consistently short bursts are included in the sample of systems with fast ( Hz) oscillations. Thus, the previously identified differences between these systems may instead arise from the mechanisms that give rise to consistently short bursts (or not). Indeed, Muno et al. (2004) suggested that the apparent trend was actually a consequence of two separate tendencies as sources move through the color-color diagram (): first, that oscillations tend to be observed only at high , and second, that as increased, bursts from slow rotators (i.e. predominantly sources with consistently short bursts) became less likely to exhibit radius expansion, whereas bursts from rapid rotators (sources with evidence for mixed H/He accretion) became more likely to exhibit radius expansion. For the six sources with well-defined values (Fig. 4), we display when oscillations are detected in Figure 19. Of the bursts with 1.75, 57% exhibited oscillations. However, only 9% of bursts with 1.75 exhibited oscillations. In fact, 87% of the bursts with oscillations had 1.75. Similar trends are seen for both slow and fast rotators. We found no comparable preference for oscillations to be found in bursts at high , likely a consequence of the degeneracy between this parameter and , as explored earlier (see §3.4; §2.1).

We examine when radius expansion occurs in Figure 20. If we consider all six neutron stars with values (regardless of their rotational period), radius expansion is found in 41% of bursts with 1.75 and 35% of bursts with 1.75. However, if we separate the sources into slow and fast rotators, we find different behaviors. For slow rotators (i.e. 4U 1702429 and 4U 172834), radius expansion is found in only 24% of bursts with 1.75, but in 86% of bursts with 1.75. For fast rotators, the opposite trend is evident: radius expansion is found in 49% of bursts with 1.75, but in only 6% of bursts with 1.75. The vast majority (90%) of radius-expansion bursts occurred in the fast rotators at 1.75, while for the slow rotators, only 23% did.
The predominance of systems with consistently short bursts in the group of slow ( Hz) oscillators suggests a link between the physics which determines the burst properties and which sets the neutron-star rotation speed. We consider two possible explanations. As suggested previously, it is plausible that the slow rotators are largely accreting from degenerate companions, so that the accreted material is H-deficient. XTE J1814338, at 314 Hz a slow oscillator, is the exception to this rule, since it shows consistently long, weak bursts possibly arising from H-ignition of mixed H/He fuel (see §A.37). If this explanation is valid, it would suggest that a difference in the evolutionary history of systems with and without degenerate companions leads to the difference in spin periods.
The second possibility is that the rotation rate of the neutron stars determines how much mixing occurs in the layer of accreted fuel before a burst, and hence the burst properties. Piro & Bildsten (2007) suggested that the larger shear between the disk and the neutron star for the slow rotators may cause the CNO-rich ashes to be mixed into freshly accreted fuel, leading to rapid exhaustion of the accreted H via steady hot-CNO burning and hence helium-rich (i.e. consistently fast) bursts. Since the group of fast oscillators contains at least one ultracompact source (4U 1916053), this cannot be the only mechanism. Additional numerical calculations are required to trace the evolution in composition of the fuel layer for mixed H/He accretion, in order to establish whether this effect should occur, and whether it is strong enough to contribute significantly the trends above. Observationally, determining the orbital periods for the remaining systems with slow spins (4U 1702429 and 4U 172834) can also help to constrain the accreted composition and hence the role of shear-mediated mixing.
3.8. Theoretical challenges
Having attempted a genuinely global study of burst behaviour covering all the sources observed by RXTE, it is appropriate to summarise here the remaining phenomenological aspects revealed by our analysis which cannot be understood by current burst theories.
3.8.1 Bursts at high accretion rate
There are two aspects to the thermonuclear burst behaviour observed at high accretion rates (above , or ) that are contrary to the predictions of burst theory. First, that the burst rate decreases for most sources with increasing , despite the more rapid accumulation of fuel. Previous authors have noted that the bursts tend to become shorter as well as less frequent as the apparent increases (e.g. Bildsten, 2000). The picture from the RXTE sample is somewhat more complex. Within a range of accretion rates (–0.06) there is a mix of frequent (long) and infrequent (short) bursts. These bursts largely appear to be distinguished by the source’s position on the color-color diagram at the time they occur; the long bursts occur when the sources are still in the “island” state (, where it can be measured) while the short bursts occur only once the sources transition to the “banana” state (). It is appealing to try to resolve the degeneracy between the accretion rate parametrisation based on or , e.g. by referring to our set of derived bolometric correction values (; see §2.1). However, we find that is inversely correlated with (for the observations where we measure both parameters), so that attempting to correct the (which is based on the 2.5–25 keV flux) using this parameter will tend to increase the degree of overlap between the two samples, rather than separate them.
Second, although bursting behaviour ceases for most sources at (), there are two well-known outliers exhibiting at times frequent burst behaviour at much higher , GX 17+2 and Cyg X-2. The range of spanned by both the bursts and observations provides some additional details here. No bursts are observed at all in the range –0.7; GX 17+2 and Cyg X-2 are the only sources with bursts at . The gap in observations is smaller, although still present; no sources are observed at –0.5. We note that there is no shortage of sources accreting at these levels (e.g. Grimm et al., 2002), although it is difficult to completely rule out selection effects since we only analyse sources that are already known as burst sources.
The bursts that are observed at are intriguing in themselves. The RXTE sample provides examples of both the very short (down to s) bursts from both GX 17+2 and Cyg X-2, and the intermediate-duration bursts (–400 s) from GX 17+2 (cf. with Taam et al., 1996). It is puzzling why the bursts are so diverse at these accretion rates, let alone why they occur at all. Furthermore, GX 17+2 also exhibits superbursts in ’t Zand et al. (2004b), while as yet no such long or intermediate duration bursts have been detected from Cyg X-2.
3.8.2 “Double” bursts
Thermonuclear bursts with extremely short recurrence times (“double” or ”prompt” bursts) have long presented a challenge to our understanding of burst physics. Their recurrence times of min are too short for sufficient fuel to accumulate to allow ignition by unstable thermonuclear burning (see e.g. Lewin et al., 1993). The “classical” double burst consists of an initial bright burst followed by a much fainter secondary, although bursts which are more similar in fluence are also observed, as well as groups of three closely-spaced bursts (e.g. Boirin et al., 2007). We note also that there are cases of weak burst-like events preceding otherwise normal bursts by only a few seconds, in 4U 1636536 (see §A.8), 4U 1709267 (see §A.12 and Jonker et al., 2004) and SAX J1808.43658 Bhattacharyya & Strohmayer (2007). It is presently not clear whether these events can be attributed to the same processes that give rise to burst pairs with separations min, or if they are instead more closely related to double-peaked bursts (see e.g. Bhattacharyya & Strohmayer, 2006b).
An important question is whether the fuel for the second (and possible subsequent) bursts is residual material left unburnt by the first, or if it is newly accreted. Studies of bursts from EXO 0748676 indicate that some small fraction (%) of the fuel left over from the previous burst contributes to the fluence of subsequent bursts Gottwald et al. (1987), perhaps reaching ignition by mixing deeper into the NS atmosphere Woosley & Weaver (1984); Fujimoto et al. (1987).
Good instrumental sensitivity is required to detect the typically much weaker secondary (and sometimes, tertiary) events, and the RXTE sample likely contains a greater number of multiple events than other large burst samples (for example, accumulated by the BeppoSAX/WFC). We plot the small- end of the burst recurrence time distribution in Fig. 21. The distribution exhibits a deficit of bursts with –100 min; the 90 min satellite orbit falls within this range, so that this deficit is likely a consequence of the regular data gaps (the typical duty cycle is ) due to Earth occultations of bursters. For min it is possible that intermediate bursts have been missed in data gaps, so that the actual recurrence time is or the measured value. The burst pairs with min occur within uninterrupted stretches of data, and so we extract this subsample for our analysis. These burst pairs occurred primarily while the normalised persistent flux of the bursting sources were between and 0.04, or (where it could be measured; see §2.1) and 1.8.

Of the 84 pairs of bursts with min, we found 12 cases where short-recurrence time pairs immediately followed each other, i.e. a series of three bursts with recurrence times min. Sources contributing to this subset were 4U 170544, Rapid Burster (4), 4U 1636536, 2E 1742.92929 (3), EXO 1745248 and 4U 160852. Previously, the only known source to exhibit triple bursts was EXO 0748676 Boirin et al. (2007). We also found two instances of four bursts following each other, all with recurrence times min, from the Rapid Burster and 4U 1636536.
We show the ratio of fluences for pairs of bursts with min in Fig. 22. For 10 pairs we could not measure the fluence for one of the pairs, because either the high time-resolution data did not cover the burst, or because the burst was too faint to reliably measure the fluence. The pair of bursts with possibly the shortest measured recurrence time, from 4U 160852 on 2001 November 21 15:29, fell into the former category; we can only limit the separation to min, since we did not observe the start of the second burst due to an unexplained data gap. The next shortest recurrence time was from a pair of bursts from EXO 0748676 on 2003 July 1, at 6.5 min. With examples of three and even four bursts following each other in rapid succession, we hypothesize that many of the short-recurrence time bursts from the Rapid Burster may be type-II rather than type-I bursts. In few of the short-recurrence time bursts from the Rapid Burster are temperature variations present at a significance of more than , so that we cannot confirm these bursts as arising from thermonuclear ignition. For the remaining sources, less than half of the bursts have highly significant () temperature variations. However, the distribution of burst intervals and fluence ratios is not substantially different if only these bursts are considered. A significant fraction of the bursts pairs had comparable fluences, i.e. . The “classical” double bursts were observed with fluence ratios of , and recurrence times of –18 min (Fig. 22).

Double bursts appear to occur primarily (but not exclusively) from sources in the H-ignition (i.e. case 1) regime (the best example is EXO 0748676; see Boirin et al., 2007). Furthermore, we note only one case of a burst with min from a source with consistently short bursts (see Table 6); this burst is from 4U 173544, with min. This system incidentally has a measured orbital period of 4.65 hr (see §A.20), and an optical counterpart remarkably similar to that of 4U 1636536 (e.g. Augusteijn et al., 1998) extending to the presence of emission lines from hydrogen. Thus, it seems that short ( min) recurrence time bursts are strongly associated with sources accreting hydrogen. While the effects of sedimentation at low accretion rates Peng et al. (2007) may play a role in igniting these bursts, it remains to be seen if a more general mechanism can explain the properties of the entire sample.
3.8.3 Individual sources: 4U 174637 and 4U 173544
There are a number of sources whose behaviour revealed by the RXTE observations is particularly difficult to reconcile with current burst theory. 4U 174637, the bright bursting source in NGC 6441 (see §A.32), exhibits long, regular bursts characteristic of mixed H/He burning at apparent accretion rates (parametrised by either or ; see §2.1) much higher than other sources (Fig. 12). Sequences of regular bursts are occasionally interrupted by short, radius-expansion bursts which are “out of phase”, but which do not otherwise interrupt the regular bursting Galloway et al. (2004a). The unusually high persistent flux and X-ray colors, as well as the burst behaviour, suggest that at times two sources may be bursting independently in the cluster; however, the lack of spatial information with RXTE makes it impossible to localise the two types of bursts. Additionally, the peak flux of the (apparent) radius-expansion bursts are significantly below the expected Eddington flux for a source at the cluster distance (see §3.1). The spectral variation of these bursts were substantially different to the other radius-expansion bursts in the RXTE sample, and may require an alternative explanation. On the other hand, the atypical spectral evolution could be due to geometrical effects common to sources with high system inclination, as inferred from the presence of regular X-ray dips attributed to partial eclipses of the neutron star by material in the outer disk (e.g. Galloway et al., 2008).
4U 173544 displayed episodic bursting behaviour in the RXTE observations with consistently short bursts (rise times s, and mean timescale of s) characteristic of very H-poor fuel (see Table 6; §A.20). A significant fraction (73%) of these bursts exhibited radius-expansion. The other sources identified as consistently exhibiting short bursts are either known ultracompacts (3A 182030, 4U 1916053) or do not have a measured orbital period (4U 172834, 4U 1702429; Table 6). 4U 173544 is thus the only system in the group with a measured orbital period longer than 80 min; at 4.65 hr, it is the only system for which the companion, V926 Sco, may be a main-sequence star and thus likely accretes mixed H/He. While the spectral properties of the optical counterpart to 4U173544 bear a remarkable similarity to 4U 1636536 (e.g. Augusteijn et al., 1998), the burst behaviour is markedly different; 4U 1636536 shows at times long bursts, characteristic of H-rich fuel. The inferred accretion rate of 4U 173544 at 0.16– was typically higher than that of 4U 1636536, so that the short bursts may arise via the transition to short bursts noted by Bildsten (2000) to take place at . However, the bursts were instead frequent, with typical recurrence times of hr, rather than the longer recurrence times usually associated with the burst behaviour transition at high flux. The difference may instead be related to some physical property of the sources, perhaps the spin rate. Piro & Bildsten (2007) studied the effect of mixing between the fuel and ash layers in He-accretors, and found that these layers will become mixed preferentially at high accretion rates and low spin frequencies. Low neutron-star spin frequency results in a larger shear between the innermost Keplerian-orbiting material in the disk and the neutron-star surface, enhancing mixing. The ashes are rich in CNO nuclei, which if mixed into the fuel layer may allow more rapid exhaustion of the accreted hydrogen through steady burning, perhaps explaining the short time-scales of bursts from 4U173544. While the spin rate in 4U 1636536 has been measured at 581 Hz via burst oscillations (§3.7; see also Strohmayer & Markwardt, 2002), no such oscillations or pulsations have been detected in 4U173544. The latter source may be a key system for future studies of rotation-mediated mixing and its effect on thermonuclear bursts.
4. Summary
We have analysed a catalog of 1187 thermonuclear (type-I) bursts observed by RXTE from 48 LMXBs. Although this is not the largest sample of bursts accumulated by recent satellite missions, the unparalleled PCA sensitivity offers the best signal-to-noise for precise measurements of burst flux, fluence, time-scales, and energetics. Furthermore, the high timing capability has allowed a detailed comparison of the properties of the bursts and the burst oscillations, where detected. Below we summarize the principal results obtained through our study of this sample.
-
•
We found significant variations in the peak flux of photospheric radius-expansion bursts from most sources with more than one such burst. Most of the variation can be attributed to three of the four distinct classes of PRE bursts; faint symmetric bursts, reaching significantly sub-Eddington luminosities (in 4U 174637 and GRS 1747312); rare, hydrogen-limited bursts (much weaker than normal PRE bursts, which likely reach the He limit) in 4U 1636536; and “giant” bursts reaching fluxes in excess of the Eddington limit, typically the most energetic bursts from each source.
-
•
We confirmed the previously-observed tendency for the burst duration (the ratio of the burst fluence to peak flux) to decrease as accretion rate increases (e.g. van Paradijs et al., 1988a). However, short-duration bursts at high persistent flux levels were largely associated with sources in the “banana” spectral state, while long-duration bursts were still observed at similar persistent flux levels so long as sources remained in the “island” state. As expected from time-dependent ignition models, the timescale was strongly anticorrelated with the ratio of integrated persistent flux to burst fluence , and in particular all bursts with had (indicating He-rich fuel), while the majority of bursts with had (H-rich).
-
•
We found evidence for distinctly different burst behavior as a function of accretion rate for the two sources with the largest number of bursts in the sample, 4U 1636536 and 4U 172834. The absence of long-duration bursts indicative of H-rich fuel for 4U 172834 (for which the orbital period is presently unknown) suggests that the neutron star accretes primarily He from an evolved donor. 4U 1636536 on the other hand likely accretes mixed H/He at roughly solar fraction, like the majority of LMXBs. We identified a number of systems with consistently fast bursts, similar to 4U 172834, including two known ultracompact systems: 3A 1820303 and 4U 1916053, and several candidates.
-
•
We estimated the mean burst rates as a function of accretion rate, using our qualitative assessment of the burst properties as a guide for combining samples of bursts from different sources. We measured a peak burst rate of around 0.3 hr-1 at () for the systems with evidence for mixed H/He accretion, and approximately the same maximum rate but at a factor of two larger for the sources with consistently fast bursts. The burst rates for both samples decreased significantly above this level, more steeply for the latter group. The derease in burst rate appears largely due to an increasing fraction of observations with X-ray colors consistent with the “banana” spectral state; this transition does not appear to be related to any of the theoretically predicted ignition regimes. Above , only bursts from GX 17+2 and Cyg X-2 were detected.
-
•
We also calculated the mean -values for the two samples of bursts as a function of accretion rate. We found significantly different behaviour for sources which exhibit at times long bursts and sources with consistently fast bursts, further evidence for the different compositions of the accreted material in those two classes. Perhaps most remarkably, for the systems with consistently fast bursts, we found an abrupt increase in the mean of an order of magnitude (from to ) at persistent flux levels corresponding to an accretion rate of .
-
•
We qualitatively compared the observed burst behaviour with that predicted by numerical models, and found that the mean behaviour largely did not match theoretical expectations. Even so, we identified bursts in the sample corresponding to all three cases of ignition presently understood theoretically, as described by Fujimoto et al. (1981). Case 3 bursts, likely arising from H-igition of mixed H/He fuel were observed from EXO 0748676 in a range of accretion rate –1% . At slightly higher (–5% ) we found infrequent, short bursts from SAX J1808.43658 which have been shown to arise from He-ignition in an almost pure He enviroment (case 2). These observations support the theoretical prediction that the boundary between case 3 and 2 occurs around 1% . Earlier analyses of the long bursts from GS 182624 confirm that these arise from He-ignition in a H/He environment, where the burst interval is insufficient to completely exhaust the accreted H (case 1).
-
•
We analysed all the public bursts from the sources with burst oscillations and characterised them based on the peak rms and where in the burst the oscillations are present. The previously noted differences in the type of bursts which exhibit oscillations between the “fast” ( Hz) and “slow” ( Hz) oscillators may be related to the prevalence of systems with consistently fast bursts (for which we infer H-poor accretion) in the latter group. The data suggests a correspondence between the neutron star spin and the composition of the accreted fuel (and hence the evolutionary history).
-
•
Finally, we identified four key theoretical challenges highlighted by the results of our analyses. First, the decrease in burst rate above , as well as the occurrence of bursts at , remain significant puzzles. Second, we examined the properties of bursts with very short ( min) recurrence times, identifying burst triplets (three closely-spaced bursts) from five systems, and instances of burst quadruplets from two systems. Such bursts appear to occur only in those systems with evidence for mixed H/He fuel, particularly at very low accretion rates. Third, the “out-of-phase” bursts in 4U 174637, which also exhibit radius-expansion at sub-Eddington luminosities. Fourth, the case of 4U 173544, a system with a 4.65 hr orbital period (and hence not ultracompact) as well as an optical spectrum similar to that of 4U 1636536, and yet consistently short bursts, similar to known and suspected ultracompacts including 3A 1820303.
Appendix A Thermonuclear (type-I) burst sources
In the following sections we discuss the properties of bursts observed from individual sources by RXTE. For each source, we list the Galactic coordinates, the first detection of thermonuclear bursts, the system properties (where known, including the orbital period and the method of measurement and the presence of burst oscillations), and the properties of bursts from previous observations. We describe the type of source (persistent/transient) and the persistent flux history throughout RXTE’s lifetime. The burst properties include the presence of PRE and/or double peaked bursts, the corresponding distance, recurrence times and -values, whether short recurrence time bursts have been found, and the patterns of variation in burst properties with source state (, position on the color-color diagram etc.).
A.1. 4U 051340 in NGC 1851
Thermonuclear bursts from the persistent source Clark et al. (1975) at , were first detected by SAS-3 Clark & Li (1977) and also possibly Uhuru Forman & Jones (1976). Chandra observations of the host cluster NGC 1851 allowed an optical identification Homer et al. (2001a); while the orbital period has not been measured, the large ratio indicates an ultracompact (i.e. min) system (e.g. van Paradijs & McClintock, 1994). Additionally, the lack of UV and X-ray modulation at time scales within the expected orbital period range ( hr) suggests low inclination. Only a handful of bursts has ever been observed (see Lewin et al. 1993 and Kuulkers et al. 2003 for summaries).
Throughout the RXTE mission 4U 051340 has been active at a flux of approximately (2.5–25 keV), reaching as high as during a d transient outburst in 2002. For kpc (the distance to the host cluster, NGC 1851; Kuulkers et al., 2003), this corresponds to an isotropic accretion rate of 2–12% (adopting a bolometric correction of ). We found seven widely-separated bursts in the public RXTE data, the first six with rather consistent properties: peak fluxes of , s in the mean and no evidence of PRE. The most recent burst, on 2006 November 4, occurred at % lower persistent flux level than the earlier bursts, and reached a peak flux of , exhibiting moderate radius-expansion. This burst was more intense than the earlier non-PRE bursts, with a 8-s interval during which the flux was close to maximum, contributing to a significantly larger s. The peak flux implies a source distance of 8.2 (11) kpc, depending upon whether the burst reached the Eddington limit for H-rich ( in equation 7) or pure He () material. An earlier PRE burst observed by BeppoSAX reached an essentially identical peak flux Kuulkers et al. (2003). That the distance calculated from the PRE bursts is closest to the cluster distance of kpc for suggests that these bursts reach the Eddington limit in a pure-He atmosphere, , rather than in mixed H/He. The short -values for the non-PRE bursts, as well as the short rise times ( s in the mean) are all consistent with ignition of primarily He fuel, as might be expected from a neutron star accreting from an evolved (and hence H-poor) donor.
A.2. EXO 0748676
This transient at , was discovered during EXOSAT observations in 1995 Parmar et al. (1986), which also revealed the first thermonuclear bursts from the source. EXO 0748676 exhibits synchronous X-ray and optical eclipses Crampton et al. (1986) once every 3.82 hr orbit, and also shows X-ray dipping activity. The bursting behaviour was studied in detail with EXOSAT, which revealed that the burst rate was inversely correlated with persistent flux (Gottwald et al. 1986; see also Lewin et al. 1993). In addition, the burst properties varied significantly with ; both and increased, and decreased when exceeded (0.1–20 keV). That the -values increased from to confirms that the changes in burst properties resulted from a transition from H/He to He-dominated burst fuel as the persistent flux (accretion rate) increases. Bursts with the highest peak fluxes (3–, 0.1–20 keV) exhibited PRE, leading to an estimated distance of kpc.
The combined spectra of bursts observed by XMM-Newton exhibited discrete spectral features Cottam et al. (2001); Bonnet-Bidaud et al. (2001), some of which appeared to be redshifted features from near the neutron star surface (; Cottam et al., 2002). Subsequent followup studies have failed to confirm this result (e.g. Cottam et al., 2007). Boirin et al. (2007) studied the energetic properties of these same bursts, identifying for the first time several examples of burst triplets separated by typically 12 min, in addition to closely spaced burst pairs (which have been observed previously; e.g. Gottwald et al., 1986). These bursts occurred at an accretion rate of about 1% , and likely arose from H-ignition in a mixed H/He environment (i.e. case 3 of Fujimoto et al., 1981). It seems probable that the presence of closely-spaced burst pairs and triplets is linked to hydrogen (case 3) ignition; the characteristic wait time between the bursts may be associated with a nuclear -decay timescale.
The source was also in a low flux state throughout most of the RXTE observations, at a mean level of (2.5–25 keV). In 2004 May ongoing monitoring of the source with RXTE revealed a radius-expansion burst, which reached a peak flux of Wolff et al. (2005). Two additional PRE bursts were detected in subsequent observations in 2005 June and August, and the overall range of peak fluxes (lower due to the reduced instrumental effective areas used by lheasoft version 5.3) was (3.8–. The short rise times (2 s) and low s suggest ignition in a He-rich environment, so that the distance inferred from the peak burst fluxes was kpc. At this distance the accretion rate over the course of the RXTE observations was % (adopting a bolometric correction of ). We observed 94 bursts in total, most of which did not exhibit PRE and had properties typical for the low-state bursts observed previously: separations consistent with a recurrence time of 2–5 hr, –15, varying fluences typically , and long durations ( s in the mean). We also found five burst pairs with much shorter recurrence times in the range 6.5–17 min (see §3.8.2). Several bursts occurred partially or wholly within dips. Three bursts (on 1999 Oct 17, 15:11:15 04:10:57 2000 Dec 17 23:53:34, and 2000 Dec 18) occurred close to, or coincident with, a dip egress, so that the measured peak flux was achieved while the source was still obscured. For these bursts the peak flux and fluence measurements (and derived parameters including ) are to be treated with caution.
A.3. 1M 0836425
A Galactic-plane (, ) transient discovered during OSO-7 observations between 1971–74 Markert et al. (1977); Cominsky et al. (1978), 1M 0836425 was first observed to exhibit thermonuclear bursts by Ginga during an outburst between 1990 November and 1991 February Aoki et al. (1992). The typical recurrence time for the 28 bursts detected was hr, but on one occasion was 8 min. No bursts exhibited radius expansion, leading to an upper limit on the distance of 10–20 kpc. The optical counterpart has not been identified, since several stars down to a limiting -band magnitude of are present in the ROSAT error circle Belloni et al. (1993).
A new outburst was detected by the RXTE/ASM on 2003 January, lasting until May. A second interval of activity commenced around 2003 September, and continued throughout the remainder of 2003–04. Seventeen bursts were observed in total, with rather homogeneous properties; peak fluxes of , fluence and time-scale . Chelovekov et al. (2005) analysed 15 of these bursts, in addition to 24 bursts observed by INTEGRAL; their maximum peak flux of (3–20 keV) led to a distance upper limit of 8 kpc. The maximum estimated bolometric flux from our analysis was , which leads to a more conservative upper limit (for ) of kpc. No kHz oscillations were detected in any of the bursts. The peak persistent flux was (2.5–25 keV), corresponding to an accretion rate of % (adopting a bolometric correction of ).
Near the end of 2003 January two pairs of bursts were observed, each separated by approximately 2 hr. The other bursts in the early part of the outburst occurred at much longer intervals, although consistent with a steady recurrence time of hr (but where the intervening bursts were missed due to data gaps). Assuming the bursts occurred quasi-periodically, the inferred recurrence time was hr on average, similar to that in previous observations Aoki et al. (1992). The measured -values were betwen 40 and 100, although the persistent flux measured from the field may be contaminated by emission from the nearby () 12.3 s X-ray pulsar GS 0834340. Thus, the derived broad-band flux (and hence ) may be overestimated. Even so, , the long duration of the bursts, and the hr recurrence times (too short to exhaust the accreted H by steady burning between the bursts, except for an extremely low accreted H fraction; e.g. Fujimoto et al., 1981) all indicate ignition of mixed H/He fuel.
A.4. 4U 091954
This weak, persistent source at , has been observed by all the major early satellites (Uhuru,OSO-7, Ariel-5, SAS-3, HEAO-1, Einstein). A star has been identified as the optical counterpart Chevalier & Ilovaisky (1987); although the orbital period is unknown, the system is a candidate ultracompact based on the optical properties, and X-ray spectroscopic measurements indicate enhanced abundances (Juett et al. 2001; Juett & Chakrabarty 2003; see also in ’t Zand et al. 2005). Observations by RXTE led to the first detection of a thermonuclear burst from the source, as well as the discovery of a 1160 Hz QPO Jonker et al. (2001).
Our analysis of the lone PRE burst, detected by RXTE on 2000 May 12 19:50:17 UT (Fig. 9) leads to a distance estimate of 4.0 (5.3) kpc assuming that the burst reaches (). We found three other burst candidates, the brightest of which (on 2004 June 18 23:38:17 UT) peaked at and exhibited no evidence for PRE. The other two were sufficiently faint that our spectral analysis results did not allow a test for cooling in the burst tail, and thus these three events must remain as merely burst candidates. The 2.5–25 keV PCA flux was between 0.7–, which for kpc corresponds to an accretion rate of % .
A.5. 4U 125469
Thermonuclear X-ray bursts and periodic dips were discovered in this 3.9 hr binary (, ) during EXOSAT observations in 1984 Courvoisier et al. (1986); Motch et al. (1987). Just two thermonuclear bursts were detected, with rise times of s; durations of s; peak fluxes of ; and no evidence of PRE (see also Lewin et al., 1993). in ’t Zand et al. (2003b) reported a superburst from this source, as detected by BeppoSAX on 1999 January 9. Possible PRE during the type-I burst precursor to the superburst leads to a distance estimate of kpc. Analysis of RXTE observations confirm that the system is an atoll source, and provided weak evidence for 95 Hz oscillations in one burst Bhattacharyya (2007).
RXTE observations in 1996–7 and 2001 detected the source at a persistent level of (2.5–25 keV), which for kpc corresponds to an accretion rate of 12% (for a bolometric correction of ). Four of the five thermonuclear bursts occurred between 2001 December 6–7 and exhibited rather unusual evolution of the blackbody radius. The radius was elevated during the rise and peak of the burst, and was accompanied by a decrease in the blackbody temperature, but not to a sufficient degree to be confirmed as PRE bursts (see Fig. 9). Typically for these bursts the peak flux ( in the mean) was reached at or before the peak radius. The bursts were short (mean s) and weak, with mean . The recurrence times were 10.7, 4.04 and 9.16 hr; the observations had sufficient coverage over the final interval to exclude an intermediate burst, although a dip (which could potentially have prevented detection of a burst) was observed at approximately the halfway mark. The measured -values were , and .
A.6. 4U 132362
Bursts with a steady recurrence time of 5.3 hr were discovered from 4U 132362 (, ) in 1984 during EXOSAT observations van der Klis et al. (1984). The bursts were homogeneous, with rise times of s, of , s, and no evidence of PRE Lewin et al. (1993). “Double” bursts, with extremely short ( min) recurrence times, are commonly observed from this source (see e.g. Bałucińska-Church et al., 1999). 4U 132362 also exhibits 2.93 hr periodic intensity dips Parmar et al. (1989), and is associated with a faint (, ) IR counterpart Smale (1995).
RXTE observations found 4U 132362 at a persistent, steady flux level of (2– (2.5–25 keV), somewhat higher than the of the EXOSAT observations. A total of 30 X-ray bursts were found, in observations taken early in 1997, 1999, late 2003 and late 2004. Seven bursts were observed between 1997 April 25–28, 5 with a regular recurrence time of hr. Two of these regular bursts were closely ( min) followed by extremely faint secondary bursts (see also Barnard et al., 2001). Two other examples of double bursts were detected by RXTE in 1999 January and 2004 December. Neglecting the bursts with short recurrence times, the burst properties were roughly consistent with previous observations: , and . The -values were in the mean, which, combined with the long burst duration, strongly suggests mixed H/He fuel in the bursts. Without any radius-expansion bursts, we have only upper limits on the distance, of 11 (15) kpc assuming the bursts do not exceed (). For a distance of 11 kpc, the persistent flux indicates an accretion rate of a few percent of . At this level, we expect either He-rich bursts with long recurrence times resulting from He-ignition (e.g. SAX J1808.43658, §A.36), or mixed H/He bursts with short recurrence times resulting from H ignition (e.g. EXO 0748676, §A.2). The burst properties of 4U 132362 (as well as the presence of faint secondary bursts), strongly suggests the latter regime. We note that the regular occurence of double bursts provides an opportunity to constrain the fuel source for the secondary bursts (see §3.8.2).
A.7. 4U 160852
Bursts from this Galactic plane (, ) transient were first detected by the two Vela-5 satellites Belian et al. (1976). Uhuru observations confirmed the link between the bursting and persistent source Tananbaum et al. (1976), and a more precise X-ray position obtained with HEAO-1 Fabbiano et al. (1978) permitted identification of the optical counterpart QX Nor Grindlay & Liller (1978). Variations in the persistent X-ray flux as measured by Vela-5B have suggested an orbital period of either 4.10 or 5.19 d Lochner & Roussel-Dupre (1994). Along with 4U 172834, 4U 160852 was one of the first sources for which the intensity dips at the burst peak were identified as PRE episodes Fujimoto & Gottwald (1989). Hakucho observations revealed recurrence times as short as 10 min, as well as two separate bursting modes (in terms of recurrence time and profile shape) depending upon the persistent flux level (Murakami et al. 1980a, b; see also Lewin et al. 1993). At high , the bursts are bright and fast, with rise times of s and s; at low , the rise times exceeded 2 s and the bursts were much longer with –30 s. A superburst has been identified in RXTE/ASM data; this source is the first frequent transient in which such an event has occurred Keek et al. (2007).
Two large and several smaller outbursts have occurred during RXTE’s lifetime; the most recent observed by RXTE in 2005 March. The large outbursts both peaked at (2.5–25 keV), corresponding to an accretion rate of 62% (for a distance of 4.1 kpc, see Table 10; and a bolometric correction of ). The lowest measured fluxes of provide an upper limit for the quiescent accretion rate of 0.5% . We found 31 bursts in public RXTE data, of which 12 exhibited PRE. At the lowest values, we found five PRE bursts with long time scales ( in the mean). In five of the other 6 PRE bursts we detected burst oscillations at 619 Hz, making this source the most rapidly spinning neutron-star LMXB known to date (Hartman et al. 2008, in preparation). Three bursts exhibited oscillations both before and after the PRE episode, and showed increases in frequency with time of up to 6.6 Hz (1.1%) over 8 s. The oscillations during the burst rise had the largest amplitudes, up to 13% (rms), while detections during the tails were up to 10% but more typically 3–5%.
The bursts from 4U 160852 were some of the brightest seen in the entire RXTE sample, and peaked between 1.2–. As with previous observations, appeared to decrease significantly with persistent flux, although there was substantial scatter. For four pairs of closely-spaced non-PRE bursts with –22 s we estimated the recurrence time at between 4.14–7.5 hr, so that –54. We observed two instances of extremely short recurrence times for bursts from 4U 160852. On 1996 March 22 we observed three bursts in quick succession; two brighter bursts separated by 24 min, with an extremely faint burst () inbetween, just 16 min after the first burst. Such burst triplets have only been observed from a few other sources, including EXO 0748676 Boirin et al. (2007) and 4U 170544 (see §A.11). None of the three bursts exhibited PRE. On 2001 November 21 we observed two bursts separated by at most 6 min (the start of the second burst fell within a data gap). The persistent flux level between these two observations varied by a factor of 2, and suggest an accretion rate of 3–5% , in the range where we expect bursts to ignite via H-ignition. The bursts comprising the burst triplet and pair all had long in the mean, and the second and third burst of the triplet had atypically low fluences of 0.025 and . These properties are similar to other short-recurrence time bursts such as those observed from EXO 0748676 (see §A.2).
A.8. 4U 1636536
4U 1636536 (, ) is a well-studied LMXB in a 3.8 h orbit with an 18th magnitude blue star, V801 Ara van Paradijs et al. (1990b). X-ray bursts were first detected from a region containing the previously-known persistent source by OSO-8 Swank et al. (1976a), and were subsequently studied in great detail with observations by EXOSAT (see Lewin et al., 1993, for a review). RXTE observations revealed burst oscillations at 579.3 Hz Strohmayer et al. (1998b, a), as well as a possible first detection of a harmonic (which has not been confirmed in other bursts from the source; Miller, 1999). The properties of the oscillations have been analysed by Muno et al. (2001) and Giles et al. (2002). Three “superbursts” have also been detected, separated by 2.9 and 1.75 yr Wijnands (2001); Kuulkers et al. (2004). In one of the superbursts, which was observed with the PCA, Strohmayer & Markwardt (2002) found an s interval during which oscillations were consistently detected.
The persistent flux of the source varied between 4– (2.5–25 keV) between 1996–2000, but since then it declined steadily, reaching during 2004 January. For a distance of 6 kpc (see Table 10), this corresponds to an accretion rate between 3–16% . We detected 123 bursts from public RXTE observations, of which 40 exhibited PRE. The peak fluxes were bimodally distributed, as in previous observations (e.g. Sugimoto et al., 1984), although we found both PRE and non-PRE bursts with falling within the gap noted by those authors. While the majority of the 40 PRE bursts had peak fluxes which varied significantly about a mean of , with a standard deviation of 7.6% (in contrast to earler studies which measured consistent PRE burst peak fluxes; Ebisuzaki, 1987) we also found two PRE bursts with much smaller peak fluxes of . The ratio of the mean peak flux of the bright to faint PRE bursts is 1.7, suggesting that the bright bursts reach the Eddington limit for pure He, while the faint bursts reach the limit for mixed H/He at approximately solar composition (Galloway et al., 2006, see also §3.1). At the highest range the bursts were fast, with s in the mean; at lower the values became both larger and more variable. The burst rate decreased significantly as increased (see Fig. 15 and §3.4). Typical -values for bursts with –2.2 hr at low were , although on occasion were as high as 100 (for somewhat longer hr); however, at the highest flux range we measured for a pair of bursts with hr.
We found 4 bursts with distinct double peaks in the bolometric flux, separated by 4–5 s. For three of these bursts (on 2001 September 5 08:15:04, 2001 October 3 00:22:18, and 2002 February 28 23:42:53 UT) the second peak was larger than the first, by 70, 40, and 230% respectively (the lattermost case bore a striking resemblence to a burst from 4U 1709267; see §A.12 and Jonker et al., 2004). For the other burst, on 2002 January 8 12:22:44 UT, the first peak was very slightly greater than the second, and between the two peaks the flux reached a minimum of around 45% . This burst was also analysed by Bhattacharyya & Strohmayer (2006a), who interpreted the variation of the blackbody radius as arising from two-phase spreading of the nuclear burning following ignition near the pole.
A.9. MXB 1659298
Regular (–2.6 hr) X-ray bursts were first detected from MXB 1659298 (, ) by SAS-3 in 1976 Lewin et al. (1976c). An upper limit on the persistent flux at this time led to a constraint on . Persistent emission at attributed to the bursting source was detected by SAS-3 two years later Lewin et al. (1978), although no bursts were detected at that time (see also Lewin et al., 1993). An improved X-ray position from observations by HEAO-1 led to the identification of the optical counterpart, V2134 Oph Doxsey et al. (1979). Irregular X-ray dips as well as 15 min eclipses at the 7.1 hr orbital period were discovered in HEAO A-1 scanning observations Cominsky & Wood (1984).
A new active period which lasted around 2.5 yr began in 1999 April, during which the source was observed extensively by RXTE and BeppoSAX/WFC. The PCA flux peaked at (2.5–25 keV) in 1999 April, but was 4– throughout the remainder of the outburst. For kpc (see Table 10) this corresponds to a range of accretion rates of 6–15% . Burst oscillations at 567 Hz were detected in most of the PRE bursts observed by RXTE Wijnands et al. (2001c); a detailed study of 14 of the 26 bursts observed in total was presented in Wijnands et al. (2002b).
Those authors found no clear correlations between their properties and the accretion rate, although only a limited range of accretion rates were sampled. In the full set of bursts observed by RXTE there is a marked division between the PRE bursts, which had s in the mean and were generally observed at higher , and the non-PRE bursts, for which s (with one exception) and which were observed at somewhat lower . We also found unusually large variations in the peak flux of the PRE bursts (see §3.1); this may be a consequence of the high system inclination, as evidenced from the presence of eclipses. The burst intervals measured by RXTE were all hr, with just two exceptions; for one of those intervals ( hr) we could not exclude intermediate bursts due to a data gap, while for the other (0.53 hr) the high-resolution datamodes did not cover the second burst. Thus, we could not reliably estimate for any of the burst pairs.
MXB 1659298 became undetectable by the PCA on 2001 September 7, after which the cooling of the NS was monitored by Chandra observations Wijnands et al. (2004).
A.10. 4U 1702429
Bursts from this Galactic plane (, ) source were first detected by OSO-8 Swank et al. (1976b). Makishima et al. (1982) detected 14 bursts with characteristic recurrence times of 9–12 hr from the region in Hakucho observations in 1979, and attributed them to a persistent Uhuru source. The peak fluxes were (18– (3–10 keV); rise times a few seconds or less; and –15 (see also Lewin et al., 1993). A distance of kpc was inferred from the similarity of the peak fluxes with those of other Galactic centre sources. A star at the edge of the Chandra error circle has been suggested as the counterpart Wachter et al. (2004). RXTE observations in 1997 July 29–30 revealed kHz QPOs as well as 6 type-I bursts with coherent oscillations near 330 Hz Markwardt et al. (1999b).
4U 1702429 was persistently active at low levels (0.7–, 2.5–25 keV) throughout the RXTE mission to date. For a distance of 5.5 kpc (derived from the mean peak flux of five PRE bursts; Table 10) the accretion rate was 2–6% (where we adopt a bolometric correction for the 2.5–25 keV flux which averages over 6 selected observations). We found 47 bursts in total, with peak fluxes which were strongly correlated with the burst fluence. The correlation was most striking for the bursts with fluences (primarily non-PRE bursts), and the scatter about a linear fit was only about 10%. The relation saturated at about , and for bursts with fluences larger than (all PRE bursts) the peak fluxes were all quite similar. We note that this behavior is distinct from that of 4U 172834, which shows a correlation between peak flux and fluence most strongly for PRE bursts Galloway et al. (2003). The non-PRE burst profiles from 4U 1702429 were quite homogeneous, with s in the mean, and rise times consistently s (see Fig. 9). The PRE bursts had substantially larger -values () than the non-PRE bursts.
The shortest burst interval was 4.5 hr; on 16 separate occasions between 1997 July and 2004 April we detected a pair of bursts separated by no more than 8.1 hr; in the mean, the burst separations were hr. We tentatively identify this value as the characteristic burst recurrence time for the source during the RXTE observations. While it is possible that intervening bursts were missed in data gaps (so that the actual recurrence times were one-half or less of the measured intervals), we note that these intervals are already significantly lower than the 9–12 hr measured in previous observations Makishima et al. (1982), suggesting that an even shorter recurrence time is less likely. The source was quite variable on timescales of a few days, so that the persistent 2.5–25 keV flux during these observations varied between (1.3–. We estimate -values in the range 74–153, with the wide range arising mainly from the large variations in burst fluence . This inconsistency between the burst fluences for comparable recurrence times and perhaps indicates incomplete burning of the accreted fuel in the low-fluence bursts. We found the three smallest values of clustered tightly about a mean of , suggesting a H-fraction at ignition of less than half the solar value. A low H-fraction is also consistent with the short rise times and low -values for the bursts.
A.11. 4U 170544
This persistently bright, variable source (, ) was detected initially in Uhuru observations Forman et al. (1978). Bursts were first discovered by EXOSAT in 1985, and the bursting behaviour was subsequently studied in detail by that satellite Langmeier et al. (1987); Gottwald et al. (1989). The burst profile was observed to change from slow (with decay s) to fast ( s) as the intensity increased, in a similar fashion to EXO 0748676 (see also §A.2, Lewin et al., 1993). Typical recurrence times were 1.9–2.5 hr, except for occasional faint bursts following brighter events by just 500–1000 s. Model atmosphere fits to spectra of non-PRE bursts observed by EXOSAT suggest a distance to the source of kpc Haberl & Titarchuk (1995), and also indicate a H-rich atmosphere; on the other hand, Christian & Swank (1997) derive a distance from the peak flux of PRE bursts of 11 kpc. One (or possibly two) high-frequency QPOs were discovered through RXTE observations Ford et al. (1998). The optical counterpart is unknown.
The persistent flux from the source varies substantially in a quasi-periodic manner on a time-scale of several hundred days (e.g. Priedhorsky, 1986, see also fig. 8). The 2.5–25 keV flux measured by RXTE/PCA varied between 0.18–. We found a total of 47 type-I bursts in the public PCA data, including three exhibiting PRE. The distance derived from the PRE bursts is consistent with the distance estimate of Haberl & Titarchuk (1995) at between 5.8–7.6 kpc, depending upon the composition (Table 10). The persistent flux range is thus equivalent to an accretion rate of 1.1–70% (for a bolometric correction to the 2.5–25 keV flux which ranged between 1.29–1.75 for 3 selected observations, and was 1.48 in the mean). All but one of the bursts was observed when (i.e. % ). The non-PRE bursts had s in the mean, while the PRE bursts, which were all observed at higher persistent flux levels (–2.5), were much faster with s. The single burst observed at high on 2002 June 29 19:54:43 UT also had a low s but did not exhibit PRE.
We found four bursts with short recurrence times of between 7–11 min, two of which were themselves part of a closely-spaced burst triplet, on 2000 February 7. Such triplets have only been observed in a handful of sources, including EXO 0748676 Boirin et al. (2007) and 4U 160852 (see §A.7). Each of the short recurrence time bursts had unusually small fluences, and occurred when the persistent flux indicated an accretion rate of 5–10% . For the remaining bursts, taking into account the possibility of missed bursts, the recurrence times were 0.76–3.1 hr. Between 1997 May 16–19 ten bursts were detected off-axis during observations of PSR B170644, just away. Assuming that the X-ray flux from the pulsar is negligible, the majority of the bursts for which the recurrence time could be confidently measured had hr and –75. For three other pairs of bursts with somewhat longer –3 hr, the -values ere much higher, at , , and, for an unusually weak burst, .
A.12. XTE J1709267
XTE J1709267 (, ) went into a large outburst in 1997 and was discovered by the RXTE/PCA during a satellite maneuver Marshall et al. (1997). An improved position was obtained from BeppoSAX observations Cocchi et al. (1998), also during which bursting behaviour was first observed. Three bursts were observed in total by BeppoSAX, with absorption-corrected bolometric peak fluxes of , leading to a distance upper limit of kpc. A second outburst, very similar to the first, was observed with RXTE beginning 2001 December Jonker et al. (2004). The maximum PCA flux was (2.5–25 keV), slightly smaller than for the previous outburst (which peaked at ). For kpc this corresponds to a peak accretion rate of 33–43% . PCA observations detected 3 bursts during the 2001–02 outburst with peak fluxes of and s in the mean. All three bursts exhibited low-level flux for 2–3 s prior to the burst, and one (on 2002 January 30 04:16:02 UT) exhibited a precursor event peaking at % of the subsequent maximum, remarkably similar to a burst observed from 4U 1636536 on 2002 February 28 23:42:53 UT (see Fig. 9). While none of the bursts exhibited evidence for significant radius expansion, the third burst, on 2002 Feb 7 01:12:03 UT, exhibited marginal evidence (although it did not reach a peak flux level significantly higher than the other two). The distance limits derived from these bursts is consistent with that of the BeppoSAX observations, at 11 (14) kpc for (0.0).
A.13. XTE J1710281
This nearby source (, ) was also detected in outburst by the PCA in 1998, and was identified with the ROSAT All-Sky Survey Bright Source Catalog source 1RXS J171012.3280754 Markwardt et al. (1998). Low-level activity continued throughout 1999, and recurring s eclipses with a periodicity of 3.27 h (assumed to be the orbital period) were detected in subsequent observations Markwardt et al. (1999c); Markwardt & Swank (2002). Bursting activity was also discovered during these RXTE observations, with a total of 19 bursts detected since, including one PRE burst and one pair of bursts separated by 10 min. The distance range implied by the peak flux of for the single PRE burst is 12–16 kpc (Table 10; see also Markwardt & Swank, 2002). The source was also active during 2001–02, at an overall flux range of 0.4– (2.5–25 keV). For kpc this corresponds to 1–4% (assuming a bolometric correction of ). The non-PRE bursts were exceedingly faint, with peak fluxes of 0.22–. The bursts observed when had a range of –17 s, with the PRE burst having the smallest value of s. At lower persistent fluxes the bursts were longer, with (typically) . The pair of closely spaced bursts occurred when the persistent flux indicated an accretion rate of 1.6% . On three occasions we measured burst intervals of hr, while in 2005 November we found two bursts separated by 3.3 hr. Thus, we tentatively identify the typical recurrence time as hr. The corresponding -values varied widely between 22–190.
A.14. XTE J1723376
This transient (, ) underwent a moderate outburst on 1999 January and was discovered during an RXTE/PCA scan of the region Marshall & Markwardt (1999). An ASCA observation on 1999 March 4 led to an improved position Marshall et al. (1999), and the source activity continued throughout March Markwardt et al. (1999c). Thermonuclear bursts were first observed during the RXTE observations, and a total of three bursts were observed. The brightest burst reached , implying a source distance of at most 13 kpc. The persistent flux reached (2.5–25 keV) in outburst, which for kpc corresponds to % (for a bolometric correction to the 2.5–25 keV flux of ). The first of the pair of bursts on 1999 February 3–4 ( hr) exhibited evidence for a double peak in the bolometric flux, and had s. The second burst was faster and somewhat flat-topped, with s and .
A.15. 4U 1724307 in Terzan 2
A long thermonuclear burst was observed from 4U 1724307 (, ) by OSO-8 Swank et al. (1977), reaching a peak flux of . The burst source was identified with the globular cluster Terzan 2 Grindlay (1978); Grindlay et al. (1980), 7.5–12 kpc away (Kuulkers et al. 2003; although Ortolani et al. 1997 estimated a range of 5–8 kpc). No optical counterpart is known. Bursts are observed from the source relatively infrequently (e.g. Lewin et al., 1993), and the most detailed studies to date have been with BeppoSAX/WFC monitoring observations of the Galactic center region which found 24 bursts with inferred PRE reaching 5.4– Kuulkers et al. (2003).
4U 1724307 was persistently bright although declining during RXTE observations; in 1996–98 the persistent flux was (2.5–25 keV, see also Olive et al. 1998), while in 2001–02 it had declined to . For a distance of 9.5 kpc this corresponds to an accretion rate of 6–11% . A burst observed by RXTE on 1996 November 8 07:00:31 UT exhibited sufficiently intense PRE that the color temperature fell below keV shortly after the start, so that the burst flux effectively dropped out of the PCA band (see Fig. 11 and Molkov et al., 2000; Kuulkers et al., 2003). Apart from this episode the burst flux was approximately constant at for the first 25 s; this is substantially above the expected Eddington flux for a source at 9.5 kpc. A second PRE burst observed on 2004 February 23 exhibited much less extreme radius expansion, and reached a peak flux around 30% lower at . The implied distance from this burst is 7.4 kpc, consistent with the lower limit of the estimated distance range for Terzan 2. The weaker PRE burst lasted only s, and the fluence was less than a tenth of that of the brighter. The only other burst was similar in profile to the 2004 February burst, reaching a peak of , but exhibiting only marginal radius expansion. Intense, long duration PRE bursts, as also observed from 4U 2129+12 (see §A.47) and GRS 1747312 (§A.34), appear to consistently exceed the expected Eddington limit (see §3.1).
A.16. 4U 172834 ( GX 354+0)
4U 172834 (GX 354+0; , ) was first resolved by Uhuru scans of the galactic center region Forman et al. (1976b). The position of a possible radio counterpart suggested identification with a infrared counterpart Martí et al. (1998). Thermonuclear X-ray bursts were discovered during SAS-3 observations of the Galactic center region Lewin et al. (1976a); Hoffman et al. (1976). The bursting behaviour was subsequently studied in detail using extensive SAS-3 observations, which included 96 bursts in total. The burst intervals were moderately regular, varying by a factor of , and — along with the burst properties — were apparently not correlated with Lewin et al. (1993). The average s, while with only % variation between observations. Basinska et al. (1984) found evidence for a narrow distribution of peak burst fluxes, as well as a correlation between peak flux and the burst fluence. Assuming that the maximum burst flux is the Eddington limit, the distance to the source is 4.2–6.4 kpc (see also van Paradijs, 1978); other measurements are all around these values (e.g. 6 kpc; Kaminker et al., 1989). Early RXTE observations of the source led to the discovery of nearly coherent 363 Hz oscillations during the bursts Strohmayer et al. (1996) that were subsequently observed in 12 other sources (see §2.4). Subsets of the bursts observed during the PCA observations have been studied by van Straaten et al. (2001), Franco (2001), and Muno et al. (2001, 2004), with particular attention to the relationship between the appearance of burst oscillations and the mass accretion rate.
4U 172834 was persistently bright during RXTE observations at – (2.5–25 keV). We note that these persistent flux levels may be affected by the presence of the nearby transient 4U 1730335 (the Rapid Burster; see §A.17 and §B.1). For a distance of 5.2 kpc (see also Galloway et al., 2003) this is equivalent to an accretion rate of 3–18% (for a bolometric correction to the 2.5–25 keV flux between 1.05–1.55, or in the mean). We found 106 bursts in total attributable to 4U 172834 in public RXTE observations. The bursts were all rather homogeneous, with short rise times ( s) and time scales (). The shortest measured burst interval was 1.77 hr; Cornelisse et al. (2003) found evidence for clustering of recurrence times in bursts observed by BeppoSAX between 2.5–5 hr, which is consistent with the RXTE measurements. The -values for the bursts varied between 91–310, or in the mean. The burst properties bear a remarkable resemblence to those of 3A 182030 (see §A.39; Cumming, 2003), which is an ultracompact binary with an evolved, H-poor mass donor. Model fits to the RXTE spectra during PRE also suggest an atmosphere dominated by helium Shaposhnikov et al. (2003). It seems likely that the mass donor in 4U 173834 is also H-poor.
A significant fraction () of the bursts observed by RXTE showed evidence for PRE episodes. The peak flux of these bursts varied with a standard deviation of 9%, and was correlated with the persistent emission, both varying quasi-periodically with a time scale of d Galloway et al. (2003). The peak PRE burst flux and fluence were also strongly correlated, suggesting reprocessing of the burst flux, perhaps by a precessing, warped accretion disk to give the d time scale. Shaposhnikov et al. (2003) suggests instead that the variations in arise from increased visibility of the neutron star following the atmospheric contraction, and estimate a system inclination of .
A.17. Rapid Burster ( MXB 1730335) in Liller 1
This remarkable Galactic bulge (, ) transient was discovered during SAS-3 observations Lewin et al. (1976b) to exhibit unusually frequent X-ray bursts, with intervals of 6 s to 5 min. An apparent second class of “anomalous” bursts, with 3 s rise times and lower peak intensities Ulmer et al. (1977), were later identified as thermonuclear (type-I) bursts; the brighter, more frequent (type II) bursts were attributed instead to episodic accretion Hoffman et al. (1978). Thermonuclear bursts occur in the Rapid Burster at intervals of –4 hr Lewin et al. (1993), in the same range as other bursters, and are almost always observed alongside type-II bursts. No PRE bursts have been reported; the peak flux of the brightest thermonuclear bursts is (Kuulkers et al. 2003; see also Lewin et al. 1993). The type-I bursts have long durations, suggesting that substantial amounts of H is present at ignition. Historically, the source has exhibited approximately periodic outbursts every d Guerriero et al. (1999); thermonuclear bursts are seen preferentially in the first 15–20 d of the outburst. Located in the globular cluster Liller 1 Liller (1977), no conclusive optical counterpart has been found despite Chandra and HST observations of the field Homer et al. (2001b), and a confirmed radio counterpart Moore et al. (2000).
RXTE observations have detected outbursts (as of 2006 March), and indicate that the outburst recurrence time has decreased to d (Masetti 2002; see also Fig. 8). The peak 2.5–25 keV flux typical for outbursts prior to 2000 was , which for a distance to the host cluster of 8.8 kpc Kuulkers et al. (2003) corresponds to an accretion rate of 95% . Outbursts occuring in 2000 and later appeared to peak at a significantly smaller flux of , or % . The minimum detectable was , or 1.2% . We note that these measurements may include a contribution from the nearby source 4U 172834 (see §A.16, §B.1). In the public RXTE observations of the Rapid Burster we found 66 type-I bursts, none of which exhibited PRE. Analysis of a subset of the thermonuclear bursts by Fox et al. (2001) revealed a possible burst oscillation at 306.5 Hz. The signal was detected by combining the power density spectra of 31 individual bursts, and is not detected in any single burst. As also noted by Fox et al. (2001), the bursts exhibit a range of profiles, with –40; some bursts appear to last for more than 100 s. A few bursts appear to be followed by an increase in the persistent flux level, which makes the fluence difficult to constrain. The peak flux was , similar to previous observations. The burst rate was hr-1 on average, and increased significantly with persistent flux (although it is possible that some faint thermonuclear bursts are in fact mis-identified type-II bursts). Interestingly, the Rapid Burster appears to be “rapid” both in the sense of type-I and type-II bursts.
A.18. KS 1731260
A transient located near the Galactic center (, ), KS 173126 was discovered in August 1989 using the imaging spectrometer aboard the Mir-Kvant observatory Sunyaev et al. (1990). Type I X-ray bursts were also first seen during these observations, lasting 10–20 s and reaching Crab (). An improved X-ray position from Chandra observations Wijnands et al. (2001a) led to the identification of the , counterpart Revnivtsev & Sunyaev (2002); Mignani et al. (2002). RXTE observations revealed 524 Hz burst oscillations which occurred preferentially in PRE bursts (Smith et al. 1997; Muno et al. 2000)
The source was active at 1– (2.5–25 keV) although declining steadily in intensity between 1996–2000, before transitioning to quiescence early in 2001 Wijnands et al. (2001b). After this time the source became undetectable by RXTE, and no more bursts were detected We found 27 bursts from KS 173126, with 4 PRE bursts observed at relatively high (see also Muno et al., 2004); oscillations were found preferentially in the PRE bursts (Muno et al. 2001; see also §3.7). The PRE bursts reached peak fluxes indicating a source distance of kpc (assuming the bursts reach ; Table 10). Thus, the accretion rate while the source was active was 6–38% (for a bolometric correction averaging 1.62 over two observations). The PRE bursts were of short duration, with s in the mean. In observations between 2000 August–September, during which (i.e. 14% ), the bursts were much longer duration ( s, rise time s) and occurred regularly at hr. The -values were in the mean; in many respects these bursts were remarkably similar to those observed from GS 182624 (Galloway et al. 2004b; see also §A.40, §3.4). At both higher and lower this regular bursting ceased (also noted by Cornelisse et al., 2003).
A.19. SLX 1735269
This persistent Galactic-center (, ) source was discovered in observations with a coded-mask X-ray telescope aboard Spacelab 2 Skinner et al. (1987), and a single X-ray burst detected later by BeppoSAX/WFC was attributed to the source Bazzano et al. (1997). The burst lasted 30 s, and had a peak flux of . Molkov et al. (2004) detected six bursts in INTEGRAL observations between 2003 April and September, one with a brief precursor, an unusually long duration of s, and indications of PRE. The peak flux of for the long burst suggests a distance of 5–6 kpc, depending upon the composition. The five bursts in 2003 September were consistent with a steady recurrence time of hr; the estimated -values were 100–200, and the inferred accretion rate was % (for kpc). An improved X-ray position has been determined from Chandra observations by Wilson et al. (2003), although this position did not match that of any IR counterpart (to an upper limit of ).
The persistent flux measured by the RXTE/PCA during 1997 and 2001–02 was 2.5– (2.5–25 keV); the timing behaviour during these observations was studied by Wijnands & van der Klis (1999). We found just one burst, on 2002 January 23, with a peak flux of and , and with no evidence for PRE. This implies an upper limit to the distance of 7.3 kpc (Table 10). The inferred accretion rate during the RXTE observations was then 1–4% .
A.20. 4U 173544
This bright, persistent atoll source at , was first detected by Uhuru, while thermonuclear bursts were discovered during SAS-3 observations Lewin et al. (1977). The 20– position from SAS-3 Jernigan et al. (1977) led to the identification of the optical counterpart, V926 Sco McClintock et al. (1977), with optical and UV properties very similar to those of the counterpart of Sco X-1 (e.g McClintock et al., 1978). Delayed optical bursts have been observed from the counterpart Grindlay et al. (1978), and periodic photometric variations indicate an orbital period of 4.65 hr (McClintock & Petro 1981; Corbet et al. 1986; note that Lewin et al. 1993 erroneously lists the as 3.65 hr). The bursts are notable for their rapid time scales ( s), irregular recurrence times and consequently extremely variable -values (from 250 to ; van Paradijs et al. 1988b; Lewin et al. 1993). The source is one of a growing number which exhibit extremely long “superbursts”, detected in BeppoSAX observations Cornelisse et al. (2000).
The persistent flux measured by RXTE varied between 3– (2.5–25 keV), with evidence for a long ( d) time scale (see Fig. 8). We detected 11 bursts in total from the PCA observations, 6 of which exhibited evidence for PRE with a mean peak flux of . Assuming these bursts reach , the distance to the source is 8.5 kpc, implying a range of accretion rates of 19–50% (adopting a bolometric correction of 1.137, the mean of values from two observations). All the bursts were observed when , i.e. % . The majority were fast, with s. We found four pairs of bursts with recurrence times of 1.1–1.5 hr, and one pair with hr; the alpha values varied from 150–270. These properties are all consistent with pure He fuel.
A.21. XTE J1739285
This Galactic-center region (, ) transient was first detected in monitoring RXTE observations in 1999 October Markwardt et al. (1999a). At that time, no bursts or high-frequency variability were detected. Little more was learned about XTE J1739285 until it became active once again in 2005 August Bodaghee et al. (2005), when it was detected by INTEGRAL as well as several other X-ray instruments. Despite a Chandra position with estimated uncertainty of (90%), the optical counterpart has not been identified Torres et al. (2006). Thermonuclear bursts were first detected also in INTEGRAL observations Brandt et al. (2005), and subsequent RXTE observations led to detection of six additional bursts. Evidence for oscillations at 1122 Hz during one of the bursts Kaaret et al. (2007) suggests this system may harbour the fastest-spinning neutron star yet known.
The persistent flux was greatest during the observations at the time of discovery in 1999, at between 3 and (2.5–25 keV). For the observations in 2005–6 (and during an earlier active phase in 2001) the flux was typically in the range 0.3–. At the maximum possible distance of 10 kpc (based on the peak flux of the brightest burst, since none of the 6 bursts observed with RXTE exhibited radius expansion; see also Kaaret et al., 2007) this corresponds to a range of accretion rates of 3–50% (for a bolometric correction of ). We note that bursts were only observed at peak fluxes between 0.9 and , i.e. an estimated range of accretion rates of 9–13% .
The burst peak fluxes varied significantly, reaching between 9 and . Four of the six bursts had comparable fluences, while the other two were much fainter, about 1/3 the mean of the brighter bursts. The peak burst flux was significantly correlated with the burst fluence. The burst rise times and timescales also varied significantly, in the range 1–4.5 s and 6–12 s respectively. One of the two faint bursts (with rise time 2 s and s) was the only one that occurred within 24 hr of the previous burst; assuming no bursts were missed in the (single) data gap inbetween, the recurrence time was 1.95 hr. The corresponding -value was , indicating H-poor fuel, which is also consistent with the fast rise time and low . The longer rise times and higher for the other, brighter bursts suggest a larger contribution of H in the burst fuel.
A.22. KS 1741293 ( AX J1744.8-2921)
This Galactic center (, ) source was discovered in 1989 August with TTM/Kvant aboard Mir in ’t Zand et al. (1991); it is within the error boxes of both MXB 174229 & MXB 174329 Lewin et al. (1976d). Two single-peaked X-ray bursts were observed, with estimated peak fluxes of 12 and . KS 1741293 was visible to RXTE in all the Galactic center fields in which bursts were observed (see §B.5), as well as the field centered on GRO J174428 (§B.6), although none of those bursts were conclusively attributable to this source. Because the source density is so high in this region, it was not possible to independently measure the source flux with the PCA observations. Furthermore, because the source position is only known to , KS 1741293 is not included in the list of sources for which the ASM routinely provides intensity measurements.
An extremely faint burst was observed on 1998 Sep 24 00:22:24 UT during pointings towards 1E 1740.72942, with an intrinsic peak flux of . KS 1741293, 2E 1742.92929 and SLX 1744300 are all from the center of this field, with KS 1741293 the closest by a small margin. Since the scaling factor due to the collimator response is extremely sensitive to offset angles around this value, we attribute this burst to the closest source, KS 1741293. The resulting scaled peak flux was , which is a factor of larger than previously observed bursts from the source. While 2E 1742.92929 exhibited other bursts soon after, on 1998 September 30, the rescaled flux assuming the burst originated from that source instead would be almost a factor of two higher, which would be in excess of the Eddington limit for a Galactic center source.
A.23. GRS 1741.92853 ( AX J1745.02855)
This Galactic center (, ) transient was discovered during observations with the ART-P coded-mask X-ray telescope aboard the GRANAT observatory Pavlinsky et al. (1994). Bursts (with indications of PRE) were first detected from this source by BeppoSAX in August and September 1996 Cocchi et al. (1999); the peak flux indicates a distance of kpc, consistent with the distance to the Galactic center. The source has been detected in outburst several times by ASCA and Chandra Muno et al. (2003); the Chandra observations also revealed an extremely weak burst (peak flux , 2–8 keV).
We attributed 8 bursts in observations covering GRS 1741.92853 to this source; we note that Strohmayer et al. (1997a) reported millisecond oscillations in 3 of the 8, originally attributed to MXB 174329 (see also §B.6). The two shortest burst intervals were 35.6 hr and 39.4 hr, similar to the recurrence time of 1.46 d observed for MXB 174329 Lewin et al. (1993), although it is possible that intermediate bursts were missed during the RXTE observations. Six of the 8 bursts exhibited PRE, with peak fluxes varying significantly between 22–. This range of peak PRE burst fluxes implies a range of distances of 5–10 kpc, consistent with the distance to the Galactic center (see also Table 10). The two brightest bursts, on 1996 July 8 01:57:47 UT and July 23 04:13:56 UT, had unusual profiles with broad maxima, long durations ( and 46.4 s, respectively; see Fig. 9) and PRE to large radii, similar as has been observed recently for GRS 1747312 in ’t Zand et al. (2003c) as well as a few other sources. The remaining bursts had much shorter durations, s in the mean.
A.24. 2E 1742.92929 ( GC X-1/1A 1742294)
Bursts from this Galactic center (, ) source were probably first observed with SAS-3, and attributed to a source designated MXB 174229 Lewin et al. (1976d). 2E 1742.92929 was subsequently observed with Ariel-5 and Einstein, among others. The most detailed study of the bursts were of 26 observed with ART-P/Granat Lutovinov et al. (2001). Both “weak” and “strong” bursts were observed; the brightest of the latter class reached a maximum of 3.5– (3–20 keV).
2E 1742.92929 was the most active Galactic center burster during the period covered by the RXTE observations. In the ASM the source was persistently bright at (25 mCrab, or in 2–10 keV; see Fig. 8). We attributed more than 80 bursts to this source in total, the majority from 2001 September 26 to October 8 (see §B.5.3). All but two of the bursts were faint, with inferred peak fluxes of in the mean, –40 s, and no evidence for PRE. The other two bursts, observed in the field centered on , (J2000.0; see §B.5.1) on 1997 March 20 and 1998 November 12, were of shorter duration with s and exhibited strong PRE with rescaled peak fluxes of , consistent with the brightest bursts previously observed from this source by Granat. About 20% of the bursts had recurrence times hr ( hr in the mean), while 35% had –3 hr.
A.25. SAX J1747.02853
This transient was first detected in 1998 in ’t Zand et al. (1998a) at a position (, ) consistent with a source detected in the 1970s by rocket-borne coded-mask/Ariel-5 observations, GX .2.2 (also known as 1A 1743-288; Proctor et al., 1978). Bursting behaviour was first observed by BeppoSAX Sidoli et al. (1998). Followup observations revealed at least one radius-expansion burst, indicating a source distance of kpc Natalucci et al. (2000).
The source appeared in outburst on several subsequent occasions, including 2000 February-June and 2001 September Natalucci et al. (2004). During RXTE observations in 2001 September–October, 15 bursts were detected which we attributed to this source (see §B.5.3). The bursts were relatively long, with s in the mean; 10 of the 15 exhibited PRE, and 7 bursts also exhibited a distinct double-peaked morphology. If the PRE bursts reached , the estimated mean peak flux implies a distance of 6.7 kpc (see Table 10). Assuming that SAX J1747.02853 was the only active source in the field during the 2001 September observations, the persistent flux was 1.5–, equivalent to an accretion rate of 7–8% . The shortest recurrence times measured for the bursts was 3–4.2 hr.
A.26. IGR J174732721 ( XTE J1747274)
The transient IGR J174732721 (, ) was first detected with INTEGRAL in 2005 March and April Grebenev et al. (2005). One month later, a previously unknown source designated XTE J1747274 was reported in RXTE observations of the Galactic bulge RXTE observations Markwardt & Swank (2005b). Subsequent Swift and Chandra observations of the field detected a single active source, indicating that IGR J174732721 and XTE J1747274 were the same source Kennea et al. (2005); Juett et al. (2005).
Two X-ray bursts were detected in pointed RXTE observations, on 2005 May 24 and 31, which we attributed to this source (see §B.4). The corresponding peak fluxes, taking into account the offset between the pointing direction and the source position, were 5.5 and . Neither burst exhibited oscillations or indications of radius-expansion. The correspoinding upper limit on the distance (from the brightest burst, and adopting the Eddington limit for pure He material) is 6.4 kpc. The rise times were 5 and 7 s, which in addition to the relatively long and 17.4 s indicate H-rich fuel.
A.27. SLX 1744299/300
This close ( separation) pair of Galactic center (, ) sources was discovered during mapping observations with the SL2-XRT instrument aboard Spacelab-2 Skinner et al. (1987). Their dual nature was revealed when a burst was observed from the southern source, with a peak flux of (including a 20% correction for absorption; Skinner et al., 1990). Bursts from this region were also observed by EXOSAT, TTM/Kvant and SAS-3 Lewin et al. (1993).
The source was persistently active in the ASM at (equivalent to 25 mCrab, or in 2–10 keV; see Fig. 8). The source was only observed with the PCA well off-axis in a field containing a number of other sources (see §B.5.1), so it was not possible to measure the flux more precisely. We found 3 bursts in public observations attributable to this pair of sources. The bursts were short, with –7.6 s, and with peak fluxes between 1.4–, roughly consistent with earlier observations.
A.28. GX 3+1
This persistent Galactic center source (, ) was discovered during a rocket flight in 1964 Bowyer et al. (1965), and subsequently proved to be one of the brightest persistent sources in the Galaxy. A detailed study of low-frequency QPOs in this and other sources led to the introduction of the atoll/Z-source classification Hasinger & van der Klis (1989). No optical counterpart is known (e.g. Naylor et al., 1991). Thermonuclear X-ray bursts were discovered during Hakucho observations Makishima et al. (1983). The bursts were observed at a particularly low level, and reached peak fluxes of 4– (see also Lewin et al., 1993). Kuulkers (2002) also found evidence for a possible superburst from RXTE/ASM monitoring; an intermediate-duration event, lasting min, was detected by INTEGRAL Chenevez et al. (2006). The most detailed study of the thermonuclear bursts to date was by den Hartog et al. (2003), who detected 61 bursts with BeppoSAX/WFC and found them remarkably homogeneous with a weighted mean s. The burst rate dropped by a factor of as the persistent flux increased through a relatively small range.
Long-term flux measurements suggest that varies on a time scale of a few years (e.g. Fig. 8). At the peak in 2001–03 the PCA flux was 8–, while during the minimum was 4–. RXTE observations revealed the first radius expansion burst from the source on 1999 August 10 18:35:54 UT Kuulkers & van der Klis (2000), leading to a distance estimate of kpc with estimated uncertainty of up to 30%. The rapid rise (0.75 s) and short duration ( s) of the burst suggests He-rich fuel, and assuming the flux reaches a somewhat larger value of 6.5 kpc is indicated (see Table 10 and den Hartog et al. 2003). In that case, the persistent flux range corresponds to accretion rates of 17–50% . Just one other burst was observed, on 2001 Aug 7 16:38:46 UT, with s and no evidence for PRE. While the was significantly lower than for the PRE burst, the fluence was significantly larger.
A.29. 1A 1744361
This variable source (, ) was discovered in Ariel V observations in 1976 Carpenter et al. (1977). A single X-ray burst was observed from the source in 1989 August by the TTM/COMIS instrument onboard Mir Emelyanov et al. (2001). A new period of activity beginning 2003 November was detected initially by the RXTE/ASM Remillard et al. (2003). RXTE and INTEGRAL detected the source (briefly designated XTE J1748361) again in 2004 April, at which time the optical counterpart was also identified Steeghs et al. (2004). More extensive RXTE observations followed a subsequent outburst in 2005 July, revealing energy-dependent dips separated by 97 min, and a thermonuclear burst with 530 Hz burst oscillations Bhattacharyya et al. (2006a). The correlated spectral and timing variations were similar to those of atoll sources Bhattacharyya et al. (2006b).
The X-ray flux from the RXTE observations was in the range 0.5– (2.5–25 keV). The single X-ray burst was observed when the persistent flux was , and reached a peak flux of . With no evidence for radius expansion, the peak burst flux is a lower limit to the Eddington flux, implying an upper limit on the distance of 11 kpc. At this distance, the X-ray flux range implies an accretion rate between 5 and 18% . The burst was fairly fast, with a 1 s rise time and s. These properties suggest H-poor fuel.
A.30. SAX J1748.92021 in NGC 6440
SAX J1748.92021 is one of an estimated 4–5 LMXBs Pooley et al. (2002) in the globular cluster NGC 6440 (, , kpc; Kuulkers et al., 2003). Transient X-ray emission was detected from the cluster in 1971 Markert et al. (1975); Forman et al. (1976a), 1998 in ’t Zand et al. (1999b), and 2001 in ’t Zand et al. (2001b), although it was not certain initially that the outbursts were all from the same source. An observation with Chandra in 2001 also allowed the optical counterpart to be securely identified in ’t Zand et al. (2001b). Thermonuclear bursts were first detected during the 1998 outburst in ’t Zand et al. (1999b). Three bursts were detected in the WFC, with recurrence times of hr. A similar burst observed with the narrow-field instruments reached a peak flux of . No bursts were detected by RXTE during the 1998 outburst, but observations during the 2001 outburst revealed 16 bursts, one of which exhibited weak evidence for burst oscillations at Hz Kaaret et al. (2003). A subsequent outburst was detected in PCA scans of the Galactic bulge region on 2005 May 12–16 Markwardt & Swank (2005a). Intermittent persistent pulsations at 442 Hz were detected during the 2001 and 2005 outbursts Gavriil et al. (2007); Altamirano et al. (2008). The pulsations exhibited Doppler shifts from an 8.7 hr orbit.
Six of the bursts observed by RXTE exhibited PRE, most with a pronounced double-peaked maximum (see Fig. 9) which varied in flux between 28–. The inferred distance (assuming, based on the short PRE burst duration of s, that the bursts reached ) is 8.1 kpc (see Table 10). The range of measured by RXTE, from prior to the 2001 outburst to (2.5–25 keV) at the peak, thus translates to an inferred accretion rate range of 3–25% (with a bolometric correction averaging over four observations).
The non-PRE bursts bursts had longer durations, on average, and peaked in the range 1.9– (roughly consistent with the burst observed by the BeppoSAX/NFI; in ’t Zand et al., 1999b). The inferred burst recurrence times varied between 1.02–1.90 hr, rather faster than in previous observations in ’t Zand et al. (1999b). While the measured was not correlated with (which only varied by about 9% rms over the observations with bursts), it was strongly anticorrelated with , with –150 for the fast bursts and –65 for the slow bursts. This is consistent with the fast bursts arising primarily from He burning, while in the slow bursts the fuel is a mixture of H/He (see also Fig. 14). Perhaps most interestingly, the long and short bursts appeared to alternate independently of the persistent flux.
A.31. EXO 1745248 in Terzan 5
EXO 1745248, in the Galactic bulge (, ) globular cluster Terzan 5, was discovered during Hakucho observations of the region Makishima et al. (1981b). The source has been noted for episodic burst behaviour, as well as burst intervals as short as 8 min (Inoue et al. 1984; see also Lewin et al. 1993). PCA/RXTE scans of the bulge detected a new transient outburst in 2000 July Markwardt & Swank (2000). Followup pointed observations initially revealed 15 X-ray bursts with an average separation of 25 min, as well as dipping activity and QPOs around 65 and 134 mHz Markwardt et al. (2000).
Prior to the outburst peak, the source was active at a flux level of 1– (2.5–25 keV). During this time we detected 21 type-I bursts with peak fluxes of 3–, and no evidence for PRE. For those observations where we saw more than one burst, the recurrence times were between 17 and 49 min. The estimated -values were in the range 20–46 which (along with the long burst durations s) indicates H-rich fuel. Following the outburst peak (between August 15–18) the frequent bursting ceased, and just two more bursts were observed, on September 24 and October 2. These two bursts were of markedly different character to those prior to outburst maximum, with peak fluxes of , shorter durations of and 7.3 s, and both exhibiting strong PRE (see Fig. 9; Kuulkers et al., 2003). For the distance of 8.7 kpc for Terzan 5 derived by Kuulkers et al. (2003), we expect an Eddington flux for cosmic abundances of , or for pure He; thus, the two PRE bursts appear to be super-Eddington by a factor of at least 2. However, the burst peak fluxes are consistent with the more recent distance of kpc (Ortolani et al., 2007, cf. with Table 10). Kuulkers et al. (2003) also noted that the peak fluxes for PRE bursts from this source measured by different instruments exhibited a large (factor of ) variation.
A.32. 4U 174637 in NGC 6441
Persistent emission from 4U 174637 (, ) was first recorded in the 3rd Uhuru catalog Giacconi et al. (1974); thermonuclear X-ray bursts were probably first observed during SAS-3 observations Li & Clark (1977). PRE bursts have previously been observed by EXOSAT Sztajno et al. (1987) with peak fluxes of (see also Lewin et al., 1993; Kuulkers et al., 2003). Periodic intensity dips every 5.7 hr were reported from Ginga observations Sansom et al. (1993); more recent analysis of RXTE data indicate a somewhat shorter dip period of hr Bałucińska-Church et al. (2004). The optical counterpart, identified from an HST image following Chandra observations, also shows variations which are consistent with a period of hr Homer et al. (2002).
4U 174637 was active but variable at between 0.16– (2.5–25 keV) throughout the RXTE observations. For the distance to the cluster of kpc Kuulkers et al. (2003) this corresponds to a range of accretion rates of 2–16% (for a bolometric correction of between 1.09–1.45, depending upon the epoch). The catalog contains a total of 30 bursts from 4U 174637. The burst properties were clustered into three groups, depending upon the persistent flux level; at (2.5–25 keV), we detected long-duration bursts with s in the mean, while at higher the bursts fell into two groups, one even longer duration with s and the other very short with s. This latter group included three PRE bursts, which reached peak fluxes a factor of two lower than previous PRE bursts from the source, at (see also §3.1 and Table 10). We note that Kuulkers et al. (2003) did not categorize these three bursts as PRE. Overall the peak fluxes were approximately bimodally distributed, with 15 bursts reaching fluxes between (0.4–, and the rest peaking at between (3.8–. The characteristic -values for the bright bursts ( s) was 35–50, while for the faint bursts ( s) was 140–180 (we note that 4U 170544 was the only other source with bursts with s and ).
On two separate occasions (1996 October 25–27 and 1998 November 7th), a train of regular bright (faint) bursts was interrupted by an out-of-phase faint (bright) burst. As discussed by Galloway et al. (2004a), such interrupted regular bursting has not been previously observed, and is difficult to understand in the context of standard burst models. An alternative possibility is the presence of two sources in the cluster, bursting independently. From the stellar encounter rate for the host cluster NGC 6441 (which is the second-highest of all Galactic globular clusters), we expect around 6 LMXBs in the cluster Pooley et al. (2003); Heinke et al. (2003). High spatial resolution observations during intervals of burst activity are required in order to independently localize individual bursts and confirm this hypothesis.
A.33. SAX J1750.82900
This Galactic center (, ) source was first detected by BeppoSAX in 1997 as a weak, bursting transient Natalucci et al. (1999). The source was detected in outburst once more in 2001 March, exhibiting an initial rise and steep fall early in March, followed by a second peak around April 21.
We found four bursts between 2001 April 6–15 attributable to the source, three of which were bright with and two of those with evidence for PRE. The corresponding distance estimate (assuming, given the short durations –7.3 s of the bursts, that they reach ) is kpc (see Table 10). Burst oscillations at 600.75 Hz were detected in the second burst on 2001 April 12, which also exhibited PRE implying a distance kpc Kaaret et al. (2002). The peak flux measured by the PCA during the 2001 outburst was (2.5–25 keV), which corresponds to 13% ; during the secondary peak the source reached , while the persistent level was (% , although the flux may contain contribution from other souces in the field; see §B.2). The shortest recurrence time measured, between one of the PRE bursts and the final, faint burst (, 2.5–25 keV) was 1.58 hr.
A.34. GRS 1747312 in Terzan 6
GRS 1747312 (, ), in the globular cluster Terzan 6, was discovered by ART-P/GRANAT in 1990–1992 Pavlinsky et al. (1994). RXTE observations revealed quasi-periodic outbursts every months, as well as thermonuclear bursts, eclipses and dips in ’t Zand et al. (2003a). The orbital period is 12.36 hr.
RXTE/PCA observations of two successive outbursts in 2001 May-June and October found a maximum persistent flux of 8– (2.5–25 keV); the minimum flux measured following the first outburst was . At the distance to the host cluster of kpc Kuulkers et al. (2003), this corresponds to a range of accretion rates of 0.6–8% . Of the seven bursts from public RXTE observations towards GRS 1747312, four have been previously discussed by in ’t Zand et al. (2003a). The bursts had short durations, of s on average. Two of the bursts exhibited PRE, and despite their similar profiles reached distinctly different peak fluxes of and respectively (see also §3.1 and Kuulkers et al., 2003). The first PRE burst may have been fainter because it actually originated from the nearby () source SAX J1752.33138 Cocchi et al. (2001b) instead. If that was the case, the corrected peak flux would be consistent with the earlier PRE burst observed from that source by BeppoSAX. With only 4 PCUs on during that observation, and rather low count rate at the peak of the burst, it was not possible to rule out either source as the origin. Furthermore, for none of the other 3 bursts can we rule out an origin at GRS 1747312, so that we can attribute none of the bursts concusively to SAX J1752.33138. Thus, we attribute all the bursts to GRS 1747312.
One additional PRE burst was observed in the field of the millisecond X-ray pulsar XTE J1751305, but was subsequently attributed to GRS 1747312 in ’t Zand et al. (2003c). This burst exhibited approximately constant flux for s, interrupted between 10–30 s by an excursion up to a maximum flux of almost a factor of two higher (see Fig. 9). During this excursion, however, the blackbody radius reached a maximum, and the color temperature reached a minimum of keV, at which level extrapolating the blackbody spectra outside the PCA bandpass becomes particularly error-prone. Thus, for this burst we exclude the data during the radius maximum for the purposes of calculating the peak flux, and instead adopt the mean peak flux between 5–10 and 30–50 s as the peak, i.e. . Even with this correction, the peak flux significantly exceeds than that of the other two PRE bursts, leading to a fractional standard deviation of peak PRE burst flux of 38%, the largest of any of the sources with PRE bursts (see §3.1). The estimated fluence for the brightest PRE burst was almost thirty times larger than the next most energetic PRE burst; the profile was similar to other extreme bursts from 4U 1724307 (see §A.15) and 4U 2129+12 (§A.47).
A.35. XTE J1759220
This quasi-persistent source towards the Galactic bulge (, ) was detected by INTEGRAL between 2003 March–April Lutovinov et al. (2003), and was subsequently identified with a new source detected by RXTE since 2001 February Markwardt & Swank (2003a). Significant spectral variability was measured during the INTEGRAL observations between 2003 and 2004, suggestive of transitions between low/hard and soft/high states Lutovinov et al. (2005). In addition, there was evidence of dipping behaviour in the RXTE observations, suggesting high inclination. A single X-ray burst was detected in an RXTE observation on 2004 September 13. The burst was faint, reaching a peak flux of just . Both the slow (4 s) rise and long s indicate a H-rich burst; the upper limit on the distance (assuming ) is 16 kpc. Assuming that the source is equidistant with the Galactic bulge, the distance is kpc. The X-ray flux measured by RXTE during 2004 Mar–September was between 2– (2.5–25 keV). For a distance of 8.5 kpc, this corresponds to an accretion rate of a few percent .
A.36. SAX J1808.43658
The first accreting millisecond X-ray pulsar, SAX J1808.43658 (, ) was discovered during BeppoSAX/WFC observations in ’t Zand et al. (1998b). Two bright thermonuclear bursts were also observed from the source, separated by 14 hr. RXTE observations during a subsequent outburst in 1998 revealed persistent millisecond pulsations at 401 Hz Wijnands & van der Klis (1998), modulated by Doppler shifts arising from a 2.1 hr binary orbit Chakrabarty & Morgan (1998). Giles et al. (1999) made observations of the (in quiescence) optical counterpart as it faded following the outburst peak. Reanalysis of the 1996 BeppoSAX discovery observations revealed a third, previously undetected, brighter burst, leading to a revised distance estimate of 2.5 kpc in ’t Zand et al. (2001a). The source has continued to exhibit outbursts every yr; the latest was in 2005 June (Markwardt et al. 2005; see also Wijnands 2004). At the peak of the October 2002 outburst four bursts were observed by RXTE/PCA, each with burst oscillations also at 401 Hz, confirming the link with the NS spin Chakrabarty et al. (2003). One of these bursts exhibited a faint precursor event, 1 s the burst, also exhibiting oscillations Bhattacharyya & Strohmayer (2007); variations in the observed oscillation frequency have been interpreted as arising from spreading of the burning front following ignition at mid-latitudes of the neutron star Bhattacharyya & Strohmayer (2006c).
The 2002 outburst was the best sampled so far by RXTE, and reached a maximum persistent flux of (2.5–25 keV). The four bursts were all observed within a 100 hr interval just after the outburst peak, and the last three were separated by 21.1 and 29.8 hr, respectively. The bursts were quite homogeneous, all exhibiting strong PRE; the fluence increased steadily by 30%, and by 20% (total) as decreased. The peak fluxes exhibited little variation and indicate a distance of 2.77 (3.61) kpc assuming the bursts reach (; see also Table 10). For kpc the peak persistent flux corresponds to a maximum accretion rate of just 5.5% (adopting a bolometric correction averaging over four observations near the peak). The estimated -values for the last two burst intervals were and 167, respectively.
The -values, as well as the fast rise times ( s) suggest almost pure He fuel. A comparison of the burst properties with an igition model Cumming & Bildsten (2000) indicates that the mean H-fraction at ignition is Galloway & Cumming (2006). These are the first He-rich bursts which have been securely observationally identified. The ignition model comparison allowed an estimate of the distance, which was consistent with the estimate derived by equating the long-term time-averaged X-ray flux with the expected mass transfer rate due to gravitational radiation, as well as the peak flux of the bursts. The derived distance range for the source is 3.4–3.6 kpc.
A.37. XTE J1814338
XTE J1814338 (, ) was discovered in outburst during RXTE/PCA scans of the Galactic center region Markwardt & Swank (2003b). Subsequent PCA observations revealed persistent pulsations at 314.4 Hz, making this source the fifth known accretion-powered millisecond pulsar Strohmayer et al. (2003). Doppler variations in the persistent pulsation frequency indicate an orbital period of 4.28 hr. A total of 28 bursts were observed throughout the outburst, all with burst oscillations at the pulsar frequency (see e.g. Watts et al., 2005), and all without conclusive evidence of PRE. From the maximum peak flux of the bursts, an upper limit to the distance of kpc is derived.
The persistent flux level while the source was bursting was 0.4–, equivalent to 3.6–4.5% averaged over the NS surface (for kpc and a bolometric correction of ). We found five bursts separated by hr. The burst times were not consistent with a constant , and instead suggest irregular reccurence times of 4–6 hr (with longer intervals resulting from missed bursts in data gaps). The two bursts with shorter recurrence times (1.7 and 2.3 hr) both had fluences around (as did three others), while the remainder had fluences of in the mean. Thus, the burst behaviour appears to consist of irregular bursts with recurrence times of 4–6 hr and roughly constant fluence interrupted occasionally by bursts with approximately half the fluence, occurring after approximately half the usual interval. The measured alpha values from the bursts with recurrence times hr ranged between 55–100. The low values, coupled with the relatively long burst time scales of in the mean indicate that mixed H/He makes up the burst fuel.
The burst behaviour of XTE J1814338 is in marked contrast to the infrequent, He-rich bursts observed at similar accretion rates from the other accretion-powered millisecond X-ray pulsars, SAX J1808.43658 (see §A.36) and HETE J1900.12455 (§A.43). The long bursts in XTE J1814338 may arise instead from H-ignition, as is seen in EXO 0748676 (§A.2).
A.38. GX 17+2
One of the first cosmic X-ray sources ever detected (e.g. Bradt et al., 1968), GX 17+2 (, ) is one of the few Z-sources which exhibits thermonuclear bursts Hasinger & van der Klis (1989). Despite a precise position from radio detection Hjellming (1978) the optical counterpart long eluded observers; HST observations finally led to identification of a variable IR counterpart Deutsch et al. (1999); Callanan et al. (2002) with mag modulation on a time scale of days to weeks Bandyopadhyay et al. (2002). Bursting behaviour was discovered with Hakucho Oda et al. (1981); the unique features of the characteristic long bursts unique to this source (rise time 1.5 s, duration 3–15 min) were subsequently discussed by Tawara et al. (1984). Difficulties for the “standard” burst analysis presented by these long (as well as short s) bursts were explored by Sztajno et al. (1986), who concluded they were indeed type-I (thermonuclear) bursts. A search for superbursts in BeppoSAX/WFC data was presented by in ’t Zand et al. (2004b).
GX 17+2 was persistently bright during the RXTE observations at 15–. RXTE observed 12 thermonuclear bursts from the source, 10 of which were studied in detail previously by Kuulkers et al. (2002). One additional event, on 1998 Nov 19 03:39:10 UT, was not discussed by those authors; however, the lack of spectral softening during this event appears to rule out a thermonuclear burst. Instead, this event, along with the four other “flares” noted by Kuulkers et al. (2002) may be type-II bursts (i.e. accretion instability events), analogous to those observed in the Rapid Burster and previously observed from GX 17+2 during Einstein observations Kahn & Grindlay (1984). Two of the short ( s) and six of the long (–300 s) bursts exhibited indications of PRE, with peak fluxes of in the mean. Neglecting the persistent emission, this suggests a distance of 9.8 (12.8) kpc, assuming the bursts reach (). In GX 17+2, as distinct from almost all the other bursters, the persistent flux is comparable to the peak burst flux; even for a distance of 10 kpc, the persistent flux level suggests accretion rates consistently (for a bolometric correction of ). Thus, the estimated distance will be significantly closer if we sum the two contributions for our estimate of the Eddington flux. However, we note that detailed spectral studies seem to indicate that the two are truly independent, so that combining them may not be correct Kuulkers et al. (2002). We found three pairs of bursts with relatively short intervals of 5.77, 13.0 and 11.5 hr, and assuming that this represents the recurrence time, we derive , and , respectively. The first two bursts were of short duration, while the third was long with s, and followed another long ( s) burst.
A.39. 3A 1820303 ( Sgr X-4) in NGC 6624
Thermonuclear bursts from this globular cluster source at , were first discovered by ANS Grindlay et al. (1976), although some bursts were observed earlier but not initially detected by SAS-3 Clark et al. (1976). The UV/optical counterpart detected by King et al. (1993) was later confirmed by the detection of periodic variations at s (King & Watson 1986; Stella et al. 1987; see also Anderson et al. 1997). The NS is thus in an ultracompact binary with an evolved, H-poor companion, and one of the shortest orbital periods known. The source is also notable for a steady long-term (176 d) periodicity in the persistent X-ray intensity, detected initially with Vela 5-B observations (Priedhorsky & Terrell, 1984a, see also Fig. 8). Long-term observations indicate that regular motions throughout the color-color diagram of this atoll source also reflect the 176 d period Bloser et al. (2000). Some authors have suggested that this periodicity indicates that the source is in fact a heirarchical triple (e.g. Chou & Grindlay, 2001).
X-ray burst activity appears to be confined to within d of the minima in the long-term periodicity. A 20 hr EXOSAT observation found 7 extremely regular ( hr) PRE bursts Haberl et al. (1987); PRE bursts were also detected by SAS-3 Vacca et al. (1986). The was found to decrease with increasing Clark et al. (1977), up to a critical level of around (i.e. % for kpc; Kuulkers et al. 2003) at which the bursts stopped completely. A comparison of the burst properties with theoretical ignition models indicates pure He fuel, which is consistent with the expected H-poor nature of the donor Cumming (2003). RXTE observations also revealed a “superburst” with 3 hr duration, following (by s) a normal (type I) thermonuclear burst Strohmayer & Brown (2002).
The RXTE observations of 3A 1820303 were almost always made when the source was above the critical threshold for burst activity; the persistent flux level was 3– (2.5–25 keV). For kpc (the host cluster distance; Kuulkers et al., 2003). this is equivalent to 18–95% . As a result, only five thermonuclear bursts were detected, when the source was between –. All five bursts exhibited extreme PRE and reached fluxes of around , leading to a distance estimate of 6.4 kpc (for , based on the H-poor nature of the mass donor). This value is somewhat lower than the distance to NGC 6624, indicating that the bursts are slightly under-luminous.
A.40. GS 1826238
This quasi-persistent source (, ) was discovered during Ginga observations Tanaka (1989). Thermonuclear bursts were first conclusively detected by BeppoSAX Ubertini et al. (1997), although this source may also have been the origin of X-ray bursts observed much earlier by OSO-8 Becker et al. (1976). Optical photometry of the counterpart Motch et al. (1994); Barret et al. (1995) revealed a 2.1 hr modulation, as well as optical bursts Homer et al. (1998). The delay time measured between the X-ray and optical bursts is consistent with the binary separation for a 2.1 hr orbit (see also Kong et al., 2000). Based on optical measurements, the distance to the source is at least 4 kpc Barret et al. (1995); since no PRE bursts have been observed, an upper limit of 8 kpc has been derived from the peak fluxes of bursts measured by BeppoSAX, ASCA and RXTE in ’t Zand et al. (1999a); Kong et al. (2000), placing the source just outside the Galactic bulge. Analysis of the bursts observed by the BeppoSAX/WFC revealed that the source consistently exhibits approximately periodic bursts, with a recurrence time which decreases significantly as the persistent flux increases Ubertini et al. (1999); Cornelisse et al. (2003).
RXTE observations revealed that the source intensity steadily increased between 1997–2003, from 1.1– (2.5–25 keV). For kpc, this corresponds to a range of accretion rates of 5–9% (for a bolometric correction of ). We detected a total of 54 remarkably homogeneous, long ( s, rise time s) bursts in the RXTE observations, with regular recurrence times that decreased proportionately with the increase in (Galloway et al. 2004b; see also §3.4). The mean -value was 141414Note that this is slightly smaller than the value quoted by Galloway et al. (2004b) of , due to an improved estimate of the burst fluence. The fractional variation in with is unchanged., indicating a high proportion of H in the burst fuel. None of the bursts exhibited any evidence for PRE.
A.41. XB 1832330 in NGC 6652
This globular-cluster source at , was discovered by ROSAT during a probable transient outburst Predehl et al. (1991); the first thermonuclear bursts were observed by BeppoSAX in ’t Zand et al. (1998c). The bursts were long, with exponential decay times of 16 and 27 s, and peak fluxes of (bolometric). A third burst was detected by ASCA, reaching a peak flux of Mukai & Smale (2000). A Chandra observation reavealed 3 new sources in the cluster, and the improved position for XB 1832330 allowed identification of the blue variable optical counterpart from archival HST observations Heinke et al. (2001). Sparse optical data suggest a 43.6 min periodic intensity modulation with semiamplitude 30% Deutsch et al. (2000), although no periodic modulation of the X-rays was seen in 2001 by BeppoSAX Parmar et al. (2001). A 43.6 min period would indicate an ultracompact binary with an evolved, likely H-poor companion similar to 3A 182030 (see §A.39).
RXTE/PCA measurements in 1998 and 2001–2 indicate a flux of 2– (2.5–25 keV), although this may include contributions from the other (typically quiescent) LMXBs in the cluster. For kpc Kuulkers et al. (2003), this gives an upper limit to the accretion rate in XB 1832330 of 2–3% . We found just one burst in public RXTE observations, on 1998 November 27 05:45:15 UT. The blackbody radius reached local maxima during the rise and near the flux maximum, and the simultaneous inflection of the blackbody temperature suggests that this burst may have experienced modest PRE (although see Kuulkers et al., 2003). The peak flux suggests a distance consistent with that of the host cluster, assuming the burst reached (see Table 10). The burst exhibited a steep initial decay, but then a long s tail (Fig. 9), so that the overall was long at 21.4 s.
A.42. 3A 1837+049 ( Ser X-1)
This persistent source at , was first detected in early rocket flights Bowyer et al. (1965). A more precise position from SAS-3 observations Doxsey (1975) led to a suggested optical counterpart Davidsen (1975); later observations revealed that this candidate was actually two stars, one of which (with Heii 4686 Å emission) was the counterpart Thorstensen et al. (1980). The inferred ratio is . X-ray bursts were discovered more or less simultaneously by OSO-8 Swank et al. (1976c) and SAS-3 Li et al. (1977). The bursts exhibited irregular recurrence times of 1–38 hr, average s, and showed no indications of PRE (Sztajno et al. 1983; see also Lewin et al. 1993). The variations in burst interval were apparently independent of , although increased with . A “superburst” was detected by BeppoSAX Cornelisse et al. (2002a), after which regular thermonuclear bursts were not detected for 34 d.
The source was persistently bright at 4– (2.5–25 keV) in RXTE/PCA observations. We found 7 bursts in public data, two of which exhibited weak PRE indicating a distance of 7.7 (10) kpc assuming the bursts reached (; see Table 10). We note that one other burst exceeded the peak flux of the two PRE bursts by % but did not itself exhibit PRE. The corresponding accretion rate range is 38–56% (for a bolometric correction of ). The bursts were of short duration, with mean s. We found one pair of bursts separated by 7.99 hr, from which we derived (although there may have been intermediate bursts which were missed during Earth occultations).
A.43. HETE J1900.12455
This source (, ) was discovered on 2005 June 14 when a strong thermonuclear (type-I) burst was detected by HETE-II Vanderspek et al. (2005). A subsequent PCA observation of the field on 2005 June 16 revealed 2% rms pulsations at 377.3 Hz, confirming the bursting source as the seventh accretion-powered millisecond pulsar Morgan et al. (2005). A series of followup PCA observations allowed measurements of Doppler shifts of the apparent pulsar frequency on the is 83.25 min orbital period Kaaret et al. (2005). The optical counterpart was identified by its brightening to during outburst Fox (2005). Based on the peak flux of the burst observed by HETE-II, the distance was estimated at 5 kpc Kawai et al. (2005).
Two bursts were detected during followup PCA observations, the first on 2005 July 21. The burst profile was complex, with a precursor lasting 2 s, followed by a slower rise to a maximum of lasting approximately 20 s. While the burst flux was close to maximum, the blackbody radius reached two successive local maxima, each accompanied by local minima in the blackbody temperature. The second burst was much less energetic, reaching a peak flux % lower, and with a total fluence only a quarter of the first burst. Assuming both bursts reached the Eddington limit for pure He material, the distance to the source is kpc, consistent with the earlier estimate from the first burst observed by HETE-II by Kawai et al. (2005).
The source activity continued for more than 1 yr after the outburst began (e.g. Galloway et al., 2005). This is much longer than the typical outburst duration for the other accretion-powered millisecond pulsars ( weeks), and a factor of three longer than the previous record-holder, XTE J1814338, at 50 d (see §A.37). The inferred accretion rate (for a bolometric correction of ) was 2–3% . Should activity persist at this level indefinitely, HETE J1900.12455 will have the highest time-averaged accretion rate of all the millisecond pulsars.
A.44. Aql X-1
One of the earliest cosmic X-ray sources detected (e.g. Friedman et al., 1967), Aql X-1 (, ) is a recurrent transient with a quasi-regular outburst interval variously reported as d (e.g. Kaluzienski et al., 1977), 122–125 d Priedhorsky & Terrell (1984b), or 309 d Kitamoto et al. (1993). Optical photometry of the highly variable (–17) K0 counterpart Thorstensen et al. (1978) throughout an outburst revealed a 19 hr period, assumed initially to be the binary period Chevalier & Ilovaisky (1991). The -band periodicity is twice this value Shahbaz et al. (1998). Thermonuclear bursts were probably first detected by SAS-3 Lewin et al. (1976e), but were confirmed during Hakucho observations in the declining phase of an outburst Koyama et al. (1981). The bursts reached peak fluxes between 7–, with time scales –18 s (e.g. Lewin et al., 1993). RXTE observations during an outburst in 1997 February–March revealed a QPO in the frequency range 740–830 Hz as well as burst oscillations around 549 Hz Zhang et al. (1998). More recently, Casella et al. (2007) reported detection of persistent pulsations at a frequency just above the burst oscillation frequency, in an otherwise unremarkable 150 s stretch of data. Note the nearby source 1A 1905+00 (), which has also exhibited bursts (Lewin et al., 1976e, see also Table 3). While bursts were detected during RXTE observations centered on this source, we attributed them all to Aql X-1 instead (see §B.3).
RXTE has observed around 8 outbursts since 1996 (Fig. 8). The 2.5–25 keV flux reached 2– at the peak of these outbursts. The 57 bursts detected by RXTE occurred at levels which span more than an order of magnitude. The burst properties were correspondingly diverse, and indicate three approximately distinct groups: one with short time scales (–10) and rather low fluences, another of non-radius expansion bursts with –30 and a third group which have –15. It is this third group in which all the bursts which exhibit PRE and oscillations occur. The peak flux of the PRE bursts indicates a distance of 3.5 (4.5) kpc, assuming the bursts reach (). The peak accretion rate reached during the outbursts is thus 6–56% (for kpc and a bolometric correction of ). We also found six instances of short recurrence times, between 8–22 min, including a burst triplet on 2005 April 16–17. Triplets of closely-spaced bursts have been observed only from a handful of sources, including EXO 0748676 Boirin et al. (2007), 4U 170544 (see §A.11), and 4U 160852 (§A.7). As is typical for short- bursts, the fluence of these bursts was significantly smaller than the mean value, and the bursts occurred at low persistent flux levels, in the range 0.2–8% (see also §3.8.2).
A.45. 4U 1916053
This source at , was discovered by the Uhuru satellite Giacconi et al. (1972). EXOSAT observations revealed irregular X-ray dipping behaviour with a period of min Walter et al. (1982); White & Swank (1982), which optical observations of the companion confirmed was approximately the orbital period Grindlay et al. (1988). The source is thus an “ultracompact” system, which cannot accommodate a H-rich mass donor. Bursts were first observed from the source by OSO-8 Becker et al. (1977), and were subsequently detected by SAS-3, HEAO-1 and EXOSAT (see Lewin et al., 1993). The typical burst interval is 4–6 hr, although bursts may sometimes occur at longer intervals or not at all. Bursts exhibiting PRE suggest a source distance of 8.4–10.8 kpc Smale et al. (1988). Measured -values vary between 120–170; burst durations are typically s, but may be up to a factor of two longer. A burst oscillation at 270 Hz was discovered in a single burst observed by RXTE, on 1998 August 1 Galloway et al. (2001). This source is the only one in which the burst oscillation frequency is significantly below the kHz QPO peak separation.
The persistent flux of the source was between 0.2- (2.5–25 keV) throughout the RXTE observations, although we note that these values are not corrected for the presence of dips. We found a total of 14 bursts from the source, with 12 exhibiting PRE. The inferred distance is 7–9 kpc (see Table 10), giving a range of accretion rates of 1.5–8% (for kpc and a bolometric correction of ). The bursts were short, with s, although one burst (which also had the largest fluence) exhibited a much broader peak, resulting in s. Just one pair of bursts were separated by hr, on 1998 July 23, with hr; from these two bursts we calculate , equivalent to a mean H-fraction at ignition of (equation 6).
A.46. XTE J2123058
This source (, ) was discovered as an X-ray transient by RXTE in late June 1998 Levine et al. (1998). The optical counterpart was identified and found to have a 5.96 hr periodic optical modulation, identical to the spectroscopic period Tomsick et al. (1999). The counterpart was monitored extensively throughout the outburst (e.g. Soria et al., 1999), and into quiescence. Keck measurements resulted in a narrowing of the distance range to kpc (Tomsick et al. 2001; see also Tomsick et al. 2002). RXTE observations revealed thermonuclear X-ray bursts and high-frequency QPOs Homan et al. (1999); optical bursts have also been detected.
The peak PCA flux during the 1998 outburst was (2.5–25 keV). At kpc, this corresponds to 11% (for a bolometric correction of ). We found a total of 6 weak bursts from the source, the two brightest (on 1998 July 22) reaching a peak of just . The remaining four bursts all reached peak fluxes below . None of the bursts exhibited PRE; the peak fluxes were all well below the expected value for bursts reaching at 8.5 kpc. The two brightest bursts were separated by just 6.5 hr, which for the persistent flux level measured during the observation leads to an . Such a large value suggests that intervening bursts may have been missed in data gaps, or that only a fraction of the accreted material was burned.
A.47. 4U 2129+12 ( AC 211) in M15
This source (, ) is one of two bright LMXBs in the globular cluster M15 ( kpc; Kuulkers et al., 2003), separated by just White & Angelini (2001). Originally the x-ray source was identified with the 17.1 hr binary AC 211 Ilovaisky et al. (1993); Auriere et al. (1984); Charles et al. (1986); the other source, M15 X-2, is the suggested origin of the strong PRE bursts observed by Ginga Dotani et al. (1990); van Paradijs et al. (1990a), RXTE/PCA Smale (2001), BeppoSAX/WFC Kuulkers et al. (2003) and RXTE/ASM Charles et al. (2002). The latter work also identified 15 burst candidates in the ASM data, leading to a lower limit on the burst recurrence time of 1.9 d.
The PCA flux of the source in observations in 1997 and 2000 was 2– (2.5–25 keV). Although this flux contains contributions from both LMXBs, White & Angelini (2001) found M15 X-2 (the suggested origin of the bursts) to be 2.5 times brighter than M15 X-1, so that the inferred range of accretion rate of 2–4% should be approximately correct. The inferred is also consistent with the long burst recurrence times of d. The single burst observed by RXTE/PCA, on 2000 September 22, peaked at (note that the higher value of quoted by Smale 2001 was derived using the older response matrices), which agrees well with the peak flux of the burst observed by Ginga of . Although the burst duration was long, with s (see Fig. 9), the Ginga burst was even longer. The burst exhibited very strong radius expansion, similar to that seen in the bursts from 4U 1724307 (§A.15, Fig. 11) and GRS 1747312 (§A.34) although insufficient to drive the emission at the radius peak completely out of the PCA band (the minimum blackbody temperature reached was 0.8 keV). As noted by Kuulkers et al. (2003), the peak fluxes of these bursts are substantially in excess of the expected range of for kpc.
A.48. Cyg X-2
This source (, ) was detected in the very first observations which indicated the existence of cosmic X-ray sources Giacconi et al. (1962). A optical counterpart was identified shortly afterwards Giacconi et al. (1967); the binary orbit is very wide, with hr Cowley et al. (1979). An event resembling a thermonuclear burst was first observed during Einstein observations (Kahn & Grindlay 1984; see also Lewin et al. 1993). In their analysis of an event observed by RXTE, Smale (1998) detected a decrease in color temperature late in the burst, following an apparent PRE episode. This appeared to confirm the thermonuclear nature of these events, as well as allowing a distance estimate of kpc to be made. At accretion rates comparable to the Eddington limit, which is typical for this Z source, it is expected that bursts should be extremely infrequent or absent altogether since the temperature in the accreted layer may be sufficient for the accreted fuel to burn stably, instead. That the bursts have such short time-scales presents an additional puzzle, since in other sources such bursts are identified with pure He fuel, whereas at the high typical for Cyg X-2 it is expected that a substantial H-fraction remains at ignition (see also Kuulkers et al., 2002).
Cyg X-2 was persistently bright in RXTE/PCA observations at 6–, with a mean level of . For kpc, this corresponds to accretion rates of , and for much of the time well in excess of . We found 55 burst-like events from Cyg X-2 in public data from RXTE, including 8 apparently exhibiting PRE (similar to the burst on 1996 Mar 27 14:29:07 UT analysed by Smale, 1998). The mean peak flux of these bursts suggests a distance of 11 (14) kpc, assuming the bursts reach (; see Table 10). However, some of the PRE bursts did not exhibit any decrease in following the peak. Furthermore, only a handful of the other events showed a decrease in following the maximum flux. In many bursts, was constant or even increased with time throughout the burst. Thus, we consider there to be some doubt yet as to the thermonuclear explanation for these bursts.
Appendix B Determining the origin of bursts
The mechanical collimators on each of the PCUs aboard RXTE admit photons over a relatively large field of view ( radius). The collimator response decreases approximately , where is the angle between the source position and the nominal pointing direction, in degrees. The wide field of view means that correctly attributing bursts to sources in crowded fields (particularly the Galactic center) is problematic.
Where bursts were observed in fields containing multiple sources, we attempted to match the bursts with the known characteristics of individual sources (see Table Thermonuclear (type-I) X-ray bursts observed by the Rossi X-ray Timing Explorer). We also exploited the fact that the 5 PCUs are not perfectly aligned. As a result, the ratio of observed count rates in each PCU depends upon the position of the source within the field of view. From the modeled collimator responses for each PCU we have deduced the most probable origin for each burst. We first determined an interval covering the burst over which the count rate was greater than % of the maximum (neglecting the pre-burst persistent emission), and accumulated all the counts observed in each PCU over this interval. We then stepped over a grid of positions covering the field of view and performed a linear fit to test the hypothesis that the variations in the PCU-to-PCU total count rates arose solely from differences in the collimator responses at each position. Although we used the same set of collimator responses over all gain epochs, we renormalised the responses based on observed count rates for Crab observations close in time to each burst. We then identified the source at which position we found the minimum goodness of fit statistic () as the most probable origin of the burst.
Naturally, this calculation can most easily distinguish between sources which are widely separated in the field of view. For more crowded fields, we may only be able to narrow down the possible origin as one of a few nearby sources. While this method works best for very bright bursts, where we observe only faint bursts (whether intrinsically faint or originating from sources that are far off-axis), we can combine counts from multiple bursts, so long as the pointing and spacecraft orientation is consistent, to improve the localization.
Once the burst origin was identified with confidence, for bursts observed off-axis we scaled the measured burst flux and fluence by the ratio of the collimator response (averaged over those PCUs that were operating) at the aimpoint, to the response at the source location.
Below we describe close pairs of bursting sources, and the attribution of bursts in each case. Where a burst from an observation centered on one source is later attributed to another, we flag that burst as uncertain in origin in Table 5.
B.1. 4U 172834 and the Rapid burster ()
4U 172834 is one of the most prolific bursters (see §3.1), and also produces a large proportion of PRE bursts Galloway et al. (2003). The Rapid Burster, on the other hand, tends to produce preferentially non-PRE thermonuclear bursts Fox et al. (2001), in addition to the much more frequent type-II bursts (e.g. Lewin et al., 1993). The peak fluxes of the majority of bursts observed in the 4U 172834 field were bimodally distributed, with non-PRE bursts peaking at around on average, and PRE bursts peaking at . We also observed six bursts with peak fluxes around and no evidence of PRE, each close to the time of one of the semi-regular transient Rapid Burster outbursts. Four of these bursts (on 1996 May 3 13:56:30, 13:57:49, 13:59:15 and 14:00:16 UT; obsid #10410-01-01-00) had no evidence of decreasing blackbody temperature with time, and also exhibited recurrence times much shorter than expected for thermonuclear bursts ( s). Thus, we identified these as type-II bursts from the Rapid Burster. The other two bursts (on 2001 May 27 09:15:59 and May 29 09:05:57 UT) did, however, show weak evidence of cooling. The first of these bursts was consistent with an origin at either 4U 172834 or the Rapid Burster, but the second was consistent with an origin only at the latter source (4U 172834 was excluded at the level). Based on this evidence, and the similar long s for these bursts, we identified them as type-I bursts from the Rapid Burster.
The majority of the bursts observed in the field centered on the Rapid Burster, on the other hand, peaked at with relatively long rise times ( s) and time scales (). At least 13 bursts were notable exceptions, with profiles much more similar to bursts from 4U 172834. The Rapid Burster was excluded as an origin for these bursts at (typically) the 3– level. Thus, we attribute these bursts to 4U 172834, instead. We note that the corrected peak fluxes were similar to the other bursts observed from 4U 172834.
B.2. SAX J1750.82900 and SAX J1747.02853 ()
Four bursts were observed in the field of SAX J1750.82900 (see §A.33) and SAX J1747.02853 (see §A.25) by RXTE, all during the rise to the second peak of the SAX J1750.82900 outburst. Three of the bursts reached apparent peak fluxes of , and two of those exhibited PRE, while the fourth reached just . The three bright bursts exhibited count rate variations between the PCUs inconsistent to a high level of confidence with an origin at SAX J1747.02853; furthermore, their corrected peak fluxes (assuming they arose instead from that source) would also be inconsistent with the distance to the Galactic center. While the origin of the faint burst cannot be constrained within the field of view, if it originated from SAX J1747.02853 the corrected peak flux would be a factor of two larger than that of bursts observed previously from the source (Table Thermonuclear (type-I) X-ray bursts observed by the Rossi X-ray Timing Explorer). Thus, we attribute all these bursts to SAX J1750.82900 (see also Kaaret et al., 2002).
B.3. Aql X-1 and 1A 1905+00 ()
Bursts from 1A 1905+00 were discovered by SAS-3 Lewin et al. (1976e), and were attributed to a previously known persistent source Seward et al. (1976). The apparent burst recurrence time was 8.9 hr; one long radius-expansion burst was observed in a 17 hr observation by EXOSAT Chevalier & Ilovaisky (1990), with a peak flux of . We found three bursts from observations towards 1A 1905+00 (on 1996 July 24 08:56:40, July 24 09:07:18 and 2002 February 15 22:56:28 UT), with peak fluxes 0.8–. All three bursts were observed during periods of transient activity by Aql X-1. The corrected peak fluxes for these three bursts (assuming they originated from Aql X-1) were consistent with those of other bursts from that source. Furthermore, the most probable origin for two of the three bursts (given the variations in count rate between the PCUs) were within of Aql X-1, although we can formally exclude an origin at 1A 1905+00 at only the 2.5–3.1 confidence level. For the third burst, the most probable origin is within of Aql X-1, and we can exclude 1A 1905+00 at only the level. Given the lack of evidence of bursting behaviour from the latter source during the RXTE observations, we attribute all three to Aql X-1.
B.4. IGR J174732721 and IGR J174642811 ()
Following the discovery by INTEGRAL of the transient IGR J174732721 (also known as XTE J1747274; Grebenev et al., 2005; Markwardt & Swank, 2005b), pointed RXTE observations were made throughout 2005 May–June. The RXTE field of view also covers XMMU J174716.1281048 (also known as IGR J174642811; Sidoli et al., 2004), which was also active during 2005 and exhibited a burst on May 22 with an estimated peak flux of Del Santo et al. (2007). Two bursts were detected shortly after in RXTE observations, on 2005 May 24 and 31. The burst on May 24 was detected in an observation offset by just from IGR J174732721; the rescaled peak flux assuming instead an origin at IGR J174642811 would be around , similar to that measured by INTEGRAL. However, the burst on May 31 was detected in an observation pointed inbetween the two sources, so that the rescaled peak flux for either origin was only around . Furthermore, the variation in observed count rates between different PCUs during both bursts indicates a more likely origin with IGR J174732721. Thus, we attributed the two bursts to that source.
B.5. Galactic center fields
Observations towards the Galactic center were categorized based on the pointing direction into 10 (generally overlapping) fields, with pointing directions separated by . Below we describe the fields for which bursts were observed, and which sources we attribute them to.
B.5.1 Galactic center field 1
This field, centered on , (J2000.0), includes the known burst sources KS 1741293 ( from the center of the field), 2E 1742.92929 (), 1A 1742289 (), SLX 1744299/300 (), and GRS 1741.92853 (), as well as the Bursting Pulsar GRO J174428 at the edge of the field (). We observed 13 bursts with most of the peak fluxes below . Six of the faint bursts observed in 1997, on Feb 26 01:12:24, Feb 27 01:21:04 and 21:25:59, Mar 21 20:13:01, Mar 23 12:15:07 and Mar 25 17:32:13, had roughly symmetric profiles and no evidence of a temperature decrease in the burst tail (although the first three were affected by data gaps following the peak). The ratio of the integrated count rate in different PCUs indicates that the best candidate for the burst origin was GRO J174428; we note also that the bursts were coincident with the second outburst observed by RXTE from this source, beginning around December 1996. The burst profiles were similar to other type-II bursts observed previously from that source Giles et al. (1996). Thus, we attributed all six to GRO J174428. Of the two brighter bursts, one (on 1997 March 21 20:07:28 UT) exhibited two distinct peaks at , separated by s, while the other (on 1997 Mar 20 17:07:16 UT) featured strong PRE and peaked at . Both of these bursts were consistent with an origin at 2E 1742.92929 (), with the next best candidates inconsistent at the 2– level. Two more bursts (on 1997 Apr 19 23:52:43 and 1997 Apr 21 00:13:27 UT) were also consistent with an origin at this source, although we cannot rule out other sources (KS 1741293, 1A 1742289) at quite as high confidence due to the lower flux of these bursts.
The remaining three bursts were all consistent with an origin at SLX 1744299/300 (see §A.27), which was close to the edge of the field, and we can rule out the alternatives at between 2.5– confidence. SLX 1744299 has previously exhibited at least one very bright, long burst, with exponential decay time 43.3 s (Table Thermonuclear (type-I) X-ray bursts observed by the Rossi X-ray Timing Explorer), while the three bursts detected by RXTE were all much shorter, with decay times of 3–5 s. Thus, we attribute the bursts to SLX 1744300, although it is possible they actually originated from SLX 1744299.
B.5.2 Galactic center field 3
Centered approximately on the position of SAX J1747.02853 (), GC field 3 also includes the bursters 1A 1742289 (), GRS 1741.92853 (), 2E 1742.92929 (), KS 1741293 (), and SAX J1750.82900 (), the recently-discovered bursting transient XMMU J174716.1281048 (), as well as the Bursting Pulsar GRO J174428 (). We found four faint () bursts in observations of this field, on 2000 Mar 12 06:22:25 and 2001 Oct 8 13:06:03, 17:32:56 and 17:51:14 UT. While these bursts exhibited variations between the count rates for each PCU consistent with an origin in a number of sources, their low peak fluxes and long time scales suggest the most likely origin was 2E 1742.92929. Thus, we attribute them to that source.
B.5.3 Galactic center field 10
This field, centered on , (J2000.0), includes the burst sources GRS 1741.92853 (), 1A 1742289 (), SAX J1747.02853 (), KS 1741293 (), and 2E 1742.92929 (), as well as the Bursting Pulsar GRO J174428 (). This field was observed intensely for 355 ks between 2001 September 26 and 2001 October 6.
We found 80 bursts from these observations, with three-quarters of the bursts reaching apparent peak fluxes . For these faint bursts the mean s, and the median delay time was 2.6 hr. These properties, once the off-axis angle is taken into account, suggest that the bursts arose from 2E 1742.9294 (aka 1A 1742294; Lutovinov et al., 2001). While the ratio of count rates from different PCUs were not particularly constraining in determining the bursts location, due to their faintness, only 6 bursts were inconsistent with an origin in 2E 1742.9294, and then only at the 3– level.
Several of the brighter bursts exhibited PRE, often with a pronounced double-peaked structure in the bolometric flux. Variations in the count rates in different PCUs could not distinguish between a number of closely-spaced sources as origins for these bursts. However, all the bursts were observed over a short time interval, between 2001 September 26–29 and October 3–6. The only source in the field of view which was active around this time was SAX J1747.02853 Wijnands et al. (2002a), from which bursts were also observed during 2001 September by BeppoSAX Werner et al. (2004). Thus, we attribute the bright bursts from this field to that source.
B.6. GRO J174428
We found 19 type-I (thermonuclear) bursts in observations of the field of the “Bursting Pulsar”, GRO J174428, which also includes the sources KS 1741293 (), 1A 1742289 (), 2E 1742.92929 (), SAX J1747.02853 (), XTE J1739285 () and GRS 1741.92853 (). These bursts were comparatively easily distinguished from the much more frequent type-II bursts from GRO J174428 by the fast rise and exponential decay profile, as well as the detection of falling blackbody temperature in the burst tail. GRO J174428 is not known to exhibit thermonuclear bursts, and all the type-I bursts we observe from the field we attribute to nearby sources.
Eleven of the bursts had low measured peak fluxes of , and long time scales. Each of these bursts were consistent with an origin at 2E 1742.92929, although only for the brighter bursts could we exclude other sources in the field. We attributed all the faint bursts to that source.
Millisecond oscillations at 589 Hz were previously detected in three of the eight brighter bursts from the field, on 1996 May 15 19:32:23, Jun 4 14:41:12 and Jun 19 09:55:44 UT Strohmayer et al. (1997a). These bursts were attributed by the latter authors to MXB 174329, which is in turn thought to be identified with either KS 1741293 or 1A 1742289. Another candidate source which was not considered at the time is GRS 1741.92853 (see §A.23). We could only conclusively exclude KS 1741293 or 1A 1742289 as the origin for one of the 8 bursts, on 1996 Jul 8 01:57:47 UT. Since the BeppoSAX observations indicate bursting activity shortly after the bursts observed by RXTE, and the scaled peak fluxes for the bursts assuming an origin in GRS 1741.92853 are consistent with those observed by BeppoSAX Cocchi et al. (1999), we assume that source as the origin.
References
- Özel (2006) Özel, F. 2006, Nature, 441, 1115
- Agrawal et al. (2001) Agrawal, V. K., Sreekumar, P., Seetha, S., & Agrawal, P. C. 2001, Bulletin of the Astronomical Society of India, 29, 361
- Altamirano et al. (2008) Altamirano, D., Casella, P., Patruno, A., Wijnands, R., & van der Klis, M. 2008, ApJ, 674, L45
- Anders & Ebihara (1982) Anders, E. & Ebihara, M. 1982, Geochim. Cosmochim. Acta, 46, 2363
- Anderson et al. (1997) Anderson, S. F., Margon, B., Deutsch, E. W., Downes, R. A., & Allen, R. G. 1997, ApJ, 482, L69
- Aoki et al. (1992) Aoki, T., Dotani, T., Ebisawa, K., Itoh, M., Makino, F., Nagase, F., Takeshima, T., Mihara, T., & Kitamoto, S. 1992, PASJ, 44, 641
- Augusteijn et al. (1998) Augusteijn, T., van der Hooft, F., de Jong, J. A., van Kerkwijk, M. H., & van Paradijs, J. 1998, A&A, 332, 561
- Auriere et al. (1984) Auriere, M., Le Fevre, O., & Terzan, A. 1984, A&A, 138, 415
- Ayasli & Joss (1982) Ayasli, S. & Joss, P. C. 1982, ApJ, 256, 637
- Bałucińska-Church et al. (1999) Bałucińska-Church, M., Church, M. J., Oosterbroek, T., Segreto, A., Morley, R., & Parmar, A. N. 1999, A&A, 349, 495
- Bałucińska-Church et al. (2004) Bałucińska-Church, M., Church, M. J., & Smale, A. P. 2004, MNRAS, 347, 334
- Bandyopadhyay et al. (2002) Bandyopadhyay, R. M., Charles, P. A., Shahbaz, T., & Wagner, R. M. 2002, ApJ, 570, 793
- Barnard et al. (2001) Barnard, R., Balucińska-Church, M., Smale, A. P., & Church, M. J. 2001, A&A, 380, 494
- Barret et al. (1995) Barret, D., Motch, C., & Pietsch, W. 1995, A&A, 303, 526
- Basinska et al. (1984) Basinska, E. M., Lewin, W. H. G., Sztajno, M., Cominsky, L. R., & Marshall, F. J. 1984, ApJ, 281, 337
- Bazzano et al. (1997) Bazzano, A., Cocchi, M., Ubertini, P., Heise, J., in ’t Zand, J., & Muller, J. M. 1997, IAU Circ., 6668
- Becker et al. (1976) Becker, R. H., Pravdo, S. H., Serlemitsos, P. J., Swank, J. H., & Hoffman, J. 1976, IAU Circ., 2953
- Becker et al. (1977) Becker, R. H., W., S. B., H., S. J., Boldt, E. A., Holt, S. S., Pravdo, S. H., & Serlemitsos, P. J. 1977, ApJ, 216, L101
- Belian et al. (1972) Belian, R. D., Conner, J. P., & Evans, W. D. 1972, ApJ, 171, L87
- Belian et al. (1976) —. 1976, ApJ, 206, L135
- Belloni et al. (1993) Belloni, T., Hasinger, G., Pietsch, W., Mereghetti, S., Bignami, G. F., & Caraveo, P. 1993, A&A, 271, 487
- Bhattacharyya (2007) Bhattacharyya, S. 2007, MNRAS, 377, 198
- Bhattacharyya & Strohmayer (2006a) Bhattacharyya, S. & Strohmayer, T. E. 2006a, ApJ, 636, L121
- Bhattacharyya & Strohmayer (2006b) —. 2006b, ApJ, 641, L53
- Bhattacharyya & Strohmayer (2006c) —. 2006c, ApJ, 642, L161
- Bhattacharyya & Strohmayer (2007) —. 2007, ApJ, 656, 414
- Bhattacharyya et al. (2006a) Bhattacharyya, S., Strohmayer, T. E., Markwardt, C. B., & Swank, J. H. 2006a, ApJ, 639, L31
- Bhattacharyya et al. (2006b) Bhattacharyya, S., Strohmayer, T. E., Swank, J. H., & Markwardt, C. B. 2006b, ApJ, 652, 603
- Bildsten (1995) Bildsten, L. 1995, ApJ, 438, 852
- Bildsten (1998) Bildsten, L. 1998, in The Many Faces of Neutron Stars, ed. R. Buccheri, J. van Paradijs, & A. Alpar (Dordrecht: Kluwer), 419
- Bildsten (2000) Bildsten, L. 2000, in Cosmic Explosions, the 10th Annual October Astrophysics Conference, Maryland, October 11–13 1999, AIP Conf. 522, ed. S. Holt & W. Zhang (Woodbury NY: AIP), 359–369
- Bloser et al. (2000) Bloser, P. F., Grindlay, J. E., Kaaret, P., Zhang, W., Smale, A. P., & Barret, D. 2000, ApJ, 542, 1000
- Bodaghee et al. (2005) Bodaghee, A., Mowlavi, N., Kuulkers, E., Wijnands, R., Shaw, S. E., Courvoisier, T., Markwardt, C., Oosterbroek, T., Orr, A., Paizis, A., Ebisawa, K., & Kretschmar, P. 2005, The Astronomer’s Telegram, 592
- Boirin et al. (2007) Boirin, L., Keek, L., Méndez, M., Cumming, A., in’t Zand, J. J. M., Cottam, J., Paerels, F., & Lewin, W. H. G. 2007, A&A, 465, 559
- Bonnet-Bidaud et al. (2001) Bonnet-Bidaud, J. M., Haberl, F., Ferrando, P., Bennie, P. J., & Kendziorra, E. 2001, A&A, 365, L282
- Bowyer et al. (1965) Bowyer, S., Byram, E. T., Chubb, T. A., & Friedman, H. 1965, Science, 147, 394
- Bradt et al. (1968) Bradt, H., Naranan, S., Rappaport, S., & Spada, G. 1968, ApJ, 152, 1005
- Brandt et al. (1992) Brandt, S., Castro-Tirado, A. J., Lund, N., Dremin, V., Lapshov, I., & Syunyaev, R. 1992, A&A, 262, L15
- Brandt et al. (2005) Brandt, S., Kuulkers, E., Bazzano, A., Courvoisier, T. J.-L., Domingo, A., Ebisawa, K., Gehrels, N., Kretschmar, P., Krivonos, R., Lund, N., Markwardt, C., Mowlavi, N., Oosterbroek, T., Orr, A., Paizis, A., Roques, J.-P., Shaw, S. E., & Wijnands, R. 2005, The Astronomer’s Telegram, 622
- Callanan et al. (2002) Callanan, P. J., Curran, P., Filippenko, A. V., Garcia, M. R., Margon, B., Deutsch, E., Anderson, S., Homer, L., & Fender, R. P. 2002, ApJ, 574, L143
- Carpenter et al. (1977) Carpenter, G. F., Eyles, C. J., Skinner, G. K., Wilson, A. M., & Willmore, A. P. 1977, MNRAS, 179, 27P
- Casella et al. (2007) Casella, P., Altamirano, D., Wijnands, R., & van der Klis, M. 2007, ApJ, submitted
- Chakrabarty & Morgan (1998) Chakrabarty, D. & Morgan, E. H. 1998, Nature, 394, 346
- Chakrabarty et al. (2003) Chakrabarty, D., Morgan, E. H., Muno, M. P., Galloway, D. K., Wijnands, R., van der Klis, M., & Markwardt, C. B. 2003, Nature, 424, 42
- Charles et al. (2002) Charles, P. A., Clarkson, W. I., & van Zyl, L. 2002, New Astronomy, 7, 21
- Charles et al. (1986) Charles, P. A., Jones, D. C., & Naylor, T. 1986, Nature, 323, 417
- Chelovekov et al. (2006) Chelovekov, I. V., Grebenev, S. A., & Sunyaev, R. A. 2006, Astronomy Letters, 32, 456
- Chelovekov et al. (2005) Chelovekov, I. V., Lutovinov, A. A., Grebenev, S. A., & Sunyaev, R. A. 2005, Astronomy Letters, 31, 681
- Chenevez et al. (2006) Chenevez, J., Falanga, M., Brandt, S., Farinelli, R., Frontera, F., Goldwurm, A., in’t Zand, J. J. M., Kuulkers, E., & Lund, N. 2006, A&A, 449, L5
- Chevalier & Ilovaisky (1987) Chevalier, C. & Ilovaisky, S. A. 1987, A&A, 172, 167
- Chevalier & Ilovaisky (1990) —. 1990, A&A, 228, 115
- Chevalier & Ilovaisky (1991) —. 1991, A&A, 251, L11
- Chou & Grindlay (2001) Chou, Y. & Grindlay, J. E. 2001, ApJ, 563, 934
- Christian & Swank (1997) Christian, D. J. & Swank, J. H. 1997, ApJS, 109, 177
- Clark & Li (1977) Clark, G. & Li, F. 1977, IAU Circ., 3092
- Clark et al. (1976) Clark, G. W., Jernigan, J. G., Bradt, H., Canizares, C., Lewin, W. H. G., Li, F. K., Mayer, W., McClintock, J., & Schnopper, H. 1976, ApJ, 207, L105
- Clark et al. (1977) Clark, G. W., Li, F. K., Canizares, C., Hayakawa, S., Jernigan, G., & Lewin, W. H. G. 1977, MNRAS, 179, 651
- Clark et al. (1975) Clark, G. W., Markert, T. H., & Li, F. K. 1975, ApJ, 199, L93
- Cocchi et al. (2001a) Cocchi, M., Bazzano, A., Natalucci, L., Ubertini, P., Heise, J., & in ’t Zand, J. J. M. 2001a, Memorie della Societa Astronomica Italiana, 72, 757
- Cocchi et al. (2001b) Cocchi, M., Bazzano, A., Natalucci, L., Ubertini, P., Heise, J., Kuulkers, E., Cornelisse, R., & in ’t Zand, J. J. M. 2001b, A&A, 378, L37
- Cocchi et al. (1999) Cocchi, M., Bazzano, A., Natalucci, L., Ubertini, P., Heise, J., Muller, J. M., & in ’t Zand, J. J. M. 1999, A&A, 346, L45
- Cocchi et al. (1998) Cocchi, M., Bazzano, A., Natalucci, L., Ubertini, P., Heise, J., Muller, J. M., Smith, M. J. S., & in ’t Zand, J. J. M. 1998, ApJ, 508, L163
- Cominsky et al. (1978) Cominsky, L., Jones, C., Forman, W., & Tananbaum, H. 1978, ApJ, 224, 46
- Cominsky & Wood (1984) Cominsky, L. R. & Wood, K. S. 1984, ApJ, 283, 765
- Cooper & Narayan (2006) Cooper, R. L. & Narayan, R. 2006, ApJ, 648, L123
- Cooper & Narayan (2007a) —. 2007a, ApJ, 661, 468
- Cooper & Narayan (2007b) —. 2007b, ApJ, 657, L29
- Corbet et al. (1986) Corbet, R. H. D., Thorstensen, J. R., Charles, P. A., Menzies, J. W., Naylor, T., & Smale, A. P. 1986, MNRAS, 222, 15
- Cornelisse et al. (2000) Cornelisse, R., Heise, J., Kuulkers, E., Verbunt, F., & in ’t Zand, J. J. M. 2000, A&A, 357, L21
- Cornelisse et al. (2003) Cornelisse, R., in ’t Zand, J. J. M., Verbunt, F., Kuulkers, E., Heise, J., den Hartog, P. R., Cocchi, M., Natalucci, L., Bazzano, A., & Ubertini, P. 2003, A&A, 405, 1033
- Cornelisse et al. (2004) Cornelisse, R., in’t Zand, J. J. M., Kuulkers, E., Heise, J., Verbunt, F., Cocchi, M., Bazzano, A., Natalucci, L., & Ubertini, P. 2004, Nuclear Physics B Proceedings Supplements, 132, 518
- Cornelisse et al. (2002a) Cornelisse, R., Kuulkers, E., in ’t Zand, J. J. M., Verbunt, F., & Heise, J. 2002a, A&A, 382, 174
- Cornelisse et al. (2002b) Cornelisse, R., Verbunt, F., in ’t Zand, J. J. M., Kuulkers, E., Heise, J., Remillard, R. A., Cocchi, M., Natalucci, L., Bazzano, A., & Ubertini, P. 2002b, A&A, 392, 885
- Cottam et al. (2001) Cottam, J., Kahn, S. M., Brinkman, A. C., den Herder, J. W., & Erd, C. 2001, A&A, 365, L277
- Cottam et al. (2002) Cottam, J., Paerels, F., & Mendez, M. 2002, Nature, 420, 51
- Cottam et al. (2007) Cottam, J., Paerels, F., Méndez, M., Boirin, L., Lewin, W. H. G., Kuulkers, E., & Miller, J. M. 2007, ApJ, accepted (arXiv:0709.4062), 709
- Courvoisier et al. (1986) Courvoisier, T. J. ., Parmar, A. N., Peacock, A., & Pakull, M. 1986, ApJ, 309, 265
- Cowley et al. (1979) Cowley, A. P., Crampton, D., & Hutchings, J. B. 1979, ApJ, 231, 539
- Crampton et al. (1986) Crampton, D., Stauffer, J., Hutchings, J. B., Cowley, A. P., & Ianna, P. 1986, ApJ, 306, 599
- Cumming (2003) Cumming, A. 2003, ApJ, 595, 1077
- Cumming (2004) Cumming, A. 2004, in Proceedings of the 2nd BeppoSAX Conference: ”The Restless High-Energy Universe”, Amsterdam, 5–9 May 2003, ed. E. P. J. van den Heuvel, R. A. M. J. Wijers, & J. J. M. in ’t Zand, Vol. 132, 435–445
- Cumming & Bildsten (2000) Cumming, A. & Bildsten, L. 2000, ApJ, 544, 453
- Cumming et al. (2006) Cumming, A., Macbeth, J., Zand, J. J. M. i., & Page, D. 2006, ApJ, 646, 429
- Cumming et al. (2002) Cumming, A., Morsink, S. M., Bildsten, L., Friedman, J. L., & Holz, D. E. 2002, ApJ, 564, 343
- Damen et al. (1990) Damen, E., Magnier, E., Lewin, W. H. G., Tan, J., Penninx, W., & van Paradijs, J. 1990, A&A, 237, 103
- Davidsen (1975) Davidsen, A. 1975, IAU Circ., 2824
- Del Santo et al. (2007) Del Santo, M., Sidoli, L., Mereghetti, S., Bazzano, A., Tarana, A., & Ubertini, P. 2007, A&A, accepted (astro-ph/0704.2134), 704
- den Hartog et al. (2003) den Hartog, P. R., in ’t Zand, J. J. M., Kuulkers, E., Cornelisse, R., Heise, J., Bazzano, A., Cocchi, M., Natalucci, L., & Ubertini, P. 2003, A&A, 400, 633
- Deutsch et al. (2000) Deutsch, E. W., Margon, B., & Anderson, S. F. 2000, ApJ, 530, L21
- Deutsch et al. (1999) Deutsch, E. W., Margon, B., Anderson, S. F., Wachter, S., & Goss, W. M. 1999, ApJ, 524, 406
- Dieters & van der Klis (2000) Dieters, S. W. & van der Klis, M. 2000, MNRAS, 311, 201
- Dotani et al. (1990) Dotani, T., Inoue, H., Murakami, T., Nagase, F., & Tanaka, Y. 1990, Nature, 347, 534
- Doxsey (1975) Doxsey, R. 1975, IAU Circ., 2820
- Doxsey et al. (1979) Doxsey, R., Bradt, H., Johnston, M., Griffiths, R., Leach, R., Schwartz, D., Schwarz, J., & Grindlay, J. 1979, ApJ, 228, L67
- Ebisuzaki (1987) Ebisuzaki, T. 1987, PASJ, 39, 287
- Emelyanov et al. (2001) Emelyanov, A. N., Aref’ev, V. A., Churazov, E. M., Gilfanov, M. R., & Sunyaev, R. A. 2001, Astronomy Letters, 27, 781
- Fabbiano et al. (1978) Fabbiano, G., Gursky, H., Schwartz, D. A., Schwarz, J., Bradt, H. V., & Doxsey, R. E. 1978, ApJ, 221, L49
- Fisker et al. (2006) Fisker, J. L., Görres, J., Wiescher, M., & Davids, B. 2006, ApJ, 650, 332
- Fisker et al. (2008) Fisker, J. L., Schatz, H., & Thielemann, F.-K. 2008, ApJS, 174, 261
- Fisker et al. (2007) Fisker, J. L., Tan, W., Görres, J., Wiescher, M., & Cooper, R. L. 2007, ApJ, 665, 637
- Ford et al. (1998) Ford, E. C., van der Klis, M., & Kaaret, P. 1998, ApJ, 498, L41
- Forman & Jones (1976) Forman, W. & Jones, C. 1976, ApJ, 207, L177
- Forman et al. (1978) Forman, W., Jones, C., Cominsky, L., Julien, P., Murray, S., Peters, G., Tananbaum, H., & Giacconi, R. 1978, ApJS, 38, 357
- Forman et al. (1976a) Forman, W., Jones, C., & Tananbaum, H. 1976a, ApJ, 207, L25
- Forman et al. (1976b) Forman, W., Tananbaum, H., & Jones, C. 1976b, ApJ, 206, L29
- Fox (2005) Fox, D. B. 2005, The Astronomer’s Telegram, 526
- Fox et al. (2001) Fox, D. W., Lewin, W. H. G., Rutledge, R. E., Morgan, E. H., Guerriero, R., Bildsten, L., van der Klis, M., van Paradijs, J., Moore, C. B., Dotani, T., & Asai, K. 2001, MNRAS, 321, 776
- Franco (2001) Franco, L. M. 2001, ApJ, 554, 340
- Friedman et al. (1967) Friedman, H., Byram, E. T., & Chubb, T. A. 1967, Science, 156, 374
- Fujimoto & Gottwald (1989) Fujimoto, M. Y. & Gottwald, M. 1989, MNRAS, 236, 545
- Fujimoto et al. (1981) Fujimoto, M. Y., Hanawa, T., & Miyaji, S. 1981, ApJ, 247, 267
- Fujimoto et al. (1987) Fujimoto, M. Y., Sztajno, M., Lewin, W. H. G., & van Paradijs, J. 1987, ApJ, 319, 902
- Fushiki & Lamb (1987) Fushiki, I. & Lamb, D. Q. 1987, ApJ, 323, L55
- Galloway (2008) Galloway, D. K. 2008, in 40 Years of Pulsars: Millisecond Pulsars, Magnetars and More (Melville, NY: AIP; arXiv:0711.4420)
- Galloway et al. (2004a) Galloway, D. K., Chakrabarty, D., Cumming, A., Kuulkers, E., Bildsten, L., & Rothschild, R. 2004a, in X-ray Timing 2003: Rossi and Beyond, ed. P. Kaaret, F. K. Lamb, & J. H. Swank (Melville, NY: AIP)
- Galloway et al. (2001) Galloway, D. K., Chakrabarty, D., Muno, M. P., & Savov, P. 2001, ApJ, 549, L85
- Galloway & Cumming (2006) Galloway, D. K. & Cumming, A. 2006, ApJ, 652, 559
- Galloway et al. (2004b) Galloway, D. K., Cumming, A., Kuulkers, E., Bildsten, L., Chakrabarty, D., & Rothschild, R. E. 2004b, ApJ, 601, 466
- Galloway et al. (2005) Galloway, D. K., Morgan, E. H., Kaaret, P., Chakrabarty, D., & Suzuki, M. 2005, The Astronomer’s Telegram, 657
- Galloway et al. (2007) Galloway, D. K., Morgan, E. H., Krauss, M. I., Kaaret, P., & Chakrabarty, D. 2007, ApJ, 654, L73
- Galloway et al. (2008) Galloway, D. K., Özel, F., & Psaltis, D. 2008, MNRAS, accepted (arXiv:0712.0412)
- Galloway et al. (2003) Galloway, D. K., Psaltis, D., Chakrabarty, D., & Muno, M. P. 2003, ApJ, 590, 999
- Galloway et al. (2006) Galloway, D. K., Psaltis, D., Muno, M. P., & Chakrabarty, D. 2006, ApJ, 639, 1033
- Gavriil et al. (2007) Gavriil, F. P., Strohmayer, T. E., Swank, J. H., & Markwardt, C. B. 2007, ApJ, 669, L29
- Giacconi et al. (1967) Giacconi, R., Gorenstein, P., Gursky, H., Usher, P. D., Waters, J. R., Sandage, A., Osmer, P., & Peach, J. V. 1967, ApJ, 148, L129
- Giacconi et al. (1962) Giacconi, R., Gursky, H., Paolini, F., & Rossi, B. 1962, Phys. Rev. Lett., 9, 439
- Giacconi et al. (1974) Giacconi, R., Murray, S., Gursky, H., Kellogg, E., Schreier, E., Matilsky, T., Koch, D., & Tananbaum, H. 1974, ApJS, 27, 37
- Giacconi et al. (1972) Giacconi, R., Murray, S., Gursky, H., Kellogg, E., Schreier, E., & Tananbaum, H. 1972, ApJ, 178, 281
- Gierliński & Done (2002) Gierliński, M. & Done, C. 2002, MNRAS, 331, L47
- Giles et al. (1999) Giles, A. B., Hill, K. M., & Greenhill, J. G. 1999, MNRAS, 304, 47
- Giles et al. (2002) Giles, A. B., Hill, K. M., Strohmayer, T. E., & Cummings, N. 2002, ApJ, 568, 279
- Giles et al. (1996) Giles, A. B., Swank, J. H., Jahoda, K., Zhang, W., Strohmayer, T., Stark, M. J., & Morgan, E. H. 1996, ApJ, 469, L25+
- Gotthelf & Kulkarni (1997) Gotthelf, E. V. & Kulkarni, S. R. 1997, ApJ, 490, L161
- Gottwald et al. (1989) Gottwald, M., Haberl, F., Langmeier, A., Hasinger, G., Lewin, W. H. G., & van Paradijs, J. 1989, ApJ, 339, 1044
- Gottwald et al. (1986) Gottwald, M., Haberl, F., Parmar, A. N., & White, N. E. 1986, ApJ, 308, 213
- Gottwald et al. (1987) —. 1987, ApJ, 323, 575
- Grebenev et al. (2005) Grebenev, S. A., Molkov, S. V., & Sunyaev, R. A. 2005, The Astronomer’s Telegram, 467
- Grimm et al. (2002) Grimm, H.-J., Gilfanov, M., & Sunyaev, R. 2002, A&A, 391, 923
- Grindlay et al. (1976) Grindlay, J., Gursky, H., Schnopper, H., Parsignault, D. R., Heise, J., Brinkman, A. C., & Schrijver, J. 1976, ApJ, 205, L127
- Grindlay (1978) Grindlay, J. E. 1978, ApJ, 224, L107
- Grindlay et al. (1988) Grindlay, J. E., Bailyn, C. D., Cohn, H., Lugger, P. M., Thorstensen, J. R., & Wegner, G. 1988, ApJ, 334, L25
- Grindlay & Liller (1978) Grindlay, J. E. & Liller, W. 1978, ApJ, 220, L127
- Grindlay et al. (1980) Grindlay, J. E., Marshall, H. L., Hertz, P., Weisskopf, M. C., Elsner, R. F., Ghosh, P., Darbro, W., Sutherland, P. G., & Soltan, A. 1980, ApJ, 240, L121
- Grindlay et al. (1978) Grindlay, J. E., McClintock, J. E., Canizares, C. R., Cominsky, L., Li, F. K., Lewin, W. H. G., & van Paradijs, J. 1978, Nature, 274, 567
- Gruber et al. (1996) Gruber, D. E., Blanco, P. R., Heindl, W. A., Pelling, M. R., Rothschild, R. E., & Hink, P. L. 1996, A&AS, 120, C641
- Guerriero et al. (1999) Guerriero, R., Fox, D. W., Kommers, J., Lewin, W. H. G., Rutledge, R., Moore, C. B., Morgan, E., van Paradijs, J., van der Klis, M., Bildsten, L., & Dotani, T. 1999, MNRAS, 307, 179
- Haberl et al. (1987) Haberl, F., Stella, L., White, N. E., Gottwald, M., & Priedhorsky, W. C. 1987, ApJ, 314, 266
- Haberl & Titarchuk (1995) Haberl, F. & Titarchuk, L. 1995, A&A, 299, 414
- Hakala et al. (2005) Hakala, P., Ramsay, G., Muhli, P., Charles, P., Hannikainen, D., Mukai, K., & Vilhu, O. 2005, MNRAS, 356, 1133
- Hasinger & van der Klis (1989) Hasinger, G. & van der Klis, M. 1989, A&A, 225, 79
- Heger et al. (2007a) Heger, A., Cumming, A., Galloway, D. K., & Woosley, S. E. 2007a, ApJ, 671, L141
- Heger et al. (2007b) Heger, A., Cumming, A., & Woosley, S. E. 2007b, ApJ, 665, 1311
- Heinke et al. (2001) Heinke, C. O., Edmonds, P. D., & Grindlay, J. E. 2001, ApJ, 562, 363
- Heinke et al. (2003) Heinke, C. O., Grindlay, J. E., Lugger, P. M., Cohn, H. N., Edmonds, P. D., Lloyd, D. A., & Cool, A. M. 2003, ApJ, 598, 501
- Heyl (2004) Heyl, J. S. 2004, ApJ, 600, 939
- Hjellming (1978) Hjellming, R. M. 1978, ApJ, 221, 225
- Hoffman et al. (1980) Hoffman, J. A., Cominsky, L., & Lewin, W. H. G. 1980, ApJ, 240, L27
- Hoffman et al. (1976) Hoffman, J. A., Lewin, W. H. G., Doty, J., Hearn, D. R., Clark, G. W., Jernigan, G., & Li, F. K. 1976, ApJ, 210, L13
- Hoffman et al. (1978) Hoffman, J. A., Wheaton, W. A., Primini, F. A., Campbell, P., Matteson, J. L., Gruber, D. E., Peterson, L. E., Swank, J. H., Boldt, E. A., & Holt, S. S. 1978, Nature, 276, 587
- Homan et al. (1999) Homan, J., Méndez, M., Wijnands, R., van der Klis, M., & van Paradijs, J. 1999, ApJ, 513, L119
- Homer et al. (2001a) Homer, L., Anderson, S. F., Margon, B., Deutsch, E. W., & Downes, R. A. 2001a, ApJ, 550, L155
- Homer et al. (2002) Homer, L., Anderson, S. F., Margon, B., Downes, R. A., & Deutsch, E. W. 2002, AJ, 123, 3255
- Homer et al. (1998) Homer, L., Charles, P. A., & O’Donoghue, D. 1998, MNRAS, 298, 497
- Homer et al. (2001b) Homer, L., Deutsch, E. W., Anderson, S. F., & Margon, B. 2001b, AJ, 122, 2627
- Hunt & Battrick (1989) Hunt, J. & Battrick, B., eds. 1989, Proc. 23rd ESLAB Symposium on Two Topics in X-ray Astronomy, Bologna, Italy, 13-20 September No. SP-296 (ESTEC, Noordwijk, The Netherlands: ESA)
- Ilovaisky et al. (1993) Ilovaisky, S. A., Auriere, M., Koch-Miramond, L., Chevalier, C., Cordoni, J.-P., & Crowe, R. A. 1993, A&A, 270, 139
- in ’t Zand et al. (1998a) in ’t Zand, J., Bazzano, A., Cocchi, M., Ubertini, P., Muller, J. M., & Torroni, V. 1998a, IAU Circ., 6846
- in ’t Zand et al. (2004a) in ’t Zand, J., Cornelisse, R., Kuulkers, E., Verbunt, F., & Heise, J. 2004a, in X-ray Timing 2003: Rossi and Beyond, ed. P. Kaaret, F. K. Lamb, & J. H. Swank, Vol. 714 (Melville, NY: AIP), 253–256
- in ’t Zand et al. (2004b) in ’t Zand, J. J. M., Cornelisse, R., & Cumming, A. 2004b, A&A, 426, 257
- in ’t Zand et al. (2001a) in ’t Zand, J. J. M., Cornelisse, R., Kuulkers, E., Heise, J., Kuiper, L., Bazzano, A., Cocchi, M., Muller, J. M., Natalucci, L., Smith, M. J. S., & Ubertini, P. 2001a, A&A, 372, 916
- in ’t Zand et al. (2005) in ’t Zand, J. J. M., Cumming, A., van der Sluys, M. V., Verbunt, F., & Pols, O. R. 2005, A&A, 441, 675
- in ’t Zand et al. (1991) in ’t Zand, J. J. M., Heise, J., Brinkman, A. C., Jager, R., Skinner, G. K., Patterson, T. G., Pan, H.-C., Nottingham, M. R., Willmore, A. P., & Al-Emam, O. 1991, Advances in Space Research, 11, 187
- in ’t Zand et al. (1999a) in ’t Zand, J. J. M., Heise, J., Kuulkers, E., Bazzano, A., Cocchi, M., & Ubertini, P. 1999a, A&A, 347, 891
- in ’t Zand et al. (1998b) in ’t Zand, J. J. M., Heise, J., Muller, J. M., Bazzano, A., Cocchi, M., Natalucci, L., & Ubertini, P. 1998b, A&A, 331, L25
- in ’t Zand et al. (2003a) in ’t Zand, J. J. M., Hulleman, F., Markwardt, C. B., Méndez, M., Kuulkers, E., Cornelisse, R., Heise, J., Strohmayer, T. E., & Verbunt, F. 2003a, A&A, 406, 233
- in ’t Zand et al. (2003b) in ’t Zand, J. J. M., Kuulkers, E., Verbunt, F., Heise, J., & Cornelisse, R. 2003b, A&A, 411, L487
- in ’t Zand et al. (2003c) in ’t Zand, J. J. M., Strohmayer, T. E., Markwardt, C. B., & Swank, J. 2003c, A&A, 409, 659
- in ’t Zand et al. (2001b) in ’t Zand, J. J. M., van Kerkwijk, M. H., Pooley, D., Verbunt, F., Wijnands, R., & Lewin, W. H. G. 2001b, ApJ, 563, L41
- in ’t Zand et al. (2004c) in ’t Zand, J. J. M., Verbunt, F., Heise, J., Bazzano, A., Cocchi, M., Cornelisse, R., Kuulkers, E., Natalucci, L., & Ubertini, P. 2004c, in Proceedings of the 2nd BeppoSAX Conference: ”The Restless High-Energy Universe”, Amsterdam, 5–9 May 2003, ed. E. P. J. van den Heuvel, R. A. M. J. Wijers, & J. J. M. in ’t Zand, Vol. 132, 486–495
- in ’t Zand et al. (1998c) in ’t Zand, J. J. M., Verbunt, F., Heise, J., Muller, J. M., Bazzano, A., Cocchi, M., Natalucci, L., & Ubertini, P. 1998c, A&A, 329, L37
- in ’t Zand et al. (1999b) in ’t Zand, J. J. M., Verbunt, F., Strohmayer, T. E., Bazzano, A., Cocchi, M., Heise, J., van Kerkwijk, M. H., Muller, J. M., Natalucci, L., Smith, M. J. S., & Ubertini, P. 1999b, A&A, 345, 100
- Inogamov & Sunyaev (1999) Inogamov, N. A. & Sunyaev, R. A. 1999, Astronomy Letters, 25, 269
- Inoue et al. (1984) Inoue, H., Koyama, K., Makino, F., Makishima, K., Matsuoka, M., Murakami, T., Oda, M., Ogawara, Y., Ohashi, T., Shibazaki, N., Tanaka, Y., Hayakawa, S., Kunieda, H., Masai, K., Nagase, F., Tawara, Y., Miyamoto, S., Tsunemi, H., Yamashita, K., & Kondo, I. 1984, PASJ, 36, 855
- in’t Zand et al. (2002) in’t Zand, J. J. M., Verbunt, F., Kuulkers, E., Markwardt, C. B., Bazzano, A., Cocchi, M., Cornelisse, R., Heise, J., Natalucci, L., & Ubertini, P. 2002, A&A, 389, L43
- Jahoda et al. (2006) Jahoda, K., Markwardt, C. B., Radeva, Y., Rots, A. H., Stark, M. J., Swank, J. H., Strohmayer, T. E., & Zhang, W. 2006, ApJS, 163, 401
- Jahoda et al. (1996) Jahoda, K., Swank, J. H., Giles, A. B., Stark, M. J., Strohmayer, T., Zhang, W., & Morgan, E. H. 1996, Proc. SPIE, 2808, 59
- Jernigan et al. (1977) Jernigan, J. G., Bradt, H. V., Doxsey, R. E., McClintock, J. E., & Apparao, K. M. V. 1977, Nature, 270, 321
- Jonker et al. (2004) Jonker, P. G., Galloway, D. K., McClintock, J. E., Buxton, M., Garcia, M., & Murray, S. 2004, MNRAS, 354, 666
- Jonker et al. (2001) Jonker, P. G., van der Klis, M., Homan, J., Méndez, M., van Paradijs, J., Belloni, T., Kouveliotou, C., Lewin, W., & Ford, E. C. 2001, ApJ, 553, 335
- Jonker et al. (2000) Jonker, P. G., van der Klis, M., Homan, J., Wijnands, R., van Paradijs, J., Méndez, M., Kuulkers, E., & Ford, E. C. 2000, ApJ, 531, 453
- Juett & Chakrabarty (2003) Juett, A. M. & Chakrabarty, D. 2003, ApJ, 599, 498
- Juett et al. (2005) Juett, A. M., Kaplan, D. L., Chakrabarty, D., Markwardt, C. B., & Jonker, P. G. 2005, The Astronomer’s Telegram, 521
- Juett et al. (2001) Juett, A. M., Psaltis, D., & Chakrabarty, D. 2001, ApJ, 560, L59
- Kaaret et al. (2002) Kaaret, P., in ’t Zand, J. J. M., Heise, J., & Tomsick, J. A. 2002, ApJ, 575, 1018
- Kaaret et al. (2004) Kaaret, P., Lamb, F. K., & Swank, J. H., eds. 2004, X-ray Timing 2003: Rossi and Beyond, Vol. 714 (Melville, NY: AIP)
- Kaaret et al. (2005) Kaaret, P., Morgan, E., & Vanderspek, R. 2005, The Astronomer’s Telegram, 538
- Kaaret et al. (2007) Kaaret, P., Prieskorn, Z., Zand, J. J. M. i., Brandt, S., Lund, N., Mereghetti, S., Götz, D., Kuulkers, E., & Tomsick, J. A. 2007, ApJ, 657, L97
- Kaaret et al. (2003) Kaaret, P., Zand, J. J. M. i., Heise, J., & Tomsick, J. A. 2003, ApJ, 598, 481
- Kahn & Grindlay (1984) Kahn, S. M. & Grindlay, J. E. 1984, ApJ, 281, 826
- Kaluzienski et al. (1977) Kaluzienski, L. J., Holt, S. S., Boldt, E. A., & Serlemitsos, P. J. 1977, Nature, 265, 606
- Kaminker et al. (1989) Kaminker, A. D., Pavlov, G. G., Shibanov, Y. A., Kurt, V. G., Smirnov, A. S., Shamolin, V. M., Kopaeva, I. F., & Sheffer, E. K. 1989, A&A, 220, 117
- Kawai et al. (2005) Kawai, N., Suzuki, M., & for the HETE Team. 2005, The Astronomer’s Telegram, 534
- Keek et al. (2007) Keek, L., in ’t Zand, J. J. M., Kuulkers, E., Cumming, A., Brown, E. F., & Suzuki, M. 2007, ArXiv e-prints, 711
- Kennea et al. (2005) Kennea, J. A., Burrows, D. N., Markwardt, C., & Gehrels, N. 2005, The Astronomer’s Telegram, 500
- King & Watson (1986) King, A. R. & Watson, M. G. 1986, Nature, 323, 105
- King et al. (1993) King, I. R., Stanford, S. A., Albrecht, R., Barbieri, C., Blades, J. C., Boksenberg, A., Crane, P., Disney, M. J., Deharveng, J. M., Jakobsen, P., Kamperman, T. M., Macchetto, F., Mackay, C. D., Paresce, F., Weigelt, G., Baxter, D., Greenfield, P., Jedrzejewski, R., Nota, A., Sparks, W. B., & Sosin, C. 1993, ApJ, 413, L117
- Kitamoto et al. (1993) Kitamoto, S., Tsunemi, H., Miyamoto, S., & Roussel-Dupre, D. 1993, ApJ, 403, 315
- Klein-Wolt et al. (2007) Klein-Wolt, M., Wijnands, R., Swank, J. H., & Markwardt, C. B. 2007, The Astronomer’s Telegram, 1065
- Kong et al. (2000) Kong, A. K. H., Homer, L., Kuulkers, E., Charles, P. A., & Smale, A. P. 2000, MNRAS, 311, 405
- Koyama et al. (1981) Koyama, K., Inoue, H., Makishima, K., Matsuoka, M., Murakami, T., Oda, M., Osgawara, Y., Ohashi, T., Shibazaki, N., Tanaka, Y., Marshall, F. J., Kondo, I. S., Hayakawa, S., Kunieda, H., Makino, F., Masai, K., Nagase, F., Tawara, Y., Miyamoto, S., Tsunemi, H., & Yamashita, K. 1981, ApJ, 247, L27
- Kuulkers (2002) Kuulkers, E. 2002, A&A, 383, L5
- Kuulkers et al. (2003) Kuulkers, E., den Hartog, P. R., in ’t Zand, J. J. M., Verbunt, F. W. M., Harris, W. E., & Cocchi, M. 2003, A&A, 399, 663
- Kuulkers et al. (2002) Kuulkers, E., Homan, J., van der Klis, M., Lewin, W. H. G., & Méndez, M. 2002, A&A, 382, 947
- Kuulkers et al. (2004) Kuulkers, E., in ’t Zand, J., Homan, J., van Straaten, S., Altamirano, D., & van der Klis, M. 2004, in X-ray Timing 2003: Rossi and Beyond, ed. P. Kaaret, F. K. Lamb, & J. H. Swank, Vol. 714 (Melville, NY: AIP), 257–260
- Kuulkers & van der Klis (2000) Kuulkers, E. & van der Klis, M. 2000, A&A, 356, L45
- Langmeier et al. (1987) Langmeier, A., Sztajno, M., Hasinger, G., Truemper, J., & Gottwald, M. 1987, ApJ, 323, 288
- Lattimer & Prakash (2001) Lattimer, J. M. & Prakash, M. 2001, ApJ, 550, 426
- Levine et al. (1998) Levine, A., Swank, J., & Smith, E. 1998, IAU Circ., 6955
- Levine et al. (1996) Levine, A. M., Bradt, H., Cui, W., Jernigan, J. G., Morgan, E. H., Remillard, R., Shirey, R. E., & Smith, D. A. 1996, ApJ, 469, L33
- Lewin et al. (1978) Lewin, W., Marshall, H., Primini, F., Wheaton, W., Cominsky, L., Jernigan, G., & Ossman, W. 1978, IAU Circ., 3190
- Lewin et al. (1976a) Lewin, W. H. G., Clark, G., & Doty, J. 1976a, IAU Circ., 2922
- Lewin et al. (1976b) Lewin, W. H. G., Doty, J., Clark, G. W., Rappaport, S. A., Bradt, H. V. D., Doxsey, R., Hearn, D. R., Hoffman, J. A., Jernigan, J. G., Li, F. K., Mayer, W., McClintock, J., Primini, F., & Richardson, J. 1976b, ApJ, 207, L95
- Lewin et al. (1976c) Lewin, W. H. G., Hoffman, J. A., & Doty, J. 1976c, IAU Circ., 2994
- Lewin et al. (1976d) Lewin, W. H. G., Hoffman, J. A., Doty, J., Hearn, D. R., Clark, G. W., Jernigan, J. G., Li, F. K., McClintock, J. E., & Richardson, J. 1976d, MNRAS, 177, 83P
- Lewin et al. (1977) Lewin, W. H. G., Hoffman, J. A., Doty, J., Li, F. K., & McClintock, J. E. 1977, IAU Circ., 3075
- Lewin et al. (1976e) Lewin, W. H. G., Li, F. K., Hoffman, J. A., Doty, J., Buff, J., Clark, G. W., & Rappaport, S. 1976e, MNRAS, 177, 93P
- Lewin et al. (1987) Lewin, W. H. G., Penninx, W., van Paradijs, J., Damen, E., Sztajno, M., Truemper, J., & van der Klis, M. 1987, ApJ, 319, 893
- Lewin et al. (1980) Lewin, W. H. G., van Paradijs, J., Cominsky, L., & Holzner, S. 1980, MNRAS, 193, 15
- Lewin et al. (1993) Lewin, W. H. G., van Paradijs, J., & Taam, R. E. 1993, Space Sci. Rev., 62, 223
- Li & Clark (1977) Li, F. & Clark, G. 1977, IAU Circ., 3095
- Li et al. (1977) Li, F. K., Lewin, W. H. G., Clark, G. W., Doty, J., Hoffman, J. A., & Rappaport, S. A. 1977, MNRAS, 179, 21
- Liller (1977) Liller, W. 1977, ApJ, 213, L21
- Liu et al. (2001) Liu, Q. Z., van Paradijs, J., & van den Heuvel, E. P. J. 2001, A&A, 368, 1021
- Lochner & Roussel-Dupre (1994) Lochner, J. C. & Roussel-Dupre, D. 1994, ApJ, 435, 840
- London et al. (1986) London, R. A., Taam, R. E., & Howard, W. M. 1986, ApJ, 306, 170
- Lutovinov et al. (2005) Lutovinov, A., Revnivtsev, M., Molkov, S., & Sunyaev, R. 2005, A&A, 430, 997
- Lutovinov et al. (2003) Lutovinov, A., Walter, R., Belanger, G., Lund, N., Grebenev, S., & Winkler, C. 2003, The Astronomer’s Telegram, 155
- Lutovinov et al. (2001) Lutovinov, A. A., Grebenev, S. A., Pavlinsky, M. N., & Sunyaev, R. A. 2001, Astronomy Letters, 27, 501
- Méndez et al. (2001) Méndez, M., van der Klis, M., & Ford, E. C. 2001, ApJ, 561, 1016
- Madej et al. (2004) Madej, J., Joss, P. C., & Różańska, A. 2004, ApJ, 602, 904
- Maeda et al. (1996) Maeda, Y., Koyama, K., Sakano, M., Takeshima, T., & Yamauchi, S. 1996, PASJ, 48, 417
- Makishima et al. (1982) Makishima, K., Inoue, H., Koyama, K., Matsuoka, M., Murakami, T., Oda, M., Ogawara, Y., Ohashi, T., Shibazaki, N., Tanaka, Y., Hayakawa, S., Kunieda, H., Makino, F., Masai, K., Nagase, F., Tawara, Y., Miyamoto, S., Tsunemi, H., Yamashita, K., & Kondo, I. 1982, ApJ, 255, L49
- Makishima et al. (1981a) —. 1981a, ApJ, 244, L79
- Makishima et al. (1983) Makishima, K., Mitsuda, K., Inoue, H., Koyama, K., Matsuoka, M., Murakami, T., Oda, M., Ogawara, Y., Ohashi, T., Shibazaki, N., Tanaka, Y., Marshall, F. J., Hayakawa, S., Kunieda, H., Makino, F., Nagase, F., Tawara, Y., Miyamoto, S., Tsunemi, H., Tsuno, K., Yamashita, K., & Kondo, I. 1983, ApJ, 267, 310
- Makishima et al. (1981b) Makishima, K., Ohashi, T., Inoue, H., Koyama, K., Matsuoka, M., Murakami, T., Oda, M., Ogawara, Y., Shibazaki, N., Tanaka, Y., Kondo, I., Hayakawa, S., Kunieda, H., Makino, F., Masai, K., Nagase, F., Tawara, Y., Miyamoto, S., Tsunemi, H., & da Yamashita, K. 1981b, ApJ, 247, L23
- Markert et al. (1975) Markert, T. H., Backman, D. E., Canizares, C. R., Clark, G. W., & Levine, A. M. 1975, Nature, 257, 32
- Markert et al. (1977) Markert, T. H., Canizares, C. R., Clark, G. W., Hearn, D. R., Li, F. K., Sprott, G. F., & Winkler, P. F. 1977, ApJ, 218, 801
- Markwardt et al. (2007) Markwardt, C. B., Klein-Wolt, M., Swank, J. H., & Wijnands, R. 2007, The Astronomer’s Telegram, 1068
- Markwardt et al. (1998) Markwardt, C. B., Marshall, F. E., Swank, J., & Takeshima, T. 1998, IAU Circ., 6998
- Markwardt et al. (1999a) Markwardt, C. B., Marshall, F. E., Swank, J. H., & Wei, C. 1999a, IAU Circ., 7300
- Markwardt et al. (1999b) Markwardt, C. B., Strohmayer, T. E., & Swank, J. H. 1999b, ApJ, 512, L125
- Markwardt et al. (2000) Markwardt, C. B., Strohmayer, T. E., Swank, J. H., & Zhang, W. 2000, IAU Circ., 7482
- Markwardt et al. (2005) Markwardt, C. B., Swank, J., Wijnands, R., & Zand, J. I. 2005, The Astronomer’s Telegram, 505
- Markwardt & Swank (2000) Markwardt, C. B. & Swank, J. H. 2000, IAU Circ., 7454
- Markwardt & Swank (2002) Markwardt, C. B. & Swank, J. H. 2002, in BAPS, Vol. 47 (2), Proceedings of the American Physical Society April Meeting, held jointly with the High Energy Astrophysics Division (HEAD) of the American Astronomical Society, 219
- Markwardt & Swank (2003a) —. 2003a, The Astronomer’s Telegram, 156
- Markwardt & Swank (2003b) —. 2003b, IAU Circ., 8144
- Markwardt & Swank (2005a) —. 2005a, The Astronomer’s Telegram, 495
- Markwardt & Swank (2005b) —. 2005b, The Astronomer’s Telegram, 498
- Markwardt et al. (1999c) Markwardt, C. B., Swank, J. H., & Marshall, F. E. 1999c, IAU Circ., 7120
- Marshall & Markwardt (1999) Marshall, F. E. & Markwardt, C. B. 1999, IAU Circ., 7103
- Marshall et al. (1997) Marshall, F. E., Swank, J. H., Thomas, B., Angelini, L., Valinia, A., & Ebisawa, K. 1997, IAU Circ., 6543
- Marshall et al. (1999) Marshall, F. E., Ueda, Y., & Markwardt, C. B. 1999, IAU Circ., 7133
- Martí et al. (1998) Martí, J., Mirabel, I. F., Rodriguez, L. F., & Chaty, S. 1998, A&A, 332, L45
- Masetti (2002) Masetti, N. 2002, A&A, 381, L45
- Matsuba et al. (1995) Matsuba, E., Dotani, T., Mitsuda, K., Asai, K., Lewin, W. H. G., van Paradijs, J., & van der Klis, M. 1995, PASJ, 47, 575
- Matsuoka et al. (1980) Matsuoka, M., Inoue, H., Koyama, K., Makishima, K., Murakami, T., Oda, M., Ogawara, Y., Ohashi, T., Shibazaki, N., Tanaka, Y., Kondo, I., Hayakawa, S., Kunieda, H., Makino, F., Masai, K., Nagase, F., Tawara, Y., Miyamoto, S., Tsunemi, H., & Yamashita, K. 1980, ApJ, 240, L137
- McClintock et al. (1977) McClintock, J. E., Bradt, H. V., Doxsey, R. E., Jernigan, J. G., Canizares, C. R., & Hiltner, W. A. 1977, Nature, 270, 320
- McClintock et al. (1978) McClintock, J. E., Canizares, C. R., & Backman, D. E. 1978, ApJ, 223, L75
- McClintock & Petro (1981) McClintock, J. E. & Petro, L. D. 1981, IAU Circ., 3615
- Migliari et al. (2003) Migliari, S., Di Salvo, T., Belloni, T., van der Klis, M., Fender, R. P., Campana, S., Kouveliotou, C., Méndez, M., & Lewin, W. H. G. 2003, MNRAS, 342, 909
- Mignani et al. (2002) Mignani, R. P., Chaty, S., Mirabel, I. F., & Mereghetti, S. 2002, A&A, 389, L11
- Miller (1999) Miller, M. C. 1999, ApJ, 515, L77
- Miller (2000) —. 2000, ApJ, 531, 458
- Molkov et al. (2004) Molkov, S., Revnivtsev, M., Lutovinov, A., & Sunyaev, R. 2004, A&A, submitted (astro-ph/0408258)
- Molkov et al. (2000) Molkov, S. V., Grebenev, S. A., & Lutovinov, A. A. 2000, A&A, 357, L41
- Moore et al. (2000) Moore, C. B., Rutledge, R. E., Fox, D. W., Guerriero, R. A., Lewin, W. H. G., Fender, R., & van Paradijs, J. 2000, ApJ, 532, 1181
- Morgan et al. (2005) Morgan, E., Kaaret, P., & Vanderspek, R. 2005, The Astronomer’s Telegram, 523
- Morrison & McCammon (1983) Morrison, R. & McCammon, D. 1983, ApJ, 270, 119
- Motch et al. (1994) Motch, C., Barret, D., Pietsch, W., Hasinger, G., & Giraud, E. 1994, IAU Circ., 6101
- Motch et al. (1987) Motch, C., Pedersen, H., Courvoisier, T. J.-L., Beuermann, K., & Pakull, M. W. 1987, ApJ, 313, 792
- Mukai & Smale (2000) Mukai, K. & Smale, A. P. 2000, ApJ, 533, 352
- Muller et al. (1998) Muller, J. M., Smith, M. J. S., D’Andreta, G., Bazzano, A., Ubertini, P., in ’t Zand, J., & Heise, J. 1998, IAU Circ., 6867
- Muno et al. (2003) Muno, M. P., Baganoff, F. K., & Arabadjis, J. S. 2003, ApJ, 598, 474
- Muno et al. (2002a) Muno, M. P., Chakrabarty, D., Galloway, D. K., & Psaltis, D. 2002a, ApJ, 580, 1048
- Muno et al. (2001) Muno, M. P., Chakrabarty, D., Galloway, D. K., & Savov, P. 2001, ApJ, 553, L157
- Muno et al. (2000) Muno, M. P., Fox, D. W., Morgan, E. H., & Bildsten, L. 2000, ApJ, 542, 1016
- Muno et al. (2004) Muno, M. P., Galloway, D. K., & Chakrabarty, D. 2004, ApJ, 608, 930
- Muno et al. (2002b) Muno, M. P., Remillard, R. A., & Chakrabarty, D. 2002b, ApJ, 568, L35
- Murakami et al. (1983) Murakami, T., Inoue, H., Koyama, K., Makishima, K., Matsuoka, M., Oda, M., Ogawara, Y., Ohashi, T., Makino, F., Shibazaki, N., Tanaka, Y., Hayakawa, S., Kunieda, H., Nagase, F., Masai, K., Tawara, Y., Miyamoto, S., Tsunemi, H., Yamashita, K., & Kondo, I. 1983, PASJ, 35, 531
- Murakami et al. (1980a) Murakami, T., Inoue, H., Koyama, K., Makishima, K., Matsuoka, M., Oda, M., Ogawara, Y., Ohashi, T., Shibazaki, N., Tanaka, Y., Hayakawa, S., Kunieda, H., Makino, F., Masai, K., Nagase, F., Tawara, Y., Miyamoto, S., Tsunemi, H., Yamashita, K., & Kondo, I. 1980a, PASJ, 32, 543
- Murakami et al. (1980b) Murakami, T., Inoue, H., Koyama, K., Makishima, K., Matsuoka, M., Oda, M., Ogawara, Y., Ohashi, T., Shibazaki, N., Tanaka, Y., Tawara, Y., Hayakawa, S., Kunieda, H., Makino, F., Masai, K., Nagase, F., Miyamoto, S., Tsunemi, H., Yamashita, K., & Kondo, I. 1980b, ApJ, 240, L143
- Narayan & Heyl (2003) Narayan, R. & Heyl, J. S. 2003, ApJ, 599, 419
- Natalucci et al. (2004) Natalucci, L., Bazzano, A., Cocchi, M., Ubertini, P., Cornelisse, R., Heise, J., & Zand, J. J. M. i. 2004, A&A, 416, 699
- Natalucci et al. (2000) Natalucci, L., Bazzano, A., Cocchi, M., Ubertini, P., Heise, J., Kuulkers, E., & in ’t Zand, J. J. M. 2000, ApJ, 543, L73
- Natalucci et al. (1999) Natalucci, L., Cornelisse, R., Bazzano, A., Cocchi, M., Ubertini, P., Heise, J., in ’t Zand, J. J. M., & Kuulkers, E. 1999, ApJ, 523, L45
- Naylor et al. (1991) Naylor, T., Charles, P. A., & Longmore, A. J. 1991, MNRAS, 252, 203
- Oda et al. (1981) Oda, M., Kahn, S., Grindlay, J., Halpern, J., & Ladd, E. 1981, IAU Circ., 3624
- Olive et al. (1998) Olive, J. F., Barret, D., Boirin, L., Grindlay, J. E., Swank, J. H., & Smale, A. P. 1998, A&A, 333, 942
- Ortolani et al. (2007) Ortolani, S., Barbuy, B., Bica, E., Zoccali, M., & Renzini, A. 2007, A&A, 470, 1043
- Ortolani et al. (1997) Ortolani, S., Bica, E., & Barbuy, B. 1997, A&A, 326, 614
- Parmar et al. (1989) Parmar, A. N., Gottwald, M., van der Klis, M., & van Paradijs, J. 1989, ApJ, 338, 1024
- Parmar et al. (2001) Parmar, A. N., Oosterbroek, T., Sidoli, L., Stella, L., & Frontera, F. 2001, A&A, 380, 490
- Parmar et al. (1986) Parmar, A. N., White, N. E., Giommi, P., & Gottwald, M. 1986, ApJ, 308, 199
- Patterson et al. (1989) Patterson, T. G., Skinner, G. K., Willmore, A. P., Emam, O., Brinkman, A. C., Heise, J., in ’t Zand, J. J. M., Jager, R., Sunyaev, R., Churazov, E., Gilfanov, M. R., & Yamburenko, N. 1989, in Proc. 23rd ESLAB Symposium on Two Topics in X-ray Astronomy, Bologna, Italy, 13-20 September, ed. J. Hunt & B. Battrick No. SP-296 (ESTEC, Noordwijk, The Netherlands: ESA), 567–572
- Pavlinsky et al. (1994) Pavlinsky, M. N., Grebenev, S. A., & Sunyaev, R. A. 1994, ApJ, 425, 110
- Peng et al. (2007) Peng, F., Brown, E. F., & Truran, J. W. 2007, ApJ, 654, 1022
- Piro & Bildsten (2005) Piro, A. L. & Bildsten, L. 2005, ApJ, 629, 438
- Piro & Bildsten (2007) —. 2007, ApJ, accepted (astro-ph/0704.1278)
- Piro et al. (1997) Piro, L., Heise, J., Jager, R., Feroci, M., D’Andreta, G., Spoliti, G., Coletta, A., Muller, H., & Ricci, D. 1997, IAU Circ., 6538
- Pooley et al. (2003) Pooley, D., Lewin, W. H. G., Anderson, S. F., Baumgardt, H., Filippenko, A. V., Gaensler, B. M., Homer, L., Hut, P., Kaspi, V. M., Makino, J., Margon, B., McMillan, S., Portegies Zwart, S., van der Klis, M., & Verbunt, F. 2003, ApJ, 591, L131
- Pooley et al. (2002) Pooley, D., Lewin, W. H. G., Verbunt, F., Homer, L., Margon, B., Gaensler, B. M., Kaspi, V. M., Miller, J. M., Fox, D. W., & van der Klis, M. 2002, ApJ, 573, 184
- Popham & Sunyaev (2001) Popham, R. & Sunyaev, R. 2001, ApJ, 547, 355
- Predehl et al. (1991) Predehl, P., Hasinger, G., & Verbunt, F. 1991, A&A, 246, L21
- Press et al. (1996) Press, W. H., Teukolsky, S. A., Vetterling, W. T., & Flannery, B. P. 1996, Numerical Recipes in Fortran 77: The Art of Scientific Computing, 2nd edn. (Cambridge, New York, Melbourne: Cambridge University Press), 1447
- Priedhorsky (1986) Priedhorsky, W. 1986, Ap&SS, 126, 89
- Priedhorsky & Terrell (1984a) Priedhorsky, W. & Terrell, J. 1984a, ApJ, 284, L17
- Priedhorsky & Terrell (1984b) Priedhorsky, W. C. & Terrell, J. 1984b, ApJ, 280, 661
- Proctor et al. (1978) Proctor, R. J., Skinner, G. K., & Willmore, A. P. 1978, MNRAS, 185, 745
- Remillard et al. (2003) Remillard, R., Levine, A., Lin, D., & Smith, D. 2003, The Astronomer’s Telegram, 204
- Revnivtsev et al. (2001) Revnivtsev, M., Churazov, E., Gilfanov, M., & Sunyaev, R. 2001, A&A, 372, 138
- Revnivtsev & Sunyaev (2002) Revnivtsev, M. G. & Sunyaev, R. A. 2002, Astronomy Letters, 28, 19
- Sansom et al. (1993) Sansom, A. E., Dotani, T., Asai, K., & Lehto, H. J. 1993, MNRAS, 262, 429
- Schatz et al. (2001) Schatz, H., Aprahamian, A., Barnard, V., Bildsten, L., Cumming, A., Ouellette, M., Rauscher, T., Thielemann, F.-K., & Wiescher, M. 2001, Physical Review Letters, 86, 3471
- Schatz et al. (1999) Schatz, H., Bildsten, L., Cumming, A., & Wiescher, M. 1999, ApJ, 524, 1014
- Seward et al. (1976) Seward, F. D., Page, C. G., Turner, M. J. L., & Pounds, K. A. 1976, MNRAS, 175, 39P
- Shahbaz et al. (1998) Shahbaz, T., Thorstensen, J. R., Charles, P. A., & Sherman, N. D. 1998, MNRAS, 296, 1004
- Shaposhnikov et al. (2003) Shaposhnikov, N., Titarchuk, L., & Haberl, F. 2003, ApJ, 593, L35
- Sidoli et al. (2004) Sidoli, L., Bocchino, F., Mereghetti, S., & Bandiera, R. 2004, Memorie della Societa Astronomica Italiana, 75, 507
- Sidoli et al. (1998) Sidoli, L., Mereghetti, S., Israel, G. L., Cusumano, G., Chiappetti, L., & Treves, A. 1998, A&A, 336, L81
- Skinner et al. (1990) Skinner, G. K., Foster, A. J., Willmore, A. P., & Eyles, C. J. 1990, MNRAS, 243, 72
- Skinner et al. (1987) Skinner, G. K., Willmore, A. P., Eyles, C. J., Bertram, D., & Church, M. J. 1987, Nature, 330, 544
- Smale (1995) Smale, A. P. 1995, AJ, 110, 1292
- Smale (1998) —. 1998, ApJ, 498, L141
- Smale (2001) —. 2001, ApJ, 562, 957
- Smale et al. (1988) Smale, A. P., Mason, K. O., White, N. E., & Gottwald, M. 1988, MNRAS, 232, 647
- Smith et al. (1997) Smith, D. A., Morgan, E. H., & Bradt, H. 1997, ApJ, 479, L137
- Soria et al. (1999) Soria, R., Wu, K., & Galloway, D. K. 1999, MNRAS, 309, 528
- Spitkovsky et al. (2002) Spitkovsky, A., Levin, Y., & Ushomirsky, G. 2002, ApJ, 566, 1018
- Steeghs et al. (2004) Steeghs, D., Torres, M. A. P., McClintock, J. E., Garcia, M. R., & Mallen-Ornelas, G. 2004, The Astronomer’s Telegram, 267
- Stella et al. (1987) Stella, L., White, N. E., & Priedhorsky, W. 1987, ApJ, 312, L17
- Strohmayer & Bildsten (2006) Strohmayer, T. & Bildsten, L. 2006, in Compact Stellar X-Ray Sources, ed. W. H. G. Lewin & M. van der Klis (Cambridge University Press), (astro–ph/0301544)
- Strohmayer & Brown (2002) Strohmayer, T. E. & Brown, E. F. 2002, ApJ, 566, 1045
- Strohmayer et al. (1997a) Strohmayer, T. E., Jahoda, K., Giles, A. B., & Lee, U. 1997a, ApJ, 486, 355
- Strohmayer & Markwardt (2002) Strohmayer, T. E. & Markwardt, C. B. 2002, ApJ, 577, 337
- Strohmayer et al. (2008) Strohmayer, T. E., Markwardt, C. B., & Kuulkers, E. 2008, ApJ, 672, L37
- Strohmayer et al. (2003) Strohmayer, T. E., Markwardt, C. B., Swank, J. H., & in ’t Zand, J. 2003, ApJ, 596, L67
- Strohmayer et al. (1997b) Strohmayer, T. E., Zhang, W., & Swank, J. H. 1997b, ApJ, 487, L77
- Strohmayer et al. (1998a) Strohmayer, T. E., Zhang, W., Swank, J. H., & Lapidus, I. 1998a, ApJ, 503, L147
- Strohmayer et al. (1996) Strohmayer, T. E., Zhang, W., Swank, J. H., Smale, A., Titarchuk, L., Day, C., & Lee, U. 1996, ApJ, 469, L9
- Strohmayer et al. (1998b) Strohmayer, T. E., Zhang, W., Swank, J. H., White, N. E., & Lapidus, I. 1998b, ApJ, 498, L135
- Sugimoto et al. (1984) Sugimoto, D., Ebisuzaki, T., & Hanawa, T. 1984, PASJ, 36, 839
- Sunyaev et al. (1990) Sunyaev, R., Gilfanov, M., Churazov, E., Loznikov, V., Yamburenko, N., Skinner, G. K., Patterson, T. G., Willmore, A. P., Emam, O., Brinkman, A. C., Heise, J., in ’t Zand, J. J. M., & Jager, R. 1990, Pis ma Astronomicheskii Zhurnal, 16, 136
- Swank et al. (1977) Swank, J. H., Becker, R. H., Boldt, E. A., Holt, S. S., Pravdo, S. H., & Serlemitsos, P. J. 1977, ApJ, 212, L73
- Swank et al. (1976a) Swank, J. H., Becker, R. H., Pravdo, S. H., Saba, J. R., & Serlemitsos, P. J. 1976a, IAU Circ., 3000
- Swank et al. (1976b) —. 1976b, IAU Circ., 3010
- Swank et al. (1976c) Swank, J. H., Becker, R. H., Pravdo, S. H., & Serlemitsos, P. J. 1976c, IAU Circ., 2963
- Swank et al. (1978) Swank, J. H., Boldt, E. A., Holt, S. S., Serlemitsos, P. J., & Becker, R. H. 1978, MNRAS, 182, 349
- Sztajno et al. (1983) Sztajno, M., Basinska, E. M., Cominsky, L. R., Marshall, F. J., & Lewin, W. H. G. 1983, ApJ, 267, 713
- Sztajno et al. (1987) Sztajno, M., Fujimoto, M. Y., van Paradijs, J., Vacca, W. D., Lewin, W. H. G., Penninx, W., & Trumper, J. 1987, MNRAS, 226, 39
- Sztajno et al. (1986) Sztajno, M., van Paradijs, J., Lewin, W. H. G., Langmeier, A., Trumper, J., & Pietsch, W. 1986, MNRAS, 222, 499
- Taam et al. (1996) Taam, R. E., Woosley, S. E., & Lamb, D. Q. 1996, ApJ, 459, 271
- Tanaka (1989) Tanaka, Y. 1989, in Proc. 23rd ESLAB Symposium on Two Topics in X-ray Astronomy, Bologna, Italy, 13-20 September, ed. J. Hunt & B. Battrick No. SP-296 (ESTEC, Noordwijk, The Netherlands: ESA), 3–13
- Tananbaum et al. (1976) Tananbaum, H., Chaisson, L. J., Forman, W., Jones, C., & Matilsky, T. A. 1976, ApJ, 209, L125
- Tawara et al. (1984) Tawara, Y., Hirano, T., Kii, T., Matsuoka, M., & Murakami, T. 1984, PASJ, 36, 861
- Tennant et al. (1986) Tennant, A. F., Fabian, A. C., & Shafer, R. A. 1986, MNRAS, 219, 871
- Thorsett & Chakrabarty (1999) Thorsett, S. E. & Chakrabarty, D. 1999, ApJ, 512, 288
- Thorstensen et al. (1978) Thorstensen, J., Charles, P., & Bowyer, S. 1978, ApJ, 220, L131
- Thorstensen et al. (1980) Thorstensen, J. R., Bowyer, S., & Charles, P. A. 1980, ApJ, 238, 964
- Titarchuk (1994a) Titarchuk, L. 1994a, ApJ, 434, 570
- Titarchuk (1994b) —. 1994b, ApJ, 429, 340
- Titarchuk & Shaposhnikov (2002) Titarchuk, L. & Shaposhnikov, N. 2002, ApJ, 570, L25
- Tomsick et al. (1999) Tomsick, J. A., Halpern, J. P., Kemp, J., & Kaaret, P. 1999, ApJ, 521, 341
- Tomsick et al. (2001) Tomsick, J. A., Heindl, W. A., Chakrabarty, D., Halpern, J. P., & Kaaret, P. 2001, ApJ, 559, L123
- Tomsick et al. (2002) Tomsick, J. A., Heindl, W. A., Chakrabarty, D., & Kaaret, P. 2002, ApJ, 581, 570
- Torres et al. (2006) Torres, M. A. P., Steeghs, D., Garcia, M. R., McClintock, J. E., Jonker, P. G., Kaplan, D., Casares, J., Greimel, R., & Augusteijn, T. 2006, The Astronomer’s Telegram, 784
- Ubertini et al. (1997) Ubertini, P., Bazzano, A., Cocchi, M., Natalucci, L., Heise, J., Jager, R., in ’t Zand, J., Muller, J. M., Smith, M., Celidonio, G., Coletta, A., Ricci, R., Giommi, P., Ricci, D., Capalbi, M., Menna, M. T., & Rebecchi, S. 1997, IAU Circ., 6611
- Ubertini et al. (1999) Ubertini, P., Bazzano, A., Cocchi, M., Natalucci, L., Heise, J., Muller, J. M., & in ’t Zand, J. J. M. 1999, ApJ, 514, L27
- Ulmer et al. (1977) Ulmer, M. P., Lewin, W. H. G., Hoffman, J. A., Doty, J., & Marshall, H. 1977, ApJ, 214, L11
- Vacca et al. (1986) Vacca, W. D., Lewin, W. H. G., & van Paradijs, J. 1986, MNRAS, 220, 339
- van den Heuvel et al. (2004) van den Heuvel, E. P. J., Wijers, R. A. M. J., & in ’t Zand, J. J. M., eds. 2004, Proceedings of the 2nd BeppoSAX Conference: ”The Restless High-Energy Universe”, Amsterdam, 5–9 May 2003, Vol. 132
- van der Klis et al. (1984) van der Klis, M., van Paradijs, J., Jansen, F. A., & Lewin, W. H. G. 1984, IAU Circ., 3961
- van Paradijs (1978) van Paradijs, J. 1978, Nature, 274, 650
- van Paradijs et al. (1990a) van Paradijs, J., Dotani, T., Tanaka, Y., & Tsuru, T. 1990a, PASJ, 42, 633
- van Paradijs & Lewin (1986) van Paradijs, J. & Lewin, W. H. G. 1986, A&A, 157, L10
- van Paradijs & McClintock (1994) van Paradijs, J. & McClintock, J. E. 1994, A&A, 290, 133
- van Paradijs et al. (1988a) van Paradijs, J., Penninx, W., & Lewin, W. H. G. 1988a, MNRAS, 233, 437
- van Paradijs et al. (1988b) van Paradijs, J., Penninx, W., Lewin, W. H. G., Sztajno, M., & Truemper, J. 1988b, A&A, 192, 147
- van Paradijs et al. (1990b) van Paradijs, J., van der Klis, M., van Amerongen, S., Pedersen, H., Smale, A. P., Mukai, K., Schoembs, R., Haefner, R., Pfeiffer, M., & Lewin, W. H. G. 1990b, A&A, 234, 181
- van Straaten et al. (2001) van Straaten, S., van der Klis, M., Kuulkers, E., & Méndez, M. 2001, ApJ, 551, 907
- Vanderspek et al. (2005) Vanderspek, R., Morgan, E., Crew, G., Graziani, C., & Suzuki, M. 2005, The Astronomer’s Telegram, 516
- Villarreal & Strohmayer (2004) Villarreal, A. R. & Strohmayer, T. E. 2004, ApJ, 614, L121
- Vrtilek et al. (1990) Vrtilek, S. D., Raymond, J. C., Garcia, M. R., Verbunt, F., Hasinger, G., & Kurster, M. 1990, A&A, 235, 162
- Wachter et al. (2004) Wachter, S., Wellhouse, J. W., Patel, S. K., Smale, A. P., Alves, J., & Bouchet, P. 2004, ApJ, accepted (astro-ph/0411360)
- Walter et al. (1982) Walter, F. M., Mason, K. O., Clarke, J. T., Halpern, J., Grindlay, J. E., Bowyer, S., & Henry, J. P. 1982, ApJ, 253, L67
- Watts et al. (2005) Watts, A. L., Strohmayer, T. E., & Markwardt, C. B. 2005, ApJ, 634, 547
- Werner et al. (2004) Werner, N., in ’t Zand, J. J. M., Natalucci, L., Markwardt, C. B., Cornelisse, R., Bazzano, A., Cocchi, M., Heise, J., & Ubertini, P. 2004, A&A, 416, 311
- White & Angelini (2001) White, N. E. & Angelini, L. 2001, ApJ, 561, L101
- White & Swank (1982) White, N. E. & Swank, J. H. 1982, ApJ, 253, L61
- Wijnands (2001) Wijnands, R. 2001, ApJ, 554, L59
- Wijnands (2004) —. 2004, Nucl. Phys. B, 132, 496
- Wijnands et al. (2001a) Wijnands, R., Groot, P. J., Miller, J. J., Markwardt, C., Lewin, W. H. G., & van der Klis, M. 2001a, The Astronomer’s Telegram, 72
- Wijnands et al. (2004) Wijnands, R., Homan, J., Miller, J. M., & Lewin, W. H. G. 2004, ApJ, 606, L61
- Wijnands et al. (2001b) Wijnands, R., Miller, J. M., Markwardt, C., Lewin, W. H. G., & van der Klis, M. 2001b, ApJ, 560, L159
- Wijnands et al. (2002a) Wijnands, R., Miller, J. M., & Wang, Q. D. 2002a, ApJ, 579, 422
- Wijnands et al. (2002b) Wijnands, R., Muno, M. P., Miller, J. M., Franco, L. ., Strohmayer, T., Galloway, D., & Chakrabarty, D. 2002b, ApJ, 566, 1060
- Wijnands et al. (2001c) Wijnands, R., Strohmayer, T., & Franco, L. M. 2001c, ApJ, 549, L71
- Wijnands & van der Klis (1998) Wijnands, R. & van der Klis, M. 1998, Nature, 394, 344
- Wijnands & van der Klis (1999) —. 1999, A&A, 345, L35
- Wilson et al. (2003) Wilson, C. A., Patel, S. K., Kouveliotou, C., Jonker, P. G., van der Klis, M., Lewin, W. H. G., Belloni, T., & Méndez, M. 2003, ApJ, 596, 1220
- Wolff et al. (2005) Wolff, M. T., Becker, P. A., Ray, P. S., & Wood, K. S. 2005, ApJ, 632, 1099
- Woosley et al. (2004) Woosley, S. E., Heger, A., Cumming, A., Hoffman, R. D., Pruet, J., Rauscher, T., Fisker, J. L., Schatz, H., Brown, B. A., & Wiescher, M. 2004, ApJS, 151, 75
- Woosley & Weaver (1984) Woosley, S. E. & Weaver, T. A. 1984, in High Energy Transients in Astrophysics, 273
- Zhang et al. (1998) Zhang, W., Jahoda, K., Kelley, R. L., Strohmayer, T. E., Swank, J. H., & Zhang, S. N. 1998, ApJ, 495, L9
| Burst | Maximum | Mean | ||||
|---|---|---|---|---|---|---|
| Source and frequency | ID | Start time | PRE? | Location | power | % RMS |
| 4U 1916053 (270 Hz) | 9 | 1998 Aug 1 18:23:49 | N | R P D | 28.3 | |
| \colruleXTE J1814338 (314 Hz) | 1 | 2003 Jun 6 00:58:30 | N | R – D | 21.2 | |
| 2 | 2003 Jun 7 06:26:52 | N | – P D | 40.3 | ||
| 3 | 2003 Jun 7 21:12:21 | N | R P D | 37.1 | ||
| 4 | 2003 Jun 9 04:42:35 | N | R P D | 41.0 | ||
| 5 | 2003 Jun 10 02:23:00 | N | R P D | 37.8 | ||
| 6 | 2003 Jun 11 00:42:02 | N | 36.0 | |||
| 7 | 2003 Jun 12 11:11:37 | N | – P D | 44.5 | ||
| 8 | 2003 Jun 12 13:31:06 | N | R – D | 30.2 | ||
| 9 | 2003 Jun 13 01:25:31 | N | 49.0 | |||
| 10 | 2003 Jun 13 17:37:13 | N | R P D | 26.4 | ||
| 11 | 2003 Jun 14 00:20:54 | N | R P D | 38.9 | ||
| 12 | 2003 Jun 15 18:56:50 | N | R P D | 34.0 | ||
| 13 | 2003 Jun 16 17:56:22 | N | R P D | 49.0 | ||
| 14 | 2003 Jun 16 19:37:54 | N | 40.0 | |||
| 15 | 2003 Jun 17 16:00:21 | N | R P D | 36.0 | ||
| 16 | 2003 Jun 18 19:05:18 | N | R P D | 35.5 | ||
| 17 | 2003 Jun 19 18:45:29 | N | R P D | 37.3 | ||
| 18 | 2003 Jun 20 01:38:10 | N | R P D | 37.4 | ||
| 19 | 2003 Jun 20 21:38:02 | N | R – D | 20.9 | ||
| 20 | 2003 Jun 21 15:20:59 | N | R P D | 27.0 | ||
| 21 | 2003 Jun 22 21:19:41 | N | R P D | 44.2 | ||
| 22 | 2003 Jun 23 11:15:00 | N | R P D | 42.0 | ||
| 23 | 2003 Jun 27 16:38:50 | N | R P D | 42.3 | ||
| 24 | 2003 Jun 27 21:12:01 | N | R P D | 38.5 | ||
| 25 | 2003 Jun 28 20:29:15 | N | R P D | 42.1 | ||
| 26 | 2003 Jul 7 06:05:03 | N | R P D | 41.5 | ||
| 27 | 2003 Jul 8 19:02:33 | N | R P D | 35.7 | ||
| 28 | 2003 Jul 17 17:42:46 | ? | R P D | 25.1 | ||
| \colrule4U 1702429 (329 Hz) | 2 | 1997 Jul 19 18:40:58 | N | – P D | 28.5 | |
| 3 | 1997 Jul 26 09:03:23 | N | – P D | 120 | ||
| 4 | 1997 Jul 26 14:04:18 | N | R P D | 127 | ||
| 5 | 1997 Jul 30 07:22:37 | N | – P D | 49.9 | ||
| 6 | 1997 Jul 30 12:11:56 | N | R – D | 87.3 | ||
| 7 | 1999 Feb 21 23:48:32 | N | – P D | 28.9 | ||
| 8 | 1999 Feb 22 04:56:05 | N | R P D | 22.6 | ||
| 9 | 2000 Jun 22 11:57:46 | N | R – – | 25.2 | ||
| 10 | 2000 Jul 23 07:09:42 | N | – – D | 71.3 | ||
| 14 | 2001 Feb 4 03:50:29 | N | – P D | 27.2 | ||
| 15 | 2001 Apr 1 15:47:17 | N | R P – | 32.0 | ||
| 16 | 2001 Apr 1 21:55:53 | N | – P D | 115 | ||
| 18 | 2001 Nov 16 17:02:10 | N | – – D | 21.7 | ||
| 20 | 2004 Jan 18 01:17:56 | N | – P – | 15.2 | ||
| 21 | 2004 Jan 18 21:12:37 | N | – – D | 18.5 | ||
| 22 | 2004 Jan 20 00:30:01 | N | – P – | 29.7 | ||
| 23 | 2004 Feb 29 01:59:38 | N | – – D | 34.1 | ||
| 24 | 2004 Feb 29 06:32:16 | N | R P D | 19.4 | ||
| 26 | 2004 Mar 1 23:26:40 | N | R – – | 31.7 | ||
| 27 | 2004 Mar 2 07:27:52 | N | R P – | 19.2 | ||
| 28 | 2004 Apr 8 22:12:46 | N | – P D | 39.4 | ||
| 29 | 2004 Apr 9 06:18:07 | N | – – D | 68.0 | ||
| 30 | 2004 Apr 9 21:32:20 | N | – – D | 27.0 | ||
| 31 | 2004 Apr 11 08:44:45 | N | R – D | 22.0 | ||
| 32 | 2004 Apr 12 06:56:34 | N | R P – | 18.5 | ||
| 35 | 2004 Apr 13 05:40:02 | N | R P D | 25.8 | ||
| 36 | 2004 Apr 13 12:11:53 | N | – – D | 27.5 | ||
| 37 | 2004 Apr 13 18:17:23 | N | R P – | 36.3 | ||
| 38 | 2004 Apr 14 18:32:01 | N | – – D | 31.9 | ||
| 39 | 2004 Apr 15 00:43:14 | N | R P D | 28.1 | ||
| 40 | 2004 Apr 16 02:08:57 | N | 30.0 | |||
| 41 | 2004 Apr 16 20:29:36 | N | – P D | 56.5 | ||
| 42 | 2004 Apr 17 02:45:18 | N | – P D | 67.8 | ||
| 46 | 2004 Nov 3 03:28:32 | ? | R P – | 14.9 | ||
| 47 | 2005 Sep 17 10:26:25 | N | – P – | 22.9 | ||
| \colrule4U 172834 (363 Hz) | 2 | 1996 Feb 15 21:10:21 | Y | – – D | 22.8 | |
| 3 | 1996 Feb 16 03:57:11 | N | R – – | 14.2 | ||
| 4 | 1996 Feb 16 06:51:10 | Y | – – D | 37.3 | ||
| 5 | 1996 Feb 16 10:00:47 | Y | R P D | 55.0 | ||
| 6 | 1996 Feb 16 19:27:13 | Y | – – D | 21.9 | ||
| 7 | 1996 Feb 18 17:31:52 | Y | – – D | 30.4 | ||
| 13 | 1997 Jul 17 05:14:34 | Y | – P D | 21.0 | ||
| 14 | 1997 Sep 19 12:32:58 | N | R – – | 25.1 | ||
| 15 | 1997 Sep 20 10:08:52 | N | R P D | 73.1 | ||
| 16 | 1997 Sep 21 15:45:31 | N | R P – | 19.3 | ||
| 17 | 1997 Sep 21 18:11:07 | N | R P D | 30.0 | ||
| 18 | 1997 Sep 22 06:42:53 | N | – P D | 94.2 | ||
| 19 | 1997 Sep 26 14:44:12 | N | R – – | 18.2 | ||
| 20 | 1997 Sep 26 17:29:50 | N | – P D | 25.1 | ||
| 22 | 1997 Sep 27 15:54:06 | Y | – P D | 32.3 | ||
| 39 | 1998 Nov 16 16:09:06 | Y | – – D | 30.2 | ||
| 41 | 1998 Nov 17 13:44:09 | Y | – – D | 25.8 | ||
| 46 | 1999 Jan 23 23:49:02 | Y | – – D | 19.9 | ||
| 47 | 1999 Jan 24 08:35:55 | ? | – – D | 22.5 | ||
| 51 | 1999 Jan 28 03:22:34 | Y | 20.0 | |||
| 53 | 1999 Jan 31 22:02:00 | Y | – P D | 80.6 | ||
| 54 | 1999 Feb 1 01:58:43 | Y | – P D | 15.2 | ||
| 55 | 1999 Feb 4 22:31:25 | Y | – P D | 46.3 | ||
| 59 | 1999 Mar 3 01:07:06 | Y | R – – | 19.4 | ||
| 64 | 1999 Aug 19 09:33:48 | N | R – D | 23.8 | ||
| 65 | 1999 Aug 19 12:09:22 | N | R P D | 86.2 | ||
| 66 | 1999 Aug 19 14:00:44 | N | – P – | 21.7 | ||
| 67 | 1999 Aug 19 15:46:58 | N | R P D | 40.9 | ||
| 68 | 1999 Aug 20 05:54:45 | N | R P D | 43.9 | ||
| 70 | 1999 Sep 22 05:14:11 | Y | – – D | 20.5 | ||
| 85 | 2001 Apr 8 14:42:54 | Y | 21.0 | |||
| 86 | 2001 Apr 9 02:05:24 | Y | – P D | 21.0 | ||
| 93 | 2001 Sep 17 22:15:24 | N | – P D | 25.8 | ||
| 94 | 2001 Oct 18 03:33:29 | ? | – P D | 35.0 | ||
| 95 | 2001 Oct 18 09:26:09 | N | – P – | 19.9 | ||
| 96 | 2001 Oct 27 23:53:44 | N | R – – | 31.0 | ||
| 105 | 2004 Mar 12 01:41:13 | N | – P D | 40.7 | ||
| 106 | 2005 Apr 5 06:19:54 | ? | – P – | 21.4 | ||
| \colruleSAX J1808.43658 (401 Hz) | 1 | 2002 Oct 15 09:55:37 | Y | R – – | 143 | |
| 2 | 2002 Oct 17 07:19:24 | Y | – – D | 63.1 | ||
| 3 | 2002 Oct 18 04:25:20 | Y | R – D | 40.9 | ||
| 4 | 2002 Oct 19 10:14:33 | Y | R – D | 123 | ||
| \colruleKS 1731260 (524 Hz) | 1 | 1996 Jul 14 04:16:13 | Y | – P D | 41.3 | |
| 7 | 1999 Feb 23 03:09:01 | N | R – – | 18.9 | ||
| 8 | 1999 Feb 26 17:13:09 | Y | R – D | 27.9 | ||
| 9 | 1999 Feb 27 17:25:08 | Y | – – D | 93.2 | ||
| \colrule1A 1744361 (530 Hz) | 1 | 2005 Jul 16 22:39:56 | N | R – – | 38.3 | |
| \colruleAql X-1 (549 Hz) | 4 | 1997 Mar 1 23:26:36 | Y | – P D | 71.5 | |
| 5 | 1997 Sep 5 12:33:57 | Y | – P – | 21.1 | ||
| 10 | 1999 Jun 3 18:43:03 | Y | – P – | 53.3 | ||
| 19 | 2000 Nov 8 03:45:56 | Y | – P D | 33.6 | ||
| 24 | 2001 Jul 1 14:18:37 | N | R P – | 16.7 | ||
| 28 | 2002 Feb 19 23:46:23 | Y | – P D | 30.6 | ||
| \colruleMXB 1659298 (567 Hz) | 2 | 1999 Apr 9 14:47:34 | Y | R – – | 19.0 | |
| 3 | 1999 Apr 10 09:49:36 | Y | R – D | 28.9 | ||
| 4 | 1999 Apr 14 11:48:56 | Y | – – D | 20.8 | ||
| 9 | 1999 Apr 21 11:45:57 | Y | 45.0 | |||
| 12 | 1999 May 5 11:09:51 | Y | R – – | 22.3 | ||
| 21 | 2001 Apr 30 17:41:33 | N | – P – | 19.7 | ||
| \colrule4U 1636536 (581 Hz) | 1 | 1996 Dec 28 22:39:24 | Y | R – D | 37.4 | |
| 2 | 1996 Dec 28 23:54:04 | N | R P D | 40.8 | ||
| 3 | 1996 Dec 29 23:26:47 | Y | R – D | 58.1 | ||
| 4 | 1996 Dec 31 17:36:52 | Y | – – D | 23.5 | ||
| 6 | 1998 Aug 19 11:44:39 | Y | R – D | 69.7 | ||
| 7 | 1998 Aug 20 03:40:09 | Y | – – D | 42.2 | ||
| 8 | 1998 Aug 20 05:14:12 | N | R P D | 92.8 | ||
| 9 | 1999 Feb 27 08:47:29 | Y | R P D | 34.9 | ||
| 10 | 1999 Apr 29 01:43:39 | Y | 21.0 | |||
| 12 | 1999 Jun 10 05:55:30 | Y | – – D | 98 | ||
| 13 | 1999 Jun 18 23:43:04 | Y | R – D | 28.1 | ||
| 14 | 1999 Jun 19 17:30:58 | Y | – – D | 76.8 | ||
| 15 | 1999 Jun 21 19:05:53 | Y | R – D | 23.3 | ||
| 16 | 1999 Sep 25 20:40:49 | Y | R – – | 22.2 | ||
| 20 | 2000 Jun 15 05:05:44 | Y | – P D | 137 | ||
| 21 | 2000 Aug 9 01:18:40 | Y | – – D | 62.8 | ||
| 22 | 2000 Aug 9 08:56:53 | Y | – – D | 38.4 | ||
| 23 | 2000 Aug 12 23:32:21 | Y | – – D | 68.8 | ||
| 24 | 2000 Oct 3 23:32:48 | Y | R – D | 20.8 | ||
| 25 | 2000 Nov 5 04:21:59 | Y | R – D | 60.2 | ||
| 26 | 2000 Nov 12 18:02:28 | Y | R P D | 40.1 | ||
| 27 | 2001 Jan 28 02:47:13 | Y | – – D | 47.5 | ||
| 28 | 2001 Feb 1 21:00:50 | Y | – – D | 37.8 | ||
| 29 | 2001 Feb 2 02:24:20 | Y | – – D | 21.9 | ||
| 30 | 2001 Apr 5 17:07:05 | Y | 23.0 | |||
| 31 | 2001 Apr 30 05:28:34 | Y | R P D | 30.5 | ||
| 34 | 2001 Jun 15 03:14:04 | Y | – – D | 65.0 | ||
| 37 | 2001 Aug 23 00:50:33 | N | R P – | 19.3 | ||
| 38 | 2001 Aug 28 06:41:20 | Y | – P D | 46.9 | ||
| 39 | 2001 Sep 5 05:42:07 | N | – – D | 21.7 | ||
| 45 | 2001 Sep 30 14:47:17 | Y | R P D | 43.7 | ||
| 49 | 2001 Nov 1 07:38:18 | Y | – P D | 40.2 | ||
| 57 | 2001 Dec 31 04:05:41 | N | – – D | 20.3 | ||
| 61 | 2002 Jan 9 00:26:38 | Y | R – D | 32.1 | ||
| 62 | 2002 Jan 9 12:48:24 | Y | – P D | 56.0 | ||
| 66 | 2002 Jan 11 16:52:27 | N | – – D | 21.2 | ||
| 70 | 2002 Jan 12 01:53:57 | N | – P – | 39.6 | ||
| 71 | 2002 Jan 12 02:10:43 | N | 21.0 | |||
| 72 | 2002 Jan 12 13:18:42 | Y | 29.0 | |||
| 75 | 2002 Jan 12 21:35:34 | N | R P – | 53.9 | ||
| 77 | 2002 Jan 13 01:29:03 | N | R P – | 110 | ||
| 80 | 2002 Jan 13 12:47:26 | N | R – – | 26.9 | ||
| 84 | 2002 Jan 14 01:22:36 | N | R P – | 62.3 | ||
| 86 | 2002 Jan 14 12:20:36 | Y | – – D | 15.9 | ||
| 102 | 2002 Jan 22 07:07:20 | N | R P D | 58.8 | ||
| 105 | 2002 Jan 25 03:58:06 | N | R – – | 15.1 | ||
| 109 | 2002 Jan 30 23:06:55 | ? | R – D | 23.4 | ||
| 110 | 2002 Feb 5 22:21:51 | Y | R – D | 43.3 | ||
| 111 | 2002 Feb 11 17:35:07 | Y | R P D | 39.1 | ||
| 113 | 2002 Feb 28 23:42:53 | N | R – D | 21.1 | ||
| 115 | 2002 Apr 26 05:07:18 | ? | R P D | 49.9 | ||
| 127 | 2005 Mar 23 05:27:58 | N | R – – | 18.8 | ||
| 136 | 2005 May 26 07:30:53 | Y | – – D | 20.5 | ||
| 137 | 2005 Jun 3 09:19:54 | Y | 27.0 | |||
| 138 | 2005 Jun 11 02:42:04 | N | R – – | 15.3 | ||
| 146 | 2005 Aug 4 04:34:09 | N | 22.0 | |||
| 148 | 2005 Aug 10 05:36:36 | N | R P – | 31.9 | ||
| 150 | 2005 Aug 16 01:45:36 | Y | R – D | 33.0 | ||
| 168 | 2005 Nov 14 22:50:45 | Y | – – D | 19.9 | ||
| \colruleGRS 1741.92853 (589 Hz) | 4 | 1996 May 15 19:32:24 | Y | 20.0 | ||
| 6 | 1996 Jun 19 09:55:40 | Y | 21.0 | |||
| \colruleSAX J1750.82900 (601 Hz) | 2 | 2001 Apr 12 14:20:31 | Y | R – D | 20.3 | |
| 3 | 2001 Apr 15 17:02:25 | Y | R – – | 24.1 | ||
| 4 | 2001 Apr 15 18:37:07 | N | R – – | 20.8 | ||
| \colrule4U 160852 (620 Hz) | 5 | 1998 Mar 27 14:05:19 | Y | – – D | 19.4 | |
| 8 | 1998 Apr 11 06:35:31 | Y | R – – | 18.0 | ||
| 10 | 2000 Mar 11 01:42:36 | Y | R – – | 15.9 | ||
| 21 | 2002 Sep 7 02:26:15 | Y | R P D | 24.2 | ||
| 22 | 2002 Sep 9 03:50:29 | Y | R P D | 49.5 | ||
| 23 | 2002 Sep 12 04:18:15 | Y | – P D | 126 | ||
| 25 | 2002 Sep 19 07:38:20 | Y | – P – | 49.1 |
| Number | Distance (kpc)aaWhere no radius expansion bursts have been observed, the upper limit on the distance is calculated from the peak flux of the brightest burst observed by RXTE. | Max. distance (kpc)bbUpper limits on the distance calculated from the peak flux of the faintest burst exhibiting radius expansion | ||||
|---|---|---|---|---|---|---|
| Source | of bursts | |||||
| 4U 051340 | 1 | 19.8 | 8.2 | 11 | ||
| EXO 0748676 | 3 | |||||
| 1M 0836425 | ||||||
| 4U 091954 | 1 | 81.9 | 4.0 | 5.3 | ||
| 4U 125469ccOnly marginal cases of radius-expansion were available for this source | 4 | |||||
| 4U 132362 | ||||||
| 4U 160852 | 12 | |||||
| 4U 1636536ddFor 4U 1636536, the peak flux distribution is bimodal, with a separation factor of . The lower flux radius-expansion bursts are thus identified with the Eddington limit for material with cosmic abundances (), while the brigher bursts are assumed to reach the Eddington limit for He-only. The two distances are thus calculated using the appropriate group for each of the two abundance options | 46 | |||||
| MXB 1659298 | 12 | |||||
| 4U 1702429 | 5 | |||||
| 4U 170544 | 3 | |||||
| XTE J1709267ccOnly marginal cases of radius-expansion were available for this source | 1 | 11.0 | 11 | 14 | ||
| XTE J1710281 | 1 | 9.25 | 12 | 16 | ||
| XTE J1723376 | ||||||
| 4U 1724307 | 2 | |||||
| 4U 172834 | 69 | |||||
| Rapid Burster | ||||||
| KS 1731260 | 3 | |||||
| SLX 1735269 | ||||||
| 4U 173544 | 6 | |||||
| XTE J1739285 | ||||||
| KS 1741293 | ||||||
| GRS 1741.92853 | 6 | |||||
| 2E 1742.92929 | 2 | |||||
| SAX J1747.02853 | 10 | |||||
| IGR 174732721 | ||||||
| SLX 1744300 | ||||||
| GX 3+1 | 1 | 53.0 | 5.0 | 6.5 | ||
| 1A 1744361 | ||||||
| SAX J1748.92021 | 6 | |||||
| EXO 1745248 | 2 | |||||
| 4U 174637 | 3 | |||||
| SAX J1750.82900 | 2 | |||||
| GRS 1747312 | 3 | |||||
| XTE J1759220 | ||||||
| SAX J1808.43658 | 5 | |||||
| XTE J1814338ccOnly marginal cases of radius-expansion were available for this source | 1 | 21.3 | 7.9 | 10 | ||
| GX 17+2 | 2 | |||||
| 3A 1820303 | 5 | |||||
| GS 182624 | ||||||
| XB 1832330 | 1 | 29.7 | 6.7 | 8.7 | ||
| Ser X-1 | 2 | |||||
| HETE J1900.12455 | 3 | |||||
| Aql X-1 | 9 | |||||
| 4U 1916053 | 12 | |||||
| XTE J2123058 | ||||||
| 4U 2129+12 | 1 | 39.6 | 5.8 | 7.6 | ||
| Cyg X-2 | 8 | |||||
Note. — The distances here are derived assuming a canonical neutron star with and km. The corresponding distances for a neutron star will be a factor of 9.3% larger.
| Position | Peak burst flux | Energy | |||||
|---|---|---|---|---|---|---|---|
| Source | Alt. name | () | range | PRE | Ref. | ||
| XTE J1739285 | 359.725 | 1.30 | 10–28 | bolometric | N | [1] | |
| SLX 1737282 | 2E 1737.52817 | 359.973 | 1.25 | bolometric | Y | [2] | |
| KS 1741293 | AX J1744.8-2921 | 359.554 | -0.0677 | 2–30 keV | single peak | [3] | |
| N | |||||||
| GRS 1741.92853 | AX J1745.02855 | 359.960 | 0.132 | 3–28 keV | Y | [4] | |
| 1A 1742289 | AX J1745.62901 | 359.929 | -0.0421 | bolometric | N | [5] | |
| aaWeighted mean and standard deviation of peak flux from 19 fainter bursts (mean 2–60 keV flux ) | N? | ||||||
| 2E 1742.92929 | GC X-1/1A 1742293/4 | 359.558 | -0.393 | 3–20 keV | Y? | [6] | |
| bolometric | N | [7] | |||||
| SAX J1747.02853 | GX +0.2,0.2 | 0.207 | -0.238 | bolometric | Y | [8] | |
| XMMU J174716.1281048 | IGR J174642811 | 0.834 | 0.0837 | 1–30 keV | double-peaked | [9] | |
| SLX 1744299 | AX J1747.43000 | 359.296bbR.A. = , dec. = | -0.889bbR.A. = , dec. = | 25 | 3–20 keV | ? | [10] |
| SLX 1744300 | AX J1747.43003 | 359.260 | -0.911 | 2–30 keV | ? | [11] | |
| SAX J1750.82900 | AX J1750.52900 | 0.452651 | -0.948 | ccMean and standard deviation of peak flux from 7 bursts which were not affected by atmospheric attenuation | 2–26 keV | single peaks | [12] |
References. — 1. Kaaret et al. (2007), see also Brandt et al. (2005); 2. in’t Zand et al. (2002); 3. in ’t Zand et al. (1991); 4. Cocchi et al. (1999); 5. Maeda et al. (1996); 6. Lutovinov et al. (2001); 7. Sidoli et al. (1998); 8. Natalucci et al. (2000); 9. Del Santo et al. (2007); 10. Pavlinsky et al. (1994); 11. Patterson et al. (1989); 12. Natalucci et al. (1999)