Mrk 421, Mrk 501, and 1ES 1426+428 at 100 GeV with the CELESTE Cherenkov Telescope
We have measured the gamma-ray fluxes of the blazars Mrk~421 and Mrk~501 in the energy range between 50 and 350 GeV ( to Hz). The detector, called CELESTE, used first 40, then 53 heliostats of the former solar facility “Thémis” in the French Pyrenees to collect Cherenkov light generated in atmospheric particle cascades. The signal from Mrk 421 is often strong. We compare its flux with previously published multi-wavelength studies and infer that we are straddling the high energy peak of the spectral energy distribution. The signal from Mrk 501 in 2000 was weak (). We obtain an upper limit on the flux from 1ES 1426+428 of less than half that of the Crab flux near 100 GeV. The data analysis and understanding of systematic biases have improved compared to previous work, increasing the detector’s sensitivity.
Key Words.:
BL Lacertae objects: individual: Mrk 421, Mrk 501, 1ES 1426+428 – Gamma-rays: observations1 Introduction
Measurements of high energy emission from active galactic nuclei (AGN) give insights into a variety of open problems, such as the nature of the AGNs themselves, and the density and evolution of the extragalactic diffuse infrared background. After GLAST is launched in 2007 (Gehrels & Michelson (1999)), the large number of high galactic latitude GeV gamma-ray sources to be seen will make AGNs become a background for searches for new classes of emitters – insufficient understanding of high energy AGNs might just limit potential glimpses of a hidden Universe. Several AGNs of the “blazar” class emit above 250 GeV and have been detected by atmospheric Cherenkov imaging telescopes. They are called HBLs, for high energy BL Lac objects. Of these, Mrk 421 (Błażejowski et al. (2005); Piron et al. 2001a ; Aharonian et al. (2003)) and Mrk 501 (Dwek & Krennrich (2005); Djannati-Ataï et al. (1997)) are the brightest .
The Synchrotron Self Compton model (“SSC”) is consistent with much of the multiwavelength blazar data. For discussion of these models as applied to the blazars discussed in this paper, see for example (Tavecchio et al. (1998)) or (Katarzyński et al. (2001)). In its simplest variant, relativistic electrons generate synchrotron photons with a peak in the optical to X-ray range, and then up-scatter these same photons to produce the peak seen in the GeV range. The inverse Compton peak position can constrain the physical parameters of the model. Many, if not most, observed characteristics of blazars remain unexplained. Examples are the relation between variations at different wavelengths, as highlighted by the “orphan” gamma ray flares observed for 1ES1959+650 (Krawczynski et al. (2004)), and the role that proton acceleration might play. Progress requires simultaneous measurements across the spectrum.
The CELESTE telescope was one of the first instruments sensitive near the Compton peak for these blazars, beyond the energy range of the relatively large sample of EGRET blazars (Mukherjee et al. (1997); Hartman et al. (1999)). Mrk 421 was studied with EGRET, but Mrk 501 was visible only during a flare (Kataoka et al. (1999)), while 1ES 1426+428 was undetected by EGRET, although well-measured at TeV energies (e.g. Djannati-Ataï et al. (2002); Horan et al. (2002)). A key motivation for our experiment was to provide blazar measurements in an unexplored energy window.
This paper presents the first observations of three blazars below 100 GeV, by a solar heliostat array, and is structured as follows: we describe the detector, the analysis method, and the data samples. We emphasize improvements in our knowledge of the systematic uncertainties. We present light curves for the three blazars as well as the integrated fluxes, and place the results in the context of SSC models.
2 The CELESTE gamma-ray Telescope
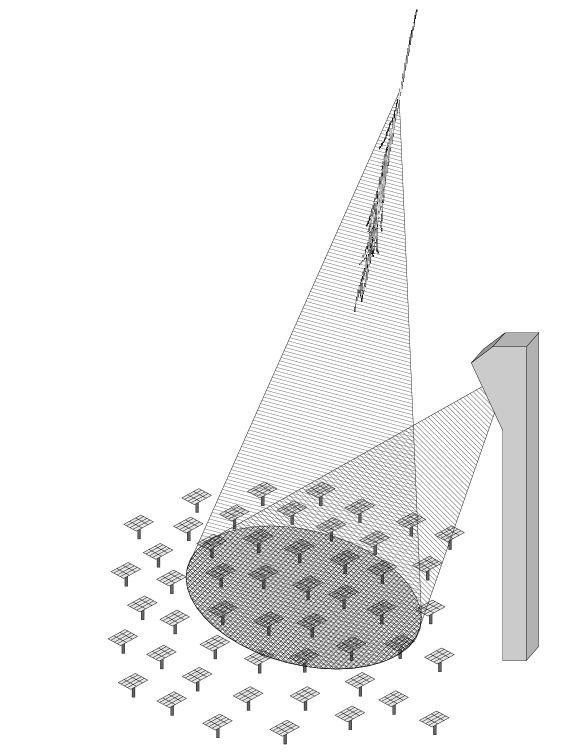
The CELESTE detector is located in the eastern French Pyrenees (N. , E. , altitude ) and described in (Giebels et al. (1998); Paré et al. (2002)) and in (de Naurois et al. (2002)). Figure 1 illustrates the principle. CELESTE was dismantled in June, 2004.
CELESTE detected the Crab nebula in 1998 using a solar heliostat array (Smith (1998)). STACEE, very similar to CELESTE, reported the flux above 190 GeV (Oser et al. (2001)), followed by the flux above 60 GeV from CELESTE (de Naurois et al. (2002)). STACEE recently measured the integral flux above 140 GeV from Mrk~421 (Boone et al. (2002)) and, assuming power law spectral indices extrapolated from higher energies, bracketed the 50 to 700 GeV differential spectrum. A review of solar tower gamma-ray telescopes can be found in (Smith (2005)). Here we recall key features of the CELESTE detector.
CELESTE used 53 heliostats (40 until 2001) of the Thémis former solar facility. The CAT Cherenkov imager ran on the same site (Piron et al. 2001a and references therein), as did the Themistocle (Baillon et al. (1993)) and ASGAT (Goret et al. (1993)) Cherenkov sampling arrays. Each heliostat has a mirror on an alt-azimuth mount. Light from the heliostats was reflected to a secondary optical system at the top of the m tower, where one photomultiplier assembly (PMT) viewed each heliostat. Heliostat control and data acquisition systems were also high in the tower.
Data acquisition was triggered when the summed PMT pulse height for at least of the groups of heliostats exceeded photoelectrons (“p.e.”) per heliostat. For the 40 heliostat array, of groups with 8 heliostats each was used most often. For the 53 heliostat array there were trigger groups of between 6 and 8 heliostats each, and the trigger multiplicity was set at or for different observations. The deadtime in the electronic delays depends on the rates, which depend on the threshold settings, which are determined in part by the choice of . We took pains to remove these biases (Manseri (2004)), in particular, with an offline group multiplicity cut based on the scaler rates. The acceptance shown in figure 5 has an offline multiplicity cut of 4 of 5, for illustration.
Each PMT signal was digitized at nanoseconds per sample, with about 3 digital counts (dc) per photoelectron. 100 samples centered around the nominal Cherenkov pulse arrival time were recorded, providing event-by-event pedestal information that we used to determine the night sky background light for each channel. A second 28 sample window contained a timing reference pulse. Scaler rates, PMT anode currents, a GPS time stamp, and some meteorological information rounded out the data record.
3 Monte Carlo Simulations
CELESTE’s first publication, on the flux from the Crab nebula quoted a GeV threshold at the trigger level, and 60 GeV after analysis (de Naurois et al. (2002)). We estimated the uncertainty on the energy scale to be less than 30 %, dominated by disagreement between predictions of Monte Carlo atmospheric cascade generators, and disagreement between estimated and observed PMT illuminations induced by bright stars. Since then we have corrected some small errors in the KASCADE Monte Carlo (Kertzman & Sembroski (1994)) and the agreement is improved ( to 10 %). The CORSIKA Monte Carlo atmospheric shower generator (Heck et al. (1998)) best reproduces our experimental observables, and we use it for the results presented here.
Cherenkov photons from the shower generator are fed into a detailed simulation of our optics and electronics, to develop our data analysis methods and cuts, as well as to calculate the energy dependent effective area . Here we describe improvements made to the detector simulation since (de Naurois et al. (2002)). The acceptances will be discussed after the analysis cuts have been explained. Simulations indicate that the trigger rate is dominated by 18 Hz of protons, with 4 Hz of helium nuclei. Photons from the Crab nebula trigger the detector at about 2% of the trigger rate.
| Source | SP | DP | SPV | All pairs | Hz | On hours |
|---|---|---|---|---|---|---|
| Mrk 421 | 61 | 44 | 28 | 133 | 20 % | 38.9 |
| Mrk 501 | 10 | 25 | – | 35 | 50 % | 10.3 |
| 1ES 1426+428 | – | – | 33 | 33 | 40 % | 8.8 |
3.1 Optical Throughput
Previously, the phototube illuminations when viewing stars were lower than predicted by the simulation. We reviewed the ray tracing programs, and found two factors that dominated the discrepancy. First, the combined heliostat and secondary mirror reflectivities are about 20 % worse than earlier measurements indicated 111We thank Professor Ladislav Rob of Charles University, Prague, and his colleagues at Compas Ltd., Turnov, Czech Republic, for the recent measurements.. Second, the simulated heliostat focussing was sharper than in reality. We compared the image sizes obtained from star “scans” used for heliostat alignment with simulated sizes, and modified the simulation to improve agreement. (In scans, we record PMT anode currents as the heliostats are pointed successively at a grid of points around the star position: see figure 7 in Paré et al. (2002)).
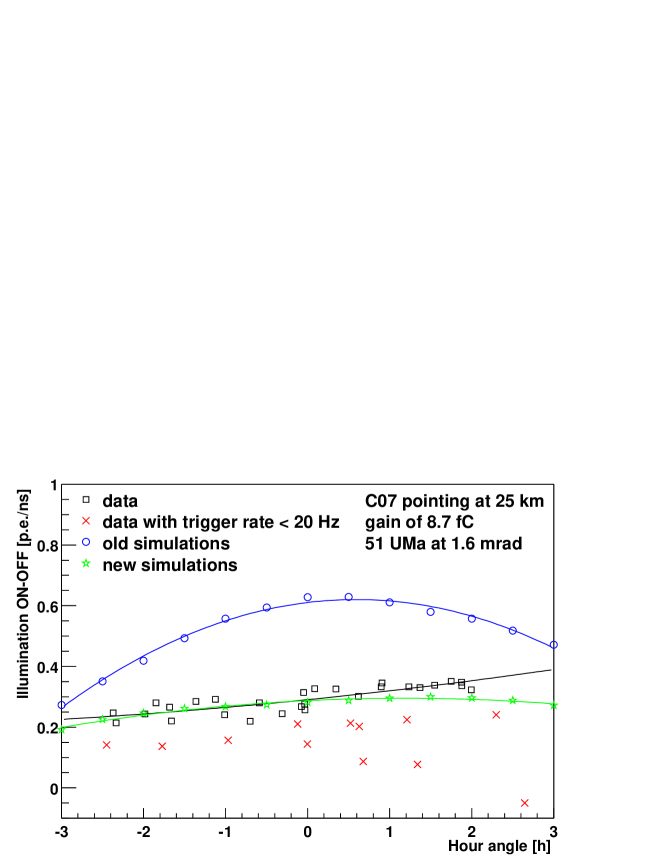
Figure 2 illustrates a consequence of the ray tracing modifications (Brion (2004)). When tracking Mrk 421, the star 51 UMa (HD 95934, blue magnitude ) falls within the mrad optical field-of-view for heliostats near the center of the array. The On-source PMT anode currents are thus larger () than the Off-source currents which are due only to the diffuse night sky light (). Using the PMT gains , the current differences yield the star-induced illuminations , in photoelectrons per second ( is the electron charge). The figure shows that measured illuminations vary with the pointing direction, but less than was predicted by the original simulation. The simulations include the stars in the On and Off fields that contribute at least 5 % as much as 51 UMa, that is, . We remark that the gamma-ray energy scale predicted by the Monte Carlo simulation shifts less than figure 2 suggests, since an atmospheric shower is a light source of angular extent comparable to the detector field-of-view, and so the effect of heliostat “defocussing” is less violent for showers than it is for the point-like stars.
A few observations constrain the uncertainty in the optical throughput. Photometry using star scans yields 20 % channel-to-channel dispersion compared to the simulated values. A census of damaged heliostat mirrors, and the phototube manufacturer’s measurements of the photocathode responses, combined together account for half of the dispersion. We attribute the rest to errors in the gains, and focussing anomalies for individual heliostats. However, what matters most is the sums over the 8 heliostats of the trigger groups: the total variation over the 5 groups is %, and the rms is less than %. We conclude that the overall effect on the gamma-ray energy scale of the uncertainty in the optical throughput is less than 10 %.
Since (de Naurois et al. (2002)), the electronics simulation has been completely re-written, leading to improved agreement between predicted and observed signals, in the trigger, and for single channels. The good agreement for the final analysis variable, described below, is the result of the care taken to model the elements of the complex electronics chain.
3.2 Atmospheric Transmission
The amount of Cherenkov light that reaches the ground varies between different sites and seasons depending mainly on the aerosol content versus altitude (Bernlöhr (2000)). The same also holds for atmospheric extinction in stellar photometry (Hayes & Latham (1975)). The effect on CELESTE is particularly striking: the Hz cosmic ray trigger rates for winter sources (e.g. Crab and Mrk 421) decrease to under 15 Hz every year in spring, affecting sources like Mrk 501 and 1ES 1426+428. Table 1 lists the fraction of the data sets above and below 15 Hz.
The CORSIKA Monte Carlo provides a choice of tabulated wavelength and altitude dependent extinction curves. The default contains some aerosols. The Palomar curve from (Hayes & Latham (1975)) used for our stellar photometry studies contains fewer aerosols, for an integrated transmission above Thémis at 400 nm 6 % greater than for the default CORSIKA curve.
An amateur telescope with filters and a CCD camera was used to measure the total integrated atmospheric transmission during some nights when the trigger rates were above 20 Hz, using the apparent brightness of several stars as a function of their zenith angles (Bouguer method), at three wavelengths (blue: 390-490 nm, green: 500-560 nm, and red: 610-660 nm). The Cherenkov light recorded by CELESTE is mainly in the blue range. The CCD results show that the sky at Thémis corresponds to the Palomar extinction curve. We made a CORSIKA extinction table corresponding to the Palomar curve which we use to simulate good running conditions.
To calculate the acceptances for data acquired with trigger rates we made another CORSIKA extinction table that we call “dusty”. We increased the aerosol contribution to the Palomar curve so that the integrated transmission above Thémis at 400 nm is 60 % less. This choice comes from two observations. The first appears in Figure 2, where the phototube illumination due to the bright star near Mrk 421 in good conditions is halved for data acquired with a low trigger rate. The second is that proton shower simulations using the nominal and “dusty” extinction tables reproduced the experimental nominal and degraded trigger rates, respectively. Figure 5, discussed below, shows the acceptance curves obtained for the two atmospheres, used to convert our gamma-ray rates to fluxes.
4 Data Samples
Maximum Cherenkov emission for 100 GeV -ray showers occurs around 11 km above the site. For CELESTE’s oldest data, the heliostats were aimed at this height in the direction of the source, to maximize Cherenkov light collection. This is called Single Pointing data (SP).
SP provides the lowest energy threshold, but also decreases the detector’s sensitive area. For one season we took data in a configuration called Double Pointing (DP), where half the heliostats point at 11 km and the rest at 25 km. This increases the area and improves cosmic ray rejection, while raising the energy threshold only slightly.
Our mrad field-of-view matches the apparent size of a gamma shower, to optimize the ratio of Cherenkov light to night sky background light. Tails of cosmic ray showers are outside the field-of-view, reducing background at the trigger level but weakening offline rejection. In 2001 we added 13 heliostats to CELESTE, and thereafter pointed 41 heliostats at the 11 km point, and the remaining 12 at a ring 150 meters around the point. The 12 “veto” heliostats can see shower tails outside the central field-of-view, enhancing cosmic ray rejection (Manseri (2004)). We call this Single Pointing with Veto data (SPV).
Ultimately the performance of the analysis was such that the veto rejection was not used. But the 12 veto heliostats around the edge of the heliostat field led us to restructure the trigger into groups. The changed trigger topology affects the shape of the recorded showers, leading to different energy dependent acceptances.
Source observations (“On”) last about 20 minutes and are followed or preceded by an observation at the same declination, offset by 20 minutes in right ascension. “Off” data gives a reference for the cosmic ray background – the signal is the difference between On and Off, after analysis cuts. However, changes in sky conditions between On and Off can cause differences having nothing to do with gamma-rays: we select stable On-Off pairs with a cut on the value obtained from a least-squares fit to a constant PMT anode current versus time, and to the trigger rate versus time, for both runs. We also rejected pairs with very low data rates , or anomalously high trigger dead times. The weather at Thémis is fickle, and we rejected over half of our data.
Table 1 lists the data sets, recorded during clear, moonless nights from December 1999 through May 2004, after data selection.
5 Data Analysis
5.1 Event reconstruction and background rejection
Since (de Naurois et al. (2002)) we have changed our analysis strategy, as described below. The Flash ADC data quality improved, as did the channel-to-channel timing offsets, which both help wavefront reconstruction. Our procedures to remove the biases induced by night sky background differences at the trigger level (“software trigger”) and in the FADC data (“padding”) have been refined. Overall sensitivity has more than doubled.
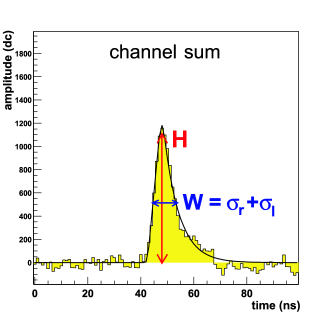
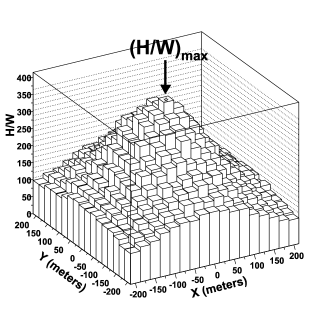
Just above the trigger threshold, the Cherenkov signal in one channel is comparable to the fluctuations of the night sky background light. Summing the channels greatly improves the signal-to-noise ratio, after correcting for the propagation delay to each heliostat, assuming a spherical Cherenkov wavefront. Lacking knowledge of the shower core position, we scan the plane at 11 km and evaluate the ratio for each point in a grid, where and are the height and the width of the summed signal (see Figure 3). The grid position giving the largest value of the ratio is a measure of the shower core position. The wavefront sphericity correlates with how much decreases 200 m away from the shower core. We measure the relative decrease with a variable called , shown in Figure 4 for an Off observation, Mrk 421 On-Off data, and for a simulation of a -ray spectrum. The Cherenkov wavefront from -ray induced showers is, on average, more spherical than for showers initiated by charged cosmic rays and, as expected, -ray showers have smaller than showers initiated by charged cosmic rays. The method and preliminary results were shown in (Bruel (2004)) and detailed in (Manseri (2004)).
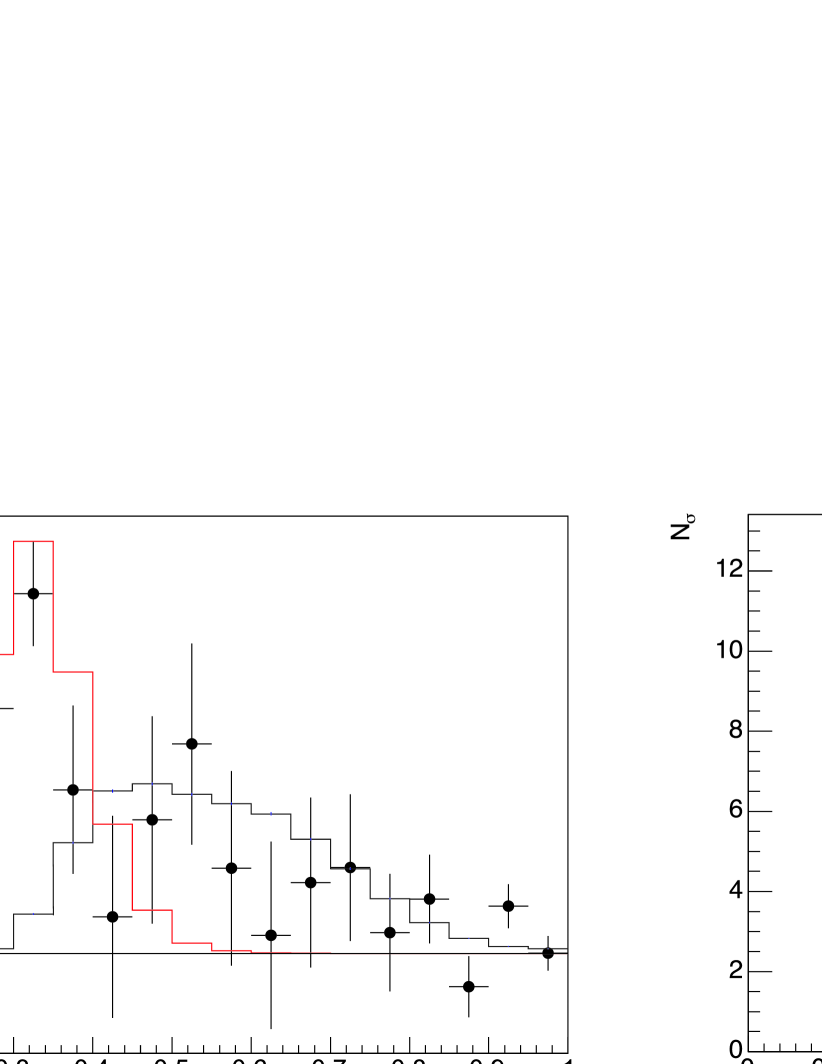
The distributions change for different heliostat pointings. This article concerns three blazars with similar declinations, all transiting near zenith at Thémis, so the only changes are the pointing configuration and the hour angle. We studied simulations and the strong signals from Mrk 421 and the Crab to explore the cuts (Brion (2005)). Statistical significance (sensitivity) is optimized by cutting a bit above the peak in the gamma ray distribution, e.g. in Figure 4. For other pointings, the peak lies between and . The acceptance depends in part on the efficiency of the cut, obtained from the Monte Carlo. This efficiency is related to the integral of the distribution, a steep function of near the peak. Thus we choose to cut beyond the peak, at , for all data sets, which increases the statistical uncertainty, but decreases the acceptance uncertainty to less than 10%, and is simpler than having an array of cut values for the various pointings.
5.2 Acceptances and Performance
For a gamma-ray source with differential spectrum the number of detected gammas will be
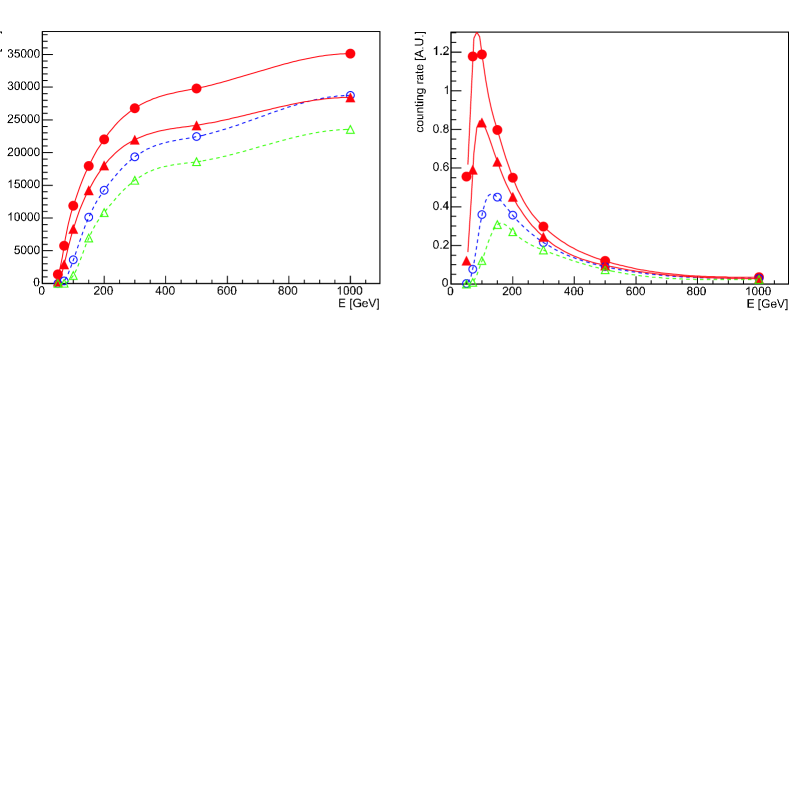
where is the On-source time and is the energy dependent gamma-ray collection area obtained from the Monte Carlo calculations. We have calculated for each heliostat configuration, and for hour angles of hours, for each of the two atmospheres described above. Figure 5 shows at the trigger level, and after cuts, for the direction of the blazar Mrk 421 (), one hour after transit. (The few degree discrepancy with the other two blazar’s declinations induces a negligible error). For the blazar spectra we assume a power law, . CELESTE’s energy range is near the SED high energy peak for the three blazars, where . We vary between and to estimate the uncertainty due to this choice. The energy reconstruction method in (Piron et al. (2003)) was used to search for a signal in energy bands in (Lavalle et al. (2006)) but was not applied here.
The combined uncertainties 20% affect the energy scale. Furthermore, along with they lead to a flux error. A remaining uncertainty comes from the varying atmospheric transmission. We make a first-order correction by grouping the data into subsets with trigger rates of and Hz (see Table 1) for use with the nominal or “dusty” acceptances, , as in Figure 5. The maximum counting rate after cuts is nearly halved with the “dusty” atmosphere. The observed extrema of the trigger rates are 12 and 24 Hz, but the distribution clusters around 14 Hz and 22 Hz. We conclude that the overall systematic flux uncertainty is %.
To summarize CELESTE’s performance: for one hour of On-source Crab data near transit, analysis using gives gamma/min over the whole data set. The significance is for SP and DP data, and for SPV. The higher sensitivity for the more recent data is due mainly to having six trigger groups instead of five, at the cost of a somewhat higher minimum energy: Table 2 shows that the SP raw data rate is 15% higher than for SPV, but that analysis cuts reject more background for SPV data (90%) than for SP data (83%). The higher sensitivity also stems in part from improvements in FADC quality, timing adjustments, and gain settings over the years. Optimized cuts increase the significances by 20 %, and more for Mrk 421 (Brion (2005)) but are not used in this paper.
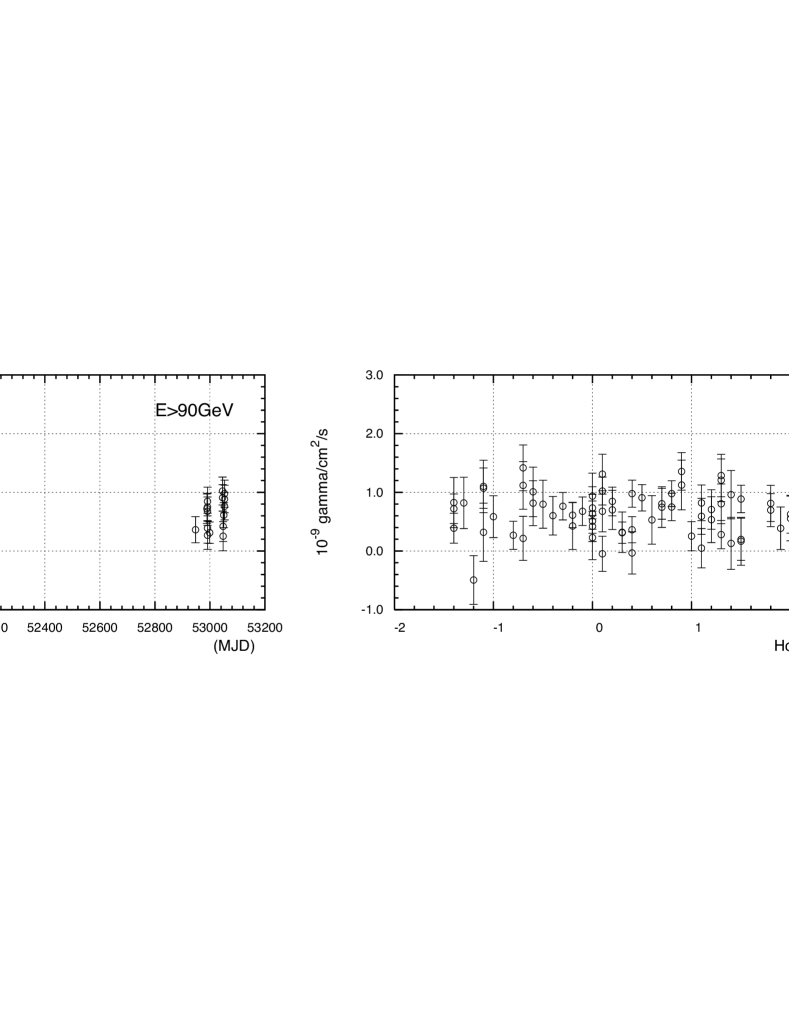
Folding our energy dependent acceptance (similar to Figure 5) with the Crab inverse Compton spectrum parametrized in Table 6 of (Aharonian et al. (2004)) yields a maximum at 90 GeV. The rate falls to 20 % of the maximum below 50 GeV and above 350 GeV. Figure 6 shows the acceptance-corrected pair-by-pair Crab fluxes, as a function of date and hour angle. The stability is adequate to search for blazar variability. The power flux at 90 GeV is erg cm-2 s-1, higher than our previous result in (de Naurois et al. (2002)) but within the uncertainties, and in agreement with the spectrum in (Aharonian et al. (2004)).
6 Results and Discussion
Tables 2, 4, and 5 summarize the data analysis results for the three blazars Mrk 421, Mrk 501, and 1ES 1426+428, respectively. Figures 7, 8, and 9, show the acceptance-corrected light curves for the blazar Mrk 421 during the years 2000, 2001, and 2004 seasons. Figures 12 and 14 show the light curves for Mrk 501 and 1ES 1426+428, respectively. The curves assume power laws with spectral index . There is an often strong signal from Mrk 421, and no signal for 1ES 1426+428. The excess in the Mrk 501 data is discussed below.
| Number of events | Significance | Signal-to-noise | Excess | ||||
|---|---|---|---|---|---|---|---|
| Data set | Cut | ||||||
| SP () | Raw Data | ||||||
| Software trigger | |||||||
| All cuts | |||||||
| DP () | Raw Data | ||||||
| Software trigger | |||||||
| All cuts | |||||||
| SPV () | Raw Data | ||||||
| Software trigger | |||||||
| All cuts | |||||||
| All data () | Raw data | ||||||
| Software trigger | |||||||
| All cuts | |||||||

| Epoch | ASM (a) | PCA | CAT (d) | HEGRA (e) | VERITAS (f) | CELESTE (g) |
|---|---|---|---|---|---|---|
| 2000 Feb 4 | ||||||
| (51577.99 to 51578.18) | ||||||
| 2000 Feb 10 | (b) | |||||
| (51583.99 to 51584.18) | ||||||
| (1) 2000 Feb 27 to March 12 | ||||||
| (51601.96 to 51615.09) | ||||||
| (2) 2001 Feb (4 nights) | ||||||
| (51956.98 to 51963.11) | ||||||
| 2001 April 14 to 17 | ||||||
| (52012.90 to 52015.97) | ||||||
| (3) 2003 Feb to April | (c) | |||||
| (52667.12 to 52762.94) | ||||||
| (4) 2004 Feb 15 to 18 | (c) | |||||
| (53050.05 to 53053.08) | ||||||
| (5) 2004 March 16 to 18 | (c) | |||||
| (53079.91 to 53082.02) |


6.1 Mrk 421
Understanding blazars requires observations at different wavelengths, preferably simultaneous given their variability. Happily, much of our data coincides with previously published results. Table 3 lists the CELESTE, TeV, and X-ray fluxes for the epochs with CELESTE data. CELESTE’s richest data taking period was March 2000, with 11 of 14 consecutive nights (epoch (1), from 2000 February 27 to March 12, MJD 51601.96 to 51615.09). Figure 7 shows the daily averaged data during this period. CAT (Piron et al. 2001a ) and HEGRA (Aharonian et al. (2002)) have data for most of the same nights, and the four experiments with data at this epoch are all at a low level. The CELESTE flux averaged over the 2003 season, epoch (3), from February through April (MJD 52667.12 to 52762.94) was at an intermediate level, as were the other experiments. Overall, the flux variations observed with CELESTE track the other measurements.
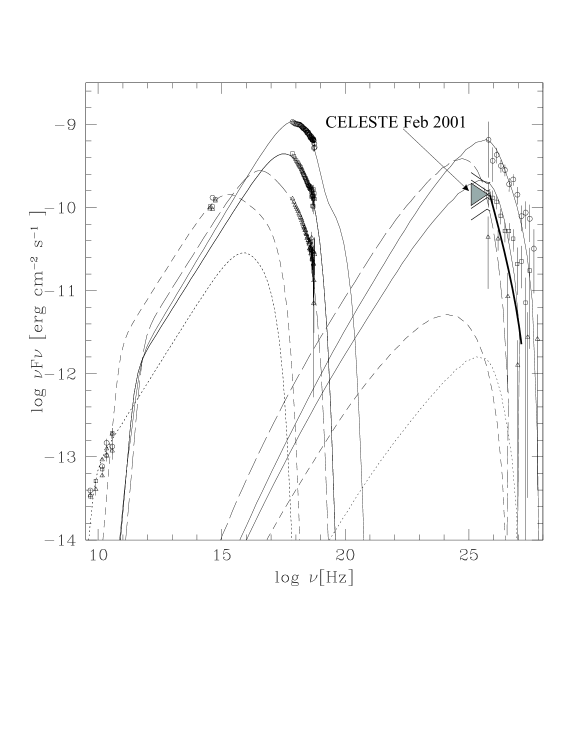
Figure 10 shows the SED for Mrk 421 taken from (Błażejowski et al. (2005)) to which we have added our result for epoch (2) when TeV data from Cherenkov imagers are available, 4 nights in February 2001 (MJD 51956.98 to 51963.11). ASM indicates that the blazar was at the low end of the “medium” X-ray state as defined in (Błażejowski et al. (2005)). We have plotted the CAT spectrum for the year 2000 (Piron et al. 2001a ), which has the same integral flux as measured on those four nights.
We now look more closely at the light curves. The detailed multi-wavelength study reported in (Błażejowski et al. (2005)) makes February-March 2004 particularly interesting (epoch 4). CELESTE measured a steady high state of cm-2s-1 for the three nights of 2004 February 15 to 18 (MJD 53050.05 to 53053.08, see Table 3 and Figure 9). VERITAS shows a steady low state, in seeming contrast to CELESTE. But Figure 1 of (Błażejowski et al. (2005)) shows an increasing optical flux on those dates, while PCA and ASM on RXTE show a decreasing X-ray state. This could be a shift of the low energy peak of the SED to lower energy. If the high energy SED peak also shifts during this epoch it could explain that CELESTE sees a high rate when VERITAS does not: VERITAS is above the SED peak while the CELESTE range straddles it.
Similarly, and also in Figure 9, PCA and ASM show a declining X-ray state followed by a small rebound for 2004 March 16 to 18 (epoch 5). For two nights of data (MJD 53079.91 to 53082.02) CELESTE has an average state of cm-2s-1, but here VERITAS sees the decline of the flare before returning to the low state. CELESTE’s stability during VERITAS’ changes is again consistent with Figure 10, that is, with an SED peak at 100 GeV. Recent spectral work on Mrk 421 by STACEE also seems to indicate that our 50 to 350 GeV energy range matches a high energy SED peak (Carson (2005)).
| Number of events | Significance | Excess | ||||
|---|---|---|---|---|---|---|
| Data set | Cut | |||||
| Year 2000 () | Raw data | |||||
| Software trigger | ||||||
| All cuts | ||||||
| Year 2001 () | Raw data | |||||
| Software trigger | ||||||
| All cuts | ||||||
| All data () | Raw data | |||||
| Software trigger | ||||||
| All cuts | ||||||
6.2 Mrk 501
The statistical significance of the excess for all the Mrk 501 data is weak (), as shown in Table 4. The same cut as for Mrk 421 was applied. The light curve in Figure 12 shows that the excess comes mostly from the year 2000, with for those four months. Figure 11 shows that the excess in 2000 ressembles a gamma-ray signal. However, changing the cut values to those that optimize the statistical significance of the Mrk 421 signal do not enhance this excess, suggesting that taking the excess to be a gamma-ray signal is delicate.
CELESTE and the BeppoSAX X-ray satellite have data in common for four nights, from 2000 March 5 to 12, when Beppo measured between and (Massaro et al. (2004)). The ASM rate during this period is a roughly constant . (ASM rates are unreliable at such low fluxes.) Averaging the ASM count rates for the nights with CELESTE data gives and for 2000 and 2001, respectively. The dispersion of the points is cts/s for both seasons. Averaging ASM over longer periods gives essentially the same result, so that no significant difference in X-ray activity for the two years is apparent.
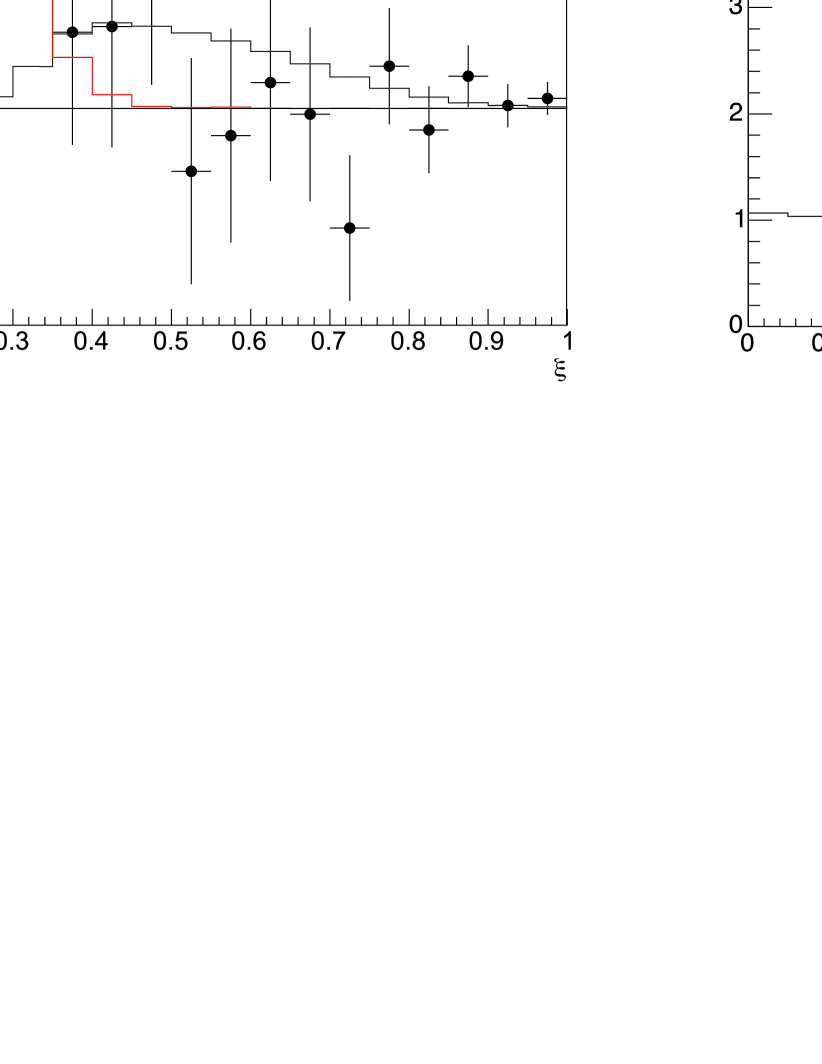
Figure 6 shows that our experiment was stable. We choose to interpret the excess as due to gamma-rays from this well-known emitter. We use the same acceptances as for Mrk 421, again matched to the conditions of each data run. The flux at 110 GeV thus obtained for the year 2000 is (Statistical errors only). Combining both years decreases the result by less than . Figure 13 shows the flux superimposed on an SED taken from (Kataoka et al. (1999)). The ASCA X-ray and EGRET gamma ray data were simultaneous with each other. We have added the BeppoSAX X-ray data taken at the same time as CELESTE’s. The TeV spectrum for the 1998 season from the CAT Cherenkov imager corresponds to a quiet X-ray period (Piron et al. 2001b ), with an average of ASM counts per second, close to the year 2000 rate, and no significant flares.


6.3 1ES 1426+428
Table 5 and the light curve in Figure 14 show that CELESTE detected no gamma-rays from 1ES 1426+428, indicating that the upper flux limit at 80 GeV is . The average ASM X-ray flux during CELESTE’s observations was counts per second. For the two seasons leading to the detection of this blazar with the Whipple telescope the ASM rate ranged from to , with an average near , with no discernible correlation between the weak X-ray and TeV signals (Horan et al. (2002)).
Prior to the recent HESS result in (Aharonian et al. (2006)), 1ES 1426+428 was the most distant blazar used to constrain the density of extragalactic diffuse infrared light, possible because TeV photons can be absorbed by low energy photons via electron-positron pair production, . In particular, (Dwek & Krennrich (2005)) took the spectra observed at high energies and, for a range of plausible assumptions about infrared spectral shapes and densities, removed absorption effects. Extrapolations of the de-absorbed spectra to 100 GeV suggested fluxes detectable by CELESTE. In the end, our non-detection during a low X-ray state does not constrain the diffuse infrared densities.
| Number of events | Significance | ||||
|---|---|---|---|---|---|
| Data set | Cut | ||||
| All data (SPV, ) | Raw data | ||||
| Software trigger | |||||
| All cuts | |||||
7 Conclusions
We have provided some of the first astrophysical flux measurements around 100 GeV, beyond the reach of EGRET on the Compton CGRO and below the range of previous ground-based telescopes, by recording atmospheric Cherenkov light with the reconverted solar tower facility at Thémis. We have increased our detector sensitivity as compared to our earlier work, to a level near that predicted in our original proposal. The gain came mainly from a better analysis procedure but also from refinements in our detector simulation and electronics improvements. 80 % of the gamma-rays we detect have energies between 50 and 350 GeV. Bad weather at our site lead to a low duty-cycle, resulting in a modest number of detections in spite of our detector’s good performance.
Our results for the blazar Mrk 421 help constrain the shape of the high energy peak of the spectral energy distribution. We have made the first detection of Mrk 501 in this range, although the detection is weak, and we have placed an upper limit on the flux from the distant blazar 1ES 1426+428 during a period of X-ray inactivity.

Acknowledgements.
This work was supported by the IN2P3 of the French National Center for Scientific Research (CNRS) and by the Région Languedoc-Roussillon. We are grateful for the cooperation of Electricité de France. Antoine Perez, Jacques Maurand, and Stéphane Rivoire kept the Thémis facility operational through hard work and dedication. We thank Wei Cui, Jun Kataoka, and Dieter Horns for providing us with data files and macros.References
- Aharonian et al. (2002) Aharonian, F.A. et al., A&A 393, 89-90 (2002)
- Aharonian et al. (2003) Aharonian, F.A. et al., A&A 410, 813-821 (2003)
- Aharonian et al. (2006) Aharonian, F.A. et al., Nature 440, 1018 (2006)
- Aharonian et al. (2004) Aharonian, F.A. et al., ApJ 614, 897-913 (2004)
- (5) ASM (All Sky Monitor) quick-look results are provided by the ASM/RXTE team, http://xte.mit.edu/ASM_lc.html
- Baillon et al. (1993) Baillon, P. et al., Astropart. Phys. 1, 341-355 (1993)
- Bernlöhr (2000) Bernlöhr, K., Astropart. Phys. 12, 255-268 (2000)
- Błażejowski et al. (2005) Błażejowski, M. et al., ApJ 630, 130-141 (2005)
- Brion (2004) Brion, E. et al, proc. COSPAR, Paris (2004).
- Brion (2005) Brion, E., doctoral thesis (2005), http://doc.in2p3.fr/themis/CELESTE/PUB/papers.html
- Bruel (2004) Bruel, P., proc. “Physics & Astrophysics in Space”, Frascati (2004)
- Boone et al. (2002) Boone et al., ApJL 579, 5-8 (2002)
- Carson (2005) Carson, J., doctoral thesis, http://www.astro.ucla.edu/~carson (2005), ApJ in preparation
- Djannati-Ataï et al. (1997) Djannati-Ataï, A. et al., A&A 350, 17-23 (1997)
- Djannati-Ataï et al. (2002) Djannati-Ataï, A. et al., A&A 391, L25-L28 (2002)
- Dwek & Krennrich (2005) Dwek, E. & Krennrich, F., ApJ 618, 657-674 (2005)
- Gehrels & Michelson (1999) Gehrels, N. and Michelson, P., Astropart. Phys. 11, 277-282 (1999)
- Giebels et al. (1998) Giebels, B. et al., Nucl. Instr. Meth. A 412, 329-341 (1998)
- Goret et al. (1993) Goret, P. et al., A&A 270, 401-406 (1993)
- Hartman et al. (1999) Hartman, R.C. et al., ApJS 123, 79-202 (1999)
- Hayes & Latham (1975) Hayes, D. S. and Latham, D. W., ApJ 197, 593-601 (1975)
- Heck et al. (1998) Heck, D. et al., Report FZKAS 6019, Forschungszentrum Karlsruhe (1998)
- Holder et al. (2001) Holder, J. et al., 27th ICRC, Hamburg (2001)
- Horan et al. (2002) Horan, D. et al., ApJ 571, 753-762 (2002)
- Kataoka et al. (1999) Kataoka, J. et al., ApJ 514, 138-147 (1999)
- Katarzyński et al. (2001) Katarzyński, K., Sol, H. and Kus, A., A&A 367, 809-825 (2001)
- Kertzman & Sembroski (1994) Kertzman, M. P. and Sembroski, G. H., Nucl. Instrum. Methods A 343, 629-643 (1994)
- Krawczynski et al. (2001) Krawczynski et al., ApJ 559, 187-195 (2001)
- Krawczynski et al. (2004) Krawczynski et al., ApJ 601, 151-164 (2004)
- Lavalle et al. (2006) Lavalle, J., Manseri, H., et al., A&A 450 1-8 (2006)
- Manseri (2004) Manseri, H., doctoral thesis (2004), http://doc.in2p3.fr/themis/CELESTE/PUB/papers.html
- Massaro et al. (2004) Massaro, E. et al., A&A 422, 103-111 (2004)
- Mukherjee et al. (1997) Mukherjee, R. et al., ApJ 490, 116 (1997)
- de Naurois et al. (2002) de Naurois, M., Holder, J. et al., ApJ 566, 343-357 (2002)
- Oser et al. (2001) Oser, S. et al., ApJ 547, 949-958 (2001)
- (36) Piron, F. et al., A&A 374, 895-906 (2001a)
- (37) Piron, F. in proc. SF2A-Lyon astro-ph/0109286 (2001b)
- Piron et al. (2003) Piron, F. et al., 28th ICRC, Universal Academy Press, vol. 5 p.2607 OG 2.3 (Tsukuba 2003)
- Paré et al. (2002) Paré, E. et al., Nucl. Instr. Meth. A 490, 71-89 (2002)
- Smith (1998) Smith, D. A., proc. 19th Texas Symposium on Ultrarelativistic Astrophysics, Paris (1998)
- Smith (2005) Smith, D. A., proc. “Atmospheric Cherenkov Detectors VII”, Palaiseau (2005)
- Tavecchio et al. (1998) Tavecchio, F., Maraschi, L. and Ghisellini, G., ApJ 509, 608-619 (1998)