The Fundamental Plane in RX J0142.0+2131: a galaxy cluster merger at
Abstract
We present the Fundamental Plane (FP) in the cluster of galaxies RX J0142.0+2131. There is no evidence for a difference in the slope of the FP when compared with the Coma cluster, although the internal scatter is larger. On average, stellar populations in RX J0142.0+2131 have rest-frame -band mass-to-light ratios () dex lower than in Coma. This is significantly lower than expected for a passively-evolving cluster formed at . Lenticular galaxies have lower average and a distribution of with larger scatter than ellipticals. Lower mass-to-light ratios are not due to recent star formation: our previous spectroscopic observations of RX J0142.0+2131 E/S0 galaxies showed no evidence for significant star-formation within the past Gyr. However, cluster members have enhanced -element abundance ratios, which may act to decrease . The increased scatter in the RX J0142.0+2131 FP reflects a large scatter in implying that galaxies have undergone bursts of star formation over a range of epochs. The seven easternmost cluster galaxies, including the second brightest member, have consistent with passive evolution and . We speculate that RX J0142.0+2131 is a cluster–cluster merger where the galaxies to the east are yet to fall into the main cluster body or have not experienced star formation as a result of the merger.
Subject headings:
galaxies: clusters: individual: RX J0142.0+2131 – galaxies: evolution – galaxies: stellar content1. Introduction
The Fundamental Plane (FP) of elliptical (E) and lenticular (S0) galaxies is a log-linear relation between effective radius, surface brightness, and velocity dispersion (e.g. Djorgovski & Davis 1987; Dressler et al. 1987; Jørgensen et al. 1996, hereafter JFK1996). Its ubiquity in nearby clusters of galaxies has been noted by many investigators (e.g. Bender et al. 1992; JFK1996; Colless et al. 2001). Coefficients in the observed FP differ from those predicted by the virial theorem, and this ‘tilt’ implies that mass-to-light ratio () is not a constant for E/S0s but depends to some extent on galaxy properties (see Cappellari et al. 2006). The FP must confront studies showing that the growth of galaxies in clusters involves complex processes like galaxy mergers, cluster mergers, and AGN activity (e.g. Fabian et al. 2000; Tran et al. 2005).
If E/S0 galaxies form in a short burst and their stellar populations subsequently evolve passively, one would expect a gradual decrease in with cosmic epoch. This induces an offset in the FP as a function of redshift, with no change in slope. However, the tendency of star formation to occur over a longer period in lower-mass galaxies (e.g. Juneau et al. 2005; Treu et al. 2005), would be manifest as a steepening of the empirical FP with redshift. Evidence for changes in the slope of the FP are seen in the latest studies of the FP at (e.g. Holden et al. 2005; Jørgensen et al. 2006), but this has not been observed at (e.g. van Dokkum & Franx 1996; Kelson et al. 2000; Wuyts et al. 2004), most likely because these studies do not probe far enough down the mass function. The internal scatter of the FP reported at is consistent with that of the Coma cluster (JFK1996). Since scatter in the FP is a reflection of the variation in , this is taken as evidence that cluster E/S0s at a given mass are coeval.
In this letter we examine the FP in RX J0142.0+2131, a cluster of galaxies at for differences in slope and internal scatter with respect to that of Coma. We use km s-1 Mpc-1, , , and convert previous work to these values where necessary. The look-back time to RX J0142.0+2131 in this cosmology is 3.2 Gyr.
2. RX J0142.0+2131: Previous observations
We presented high–signal-to-noise GMOS-N spectroscopy of 43 spectroscopic targets in the field of RX J0142.0+2131 in Barr et al. (2005; hereafter BDJBC). Velocity dispersions and line indices for 30 cluster members were derived. We determined that scaling relations between metal indices and velocity dispersion, and the strengths of the 4000Å break, are inconsistent with a scenario in which stellar populations form at and evolve passively to look like cluster galaxies at low redshift (i.e. without additional star formation and/or merging). Stellar populations in RX J0142.0+2131 have -element abundance ratios () which are enhanced by, on average, over Coma galaxies. Luminosity-weighted mean ages for galaxies in RX J0142.0+2131 are similar to those in Coma, i.e. older than would be expected at . The cluster velocity dispersion is much larger than its X-ray luminosity or richness suggest. Despite this, no sign of substructure was found by testing the distribution of spectroscopically-confirmed cluster members in RA,dec, space.
3. Data reduction and analysis
The data reduction and analysis method for the GMOS-N spectroscopy was presented in BDJBC. In this letter we restrict the surface photometry calculations to spectroscopically-confirmed cluster members. We will present effective radii, mean surface brightnesses and morphological classifications for a larger sample at a later date.
RX J0142.0+2131 was observed with the Hubble Space Telescope Advanced Camera for Surveys (ACS) on UT 2003 November 01 and 2004 July 03. Two positions were imaged in the F775W band for 4420s each. Reductions are performed with the PyRAF task MULTIDRIZZLE using the standard procedure. ACS surface photometry is analysed using the two-dimensional fitting program GALFIT Peng et al. (2002). We fit galaxies’ luminosity profiles as as profiles. Background or companion galaxies may influence the derived parameters, so these are fit simultaneously as Sérsic profiles Sérsic (1968). We also classify galaxies by Hubble type using a method analogous to that of Smail et al. (1997). Magnitudes and surface brightnesses are corrected to rest-frame using F775W magnitudes and GMOS colors in a similar way as used in BDJBC. A complete description of our data, reduction techniques, analysis of potential systematics as well as our method of deriving surface-brightness parameters from the GALFIT fitting program will be presented in a future paper (Chiboucas et al., in preparation). Twenty-eight spectroscopically-confirmed cluster members were covered by the two ACS fields. Of these 11 are E, 12 are S0 and the remaining 5 are spirals, irregulars, mergers, or not classifiable.
We estimate the systematic and random errors in the values returned by GALFIT using Monte Carlo simulations. Artificial galaxies are generated with GALFIT and with the IRAF routine ARTDATA/MKOBJECTS. These objects cover the full range of parameter space in magnitude, , axis ratio,and position angle of the RX J0142.0+2131 sample. The Sérsic index is varied randomly between 2.5 and 5 and we adjust the diskiness/boxiness of each artificial galaxy. Noise is then added to the artificial galaxies which are placed randomly in the ACS images and recovered as profiles.
The results of the simulations indicate that derived for the profile is systematically greater than the simulated value by 0.06 dex. The quantity, , which enters the FP and referred to hereafter as the Fundamental Plane Parameter (FPP), is known to be much less sensitive to the imposition of the -law fit (e.g. Lucey 1997). The derived FPP is systematically offset from its simulated value by , with a standard deviation of . The magnitude of the deviation is not a function of the FPP. We do not make corrections to the surface photometry but quantify the total uncertainty on the FPP as .
4. The comparison sample
Our comparison sample consists of 116 E/S0 galaxies in the Coma cluster; velocity dispersions are from Jørgensen (1999). We use Gunn surface photometry of E/S0 galaxies fit using an law from Jørgensen et al. (1995), as well as new and photometry obtained with the McDonald Observatory 0.8m telescope. We transform from Gunn to the rest-frame using Jørgensen (1994), derived for E/S0 galaxies using Bruzual & Charlot (2003) models, a median Coma red-sequence color of , and where the -correction, , is derived from Bruzual & Charlot (2003) models. The surface brightness parameter in the -band FP is .
We recalculate the FP for the Coma cluster by minimising the absolute residuals in perpendicular to the plane, following JFK1996. Three emission-line galaxies are excluded from the fit. We find
with an rms of 0.08 in .
5. The Fundamental Plane in RX J0142.0+2131
We fit the FP to E/S0 galaxies in RX J0142.0+2131 in the same way as for the Coma cluster. Emission-line galaxies identified in BDJBC are excluded. The FP is
with an rms of in .
Selection effects can be crucial when comparing two samples at varying epochs. As a test we recalculate the FP in Coma and RX J0142.0+2131 for the subsamples with and M⊙. There are no significant differences in the coefficients of or , or rms between either the low- or high-redshift sample and its parent sample.
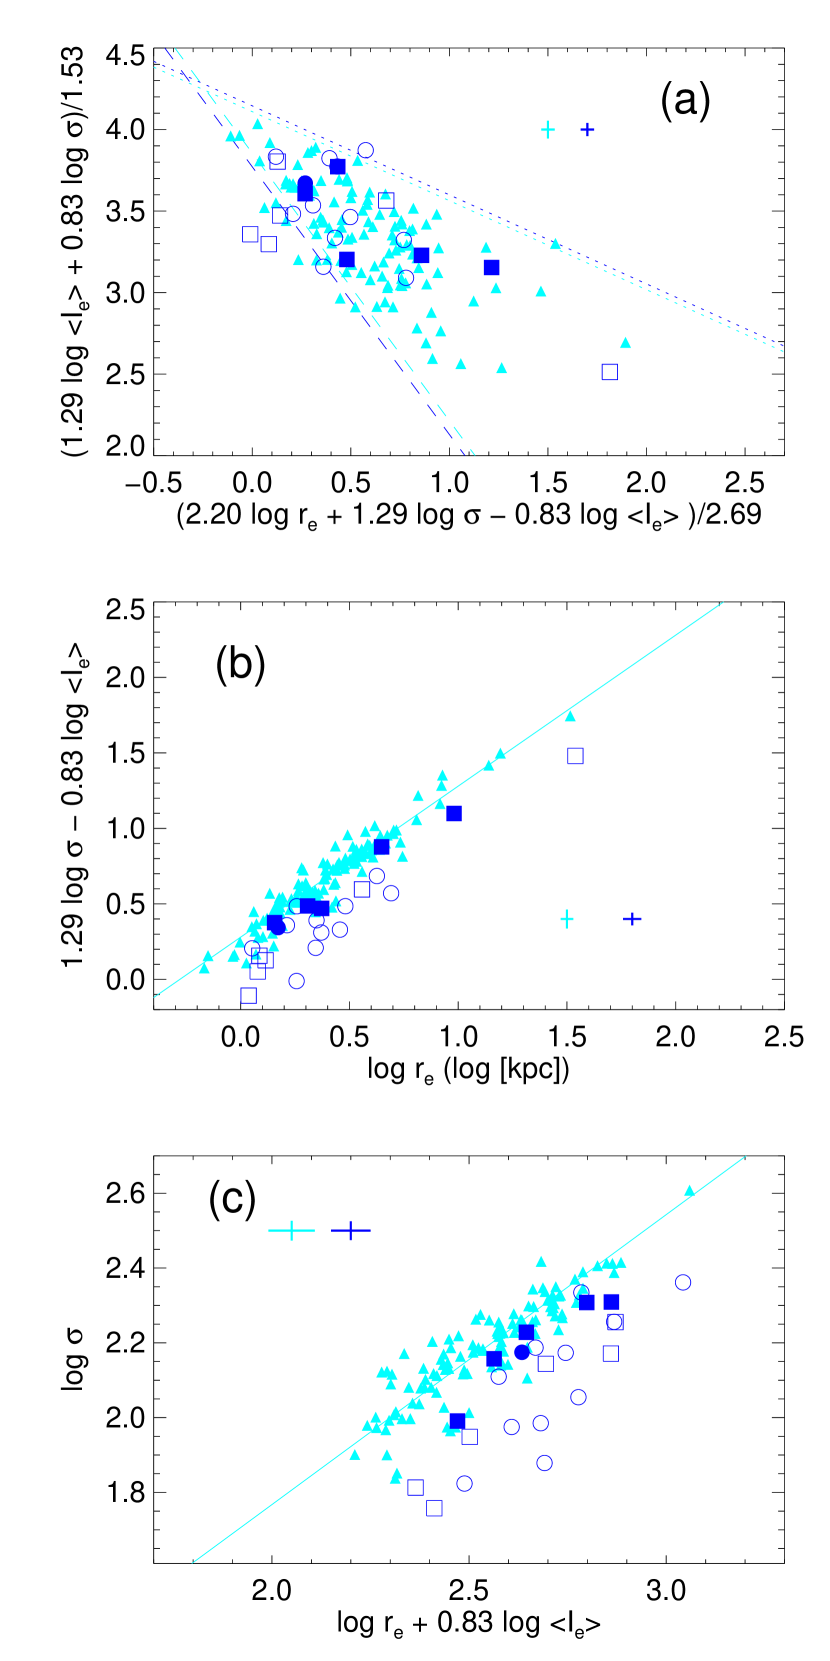
In order to assess the significance of any difference in slope between the Coma FP and that of RX J0142.0+2131, we make random realisations of a high- cluster. Twenty-three galaxies are taken from the Coma cluster and scattered so that the rms in is equal to that in RX J0142.0+2131. We then fit the FP as described above. Values of the coefficients in the FP are consistent with Coma of the time, and consistent with RX J0142.0+2131 of the time. We conclude, therefore, that there is no strong evidence for a difference in the slope of the FP for RX J0142.0+2131 when compared with Coma. The galaxies from RX J0142.0+2131 are plotted on the Coma cluster FP in Figure 1.
Even with the imposition of the same mass cutoff at M⊙, the internal scatter of the points from the FP remains higher for RX J0142.0+2131 than it is for Coma (it actually increases to 0.13 in for RX J0142.0+2131 as opposed to 0.08 in Coma). This phenomenon is not seen in previous studies of the FP in clusters at similar redshift (e.g. Kelson et al. 2000; Fritz et al. 2005). The scatter in the FP reflects the variation of within stellar populations, and a high scatter could imply that there are two or more groups of galaxies with different mean values of . In Figure 1 we separate galaxies according to E or S0 classification; the scatter for S0s is higher, 0.12 in compared with 0.10 for Es. We also plot cluster members east of 01h42m06s including the second brightest member as filled boxes; open boxes are galaxies in the main body of the cluster. The internal scatter is 0.05 and 0.12 in for the filled points and open points respectively.
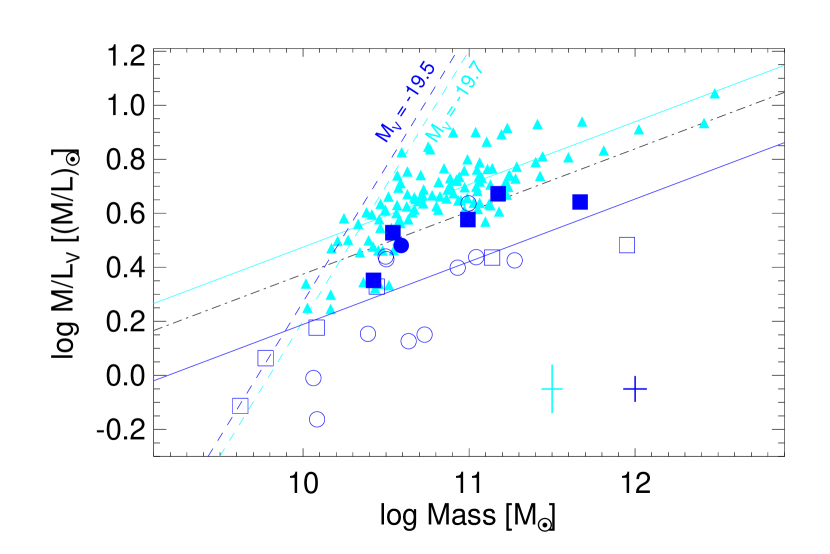
Observables are converted to mass and via, , and , where for in km s-1, in kpc, and in L⊙pc-2, . Figure 2 shows vs. .
We determine the slope of the vs. diagram for Coma and the complete RX J0142.0+2131 sample by minimising absolute residuals perpendicular to the slope. The slopes are consistent, though the uncertainty for RX J0142.0+2131 is large. We therefore calculate the offset in ratio for RX J0142.0+2131 by preserving the Coma slope and calculating the median offset of the RX J0142.0+2131 galaxies. This is dex in for the whole sample. Lenticular galaxies have lower average than ellipticals (0.06 dex), and their scatter in is 0.18 dex as opposed to 0.14 dex. The offset predicted by the single-stellar population (SSP) models of Maraston (2005) with passive evolution and is , shown as the dot-dashed line on Figure 2. If the differences in mass-to-light ratio are caused by different luminosity-weighted mean ages of stellar populations, then the Maraston models suggest that galaxies in RX J0142.0+2131 incurred a major star-formation episode at , making them only Gyr old. This is highly unlikely given the spectroscopic evidence for old stellar populations presented in BDJBC.
6. The history of E/S0 galaxies in RX J0142.0+2131
The internal scatter of the RX J0142.0+2131 FP is larger than that of Coma. This suggests that galaxies in RX J0142.0+2131 have undergone bursts of star formation over a range in epochs. The fact that the S0 galaxies have lower and larger scatter is consistent with results suggesting they form stars at lower redshift, or are more recent additions to clusters (e.g. Treu et al. 2003; McIntosh et al. 2004).
The eastern galaxies have consistent with passively-evolving stellar populations formed at , and their internal scatter is consistent with the Coma FP. They also have a lower fraction of S0s, 1 of 6 rather than 11 of 17. This can be explained if the western galaxies have undergone star formation at a more recent epoch than , while the eastern galaxies have yet to interact with the ICM, or have not undergone a burst of star formation during their incorporation into the cluster.
In BDJBC we found no evidence for recent star-formation in any cluster E/S0s and no spatial segregation of age-sensitive absorption-line diagnostics. Indeed, we found stellar populations with similar luminosity-weighted mean ages as those in the Coma cluster. This is inconsistent with ages derived from our measured via the Maraston models. A complication is introduced by which we found to be enhanced by in RX J0142.0+2131 galaxies and could have a systematic effect on . If this were the case our data indicate that enhanced decreases . It has been suggested that an enhancement of -elements will increase the blue luminosity of a stellar population Salasnich et al. (2000); Thomas et al. (2003), and preliminary models from Maraston (private comm.) predict is up to higher for young galaxies with solar metallicity and . Qualitatively, therefore, the models and data act in the same sense. We might expect to see this effect as a correlation in residuals from the and the relations. No correlation is seen in either Coma or RX J0142.0+2131 galaxies. However, the errors on derived in BDJBC are relatively large ( of the dynamic range), and the effect of age, metallicity, and internal scatter on are not clear. A more thorough analysis using a larger data set will be required to decouple the effects of these quantities on mass-to-light ratio.
We speculate that the systematically lower in RX J0142.0+2131 is due to a cluster–cluster merger which must have occurred at . Rapid star formation episodes serve to increase and so decrease further. Individual galaxies interact with the cluster at different epochs which introduces a large scatter in the FP. The imprint of such an interaction should still be clearly visible in the large-scale distribution of gas or galaxies. A more detailed picture can be painted with high-resolution X-ray imaging or multi-object spectroscopy of s of galaxies in RX J0142.0+2131.
If it is challenging to explain the history of stellar populations in RX J0142.0+2131, then it is near impossible to imagine an evolutionary path from their position at to the Coma cluster. The ratios can be decreased if there is a significant amount of merging between the bright E/S0s and galaxies which have formed their stars over longer periods. Such mergers would have to occur in the 3 Gyr available without any star formation to avoid decreasing the further.
7. Conclusions
We have established the FP for E/S0 galaxies in RX J0142.0+2131. There is no evidence that the slope of this FP is different from that of the Coma cluster. On average, for galaxies in RX J0142.0+2131 is dex lower than in the Coma cluster.
The internal scatter of the FP in RX J0142.0+2131 is larger than for Coma. This can also be visualised as a larger scatter in mass-to-light ratio for galaxies in RX J0142.0+2131. Lenticular galaxies have lower average with a larger scatter than Es. Spectroscopically-confirmed members east of 01h42m06s, including the second brightest cluster galaxy, have ratios consistent with passively-evolving galaxies formed at and an internal scatter consistent with the Coma FP.
The large scatter in the FP can be explained by spatially-segregated galaxies with different average , consistent with galaxies in RX J0142.0+2131 having undergone bursts of star formation over a range in epochs. This effect is not evident when looking at age-sensitive absorption line indices. However, galaxies in RX J0142.0+2131 have enhanced which might serve to push any putative star formation episode to higher redshift. If this were the case our data suggest that increased acts to reduce . Improved modeling of the effect of age and on is required before more accurate statements about star-formation epochs can be made.
We speculate that the large scatter in galaxies’ is caused by a cluster–cluster merger. This scenario is consistent with the large cluster velocity dispersion and implies that gaseous or galactic substructure should be detectable with X-ray imaging or spectroscopy of hundreds of cluster galaxies.
References
- Barr et al. (2005) Barr, J. M., Davies, R. L., Jørgensen, I., Bergmann, M., Crampton, D. 2005, AJ, 130, 445 (BDJBC)
- Bender et al. (1992) Bender, R., Burstein, D., Faber., S. M. 1992, ApJ, 399, 462
- Bruzual & Charlot (2003) Bruzual, G., & Charlot, S. 2003, MNRAS, 344, 1000
- Cappellari et al. (2006) Cappellari, M. et al. 2006, MNRAS, 366, 1126
- Colless et al. (2001) Colless, M., Saglia, R. P., Burstein, D., Davies, R. L., McMahan, R. K., & Wegner, G. 2001, MNRAS, 321, 277
- Djorgovski & Davis (1987) Djorgovski, S. & Davis, M. 1987, ApJ, 313, 59
- Dressler et al. (1987) Dressler, A., Lynden-Bell, D., Burstein, D., Davies, R. L., Faber, S. M.,Terlevich, R., & Wegner, G. 1987, ApJ, 313, 42
- Fabian et al. (2000) Fabian, A. C., et al. 2000, MNRAS, 318, L65
- Fritz et al. (2005) Fritz, A., Ziegler, B. L., Bower, R. G., Smail, I., & Davies, R. L. 2005, MNRAS, 358, 233
- Holden et al. (2005) Holden, B. P., et al. 2005, ApJ, 620, L83
- Jørgensen (1994) Jørgensen, I. 1994, PASP, 106, 967
- Jørgensen (1999) Jørgensen, I. 1999, MNRAS, 306, 607
- Jørgensen et al. (1995) Jørgensen, I., Franx, M., & Kjærgaard, P. 1995, MNRAS, 273, 1097
- Jørgensen et al. (1996) Jørgensen, I., Franx, M., & Kjærgaard, P. 1996, MNRAS, 280, 167 (JFK1996)
- Jørgensen et al. (2006) Jørgensen, I., Chiboucas, K., Flint, K., Bergmann, M., Barr, J. M., Davies, R. L. 2006, ApJ, 639, L9
- Juneau et al. (2005) Juneau, S., et al. 2005, ApJ, 619, L135
- Kelson et al. (2000) Kelson, D. D., Illingworth, G. D., van Dokkum, P. G., & Franx, M. 2000, ApJ, 531, 184
- Lucey (1997) Lucey, J. R. 1997, MNRAS, 289, 415
- Maraston (2005) Maraston, C. 2005, MNRAS, 362, 799
- McIntosh et al. (2004) McIntosh, D. H., Rix, H.-W., & Caldwell, N. 2004, ApJ, 610, 161
- Peng et al. (2002) Peng, C. Y., Ho, L. C., Impey, C. D., & Rix, H. 2002, AJ, 124, 266
- Salasnich et al. (2000) Salasnich, B., Girardi, L., Weiss, A., & Chiosi, C. 2000, A&A, 361, 1023
- Sérsic (1968) Sérsic, J. L. 1968, Atlas de Galaxes Australes; Vol. Book; Page 1, 0
- Smail et al. (1997) Smail, I., Dressler, A., Couch, W. J., Ellis, R. S., Oemler, A. J., Butcher, H., & Sharples, R. M. 1997, ApJS, 110, 213
- Thomas et al. (2003) Thomas, D., Maraston, C., & Bender, R. 2003a, MNRAS, 339, 897
- Tran et al. (2005) Tran, K.-V. H., van Dokkum, P., Franx, M., Illingworth, G. D., Kelson, D. D., & Schreiber, N. M. F. 2005, ApJ, 627, L25
- Treu et al. (2003) Treu, T., Ellis, R. S., Kneib, J.-P., Dressler, A., Smail, I., Czoske, O., Oemler, A., & Natarajan, P. 2003, ApJ, 591, 53
- Treu et al. (2005) Treu, T., Ellis, R. S., Liao, T. X., & van Dokkum, P. G. 2005, ApJ, 622, L5
- van Dokkum & Franx (1996) van Dokkum, P. G., & Franx, M. 1996 MNRAS, 281, 985
- Wuyts et al. (2004) Wuyts, S., van Dokkum, P. G., Kelson, D. D., Franx, M., Illingworth, G. D. 2004, AJ, 605, 677