Probing isotopic ratios at z = 0.89:
molecular line absorption in front of the quasar PKS 1830-211
With the Plateau de Bure interferometer, we have measured the C, N, O and S isotopic abundance ratios in the arm of a spiral galaxy with a redshift of 0.89. The galaxy is seen face-on according to HST images. Its bulge intercepts the line of sight to the radio-loud quasar PKS~1830-211, giving rise at mm wavelengths to two Einstein images located each behind a spiral arm. The arms appear in absorption in the lines of several molecules, giving the opportunity to study the chemical composition of a galaxy only a few Gyr old. The isotopic ratios in this spiral galaxy differ markedly from those observed in the Milky Way. The 17O/18O and 14N/15N ratios are low, as one would expect from an object too young to let low mass stars play a major role in the regeneration of the gas.
Key Words.:
Quasars: PKS 1830-211 – Quasars: absorption lines – Astrochemistry – Galaxies: ISM – ISM: molecules, abundances1 Introduction
The C, N, O, S isotopic abundances are enlightening relics of the interstellar medium (ISM) past history. Not only are these elements the most abundant ones after H and He, but they are those whose synthesis in stars has been the best investigated. The CNO isotopes are tentatively classified into primary elements (12C, 16O,…), formed directly by He burning, and secondary ones (13C, 14N, 17O,…) formed at a later stage from primary elements, e.g. through the CNO cycles. In simple evolution models, the fraction of secondary elements increases with time. Actually, chemical evolution is not so straightforward and we know that isotopes like 14N and perhaps 13C are already in part produced in the first generation of stars.
Whereas isotopic abundances can be precisely measured in the Sun and on the Earth, their values in the Galactic ISM and, mostly, in the extragalactic ISM are hard to derive. In a pioneering work, Penzias and co-workers (Penzias et al. pen80 (1980), pen81 (1981)) used the millimeter (mm) emission lines of molecular isotopologues to infer the isotopic ratios in a dozen molecular sources. They found significant differences between the Solar System, the local ISM, the Galactic Center and circumstellar envelopes that they interpreted in terms of degree of nuclear processing, the Solar System representing the state of the local ISM some 4.5 Gyr ago. This picture of the Galactic ISM remains essentially valid today, although it has been recognized that the molecular ratios involving D and 13C are affected by isotopic fractionation or selective photodissociation and may not reflect the elemental isotopic abundance ratios (Wilson & Matteucci wil92 (1992)).
So far, only a few isotopic abundance ratios have been reported in external galaxies. Those are mostly the C, N, O and S isotopic ratios derived in the nuclei of four nearby starburst galaxies, M 82, IC 342, NGC 253 and NGC 4945, from the mm emission of CO, CS and HCN (Henkel & Mauersberger hen93 (1993), Henkel et al. hen98 (1998), Chin et al. chi99b (1999), Wang et al. wan04 (2004), Martín et al. mar05 (2005)). These ratios are very uncertain due to beam dilution, because the lines of the rare isotopologues are weak, and because the line opacity of the main isotopologues is unknown. Moreover, the studies deal with nuclear regions that may not reflect the disk ISM abundances, as is the case in the Milky Way.
Another powerful way of studying the composition of the ISM consists in observing the molecular lines in absorption. The method needs only a strong background source and is insensitive to distance and to primary beam dilution. It yields directly the line opacities, provided the background source is fully covered by the intercepting clouds (e.g. Lucas & Liszt luc98 (1998)). As far as molecular isotopic ratios are concerned, the method is limited to the line of sight to the brightest radio galaxies and quasars intercepted by deep absorption line systems. Few such absorption systems have been identified so far at millimeter wavelengths. They arise in the Milky Way (Lucas & Liszt luc96 (1996), luc98 (1998)) and in a few distant galaxies with redshifts in the range z = 0.2 – 0.9 (Wiklind & Combes wik94 (1994), wik95 (1995), wik96, Combes & Wiklind com98 (1998), Combes com99 (1999)).
In this article, we present high sensitivity absorption spectra arising from the most remote presently known system, located at z = 0.89. The spectra cover the lines of a dozen of molecular species, including the rare isotopomers HC17O+, H15NC and C34S. From these spectra, we derive the C, N, O and S isotopic ratios in the spiral arm of a young, seemingly normal galaxy.111We adopt the usual convention to simply denote by C, N, O and S the abundant isotopes 12C, 14N, 16O and 32S.
2 The gravitational lens towards PKS 1830-211
PKS 1830-211 is a radio loud quasar with a redshift of z = 2.5 (Lidman et al. lid99 (1999)), whose line of sight is intercepted by at least two galaxies: a relatively nearby one, responsible for narrow HI line absorption at redshift z = 0.19 (Lovell et al. lov96 (1996)), and a more distant one that gives rise to broad molecular and HI line absorption at z = 0.89 (Wiklind & Combes 1996 and 1998, hereafter WC (96) & WC (98), Gérin et al. ger97 (1997), Menten et al. men99 (1999), Chengalur et al. che99 (1999), Muller & Guélin mul03 (2003)). No molecular absorption is detected in the first galaxy (WC (98)) while the latter galaxy acts as a gravitational lens and gives rise, at radio wavelengths, to two compact sources (NE and SW) embedded in a faint Einstein ring (see Fig.3 from Chengalur et al. che99 (1999), see also Jauncey et al. jau91 (1991)). The ring has a steep spectral index and fades away at short wavelengths (Carilli et al. car98 (1998)), so that at mm wavelengths, the quasar image reduces essentially to the NE and SW sources that are distant by 1″, plus two weak ’tails’ (Frye et al. fry97 (1997), WC (98), Carilli et al. car98 (1998)).
The z = 0.89 absorption system shows two main velocity components: a broad one at z = 0.88582 (assuming V = 0 kms-1 in heliocentric coordinates), associated with the SW source, and a narrow component, 147 kms-1 lower in velocity, associated with the NE source (Frye et al. fry97 (1997), WC (98)). Although both components are detected in absorption in HI and in molecular lines, the NE component is more conspicuous in the HI line and the SW one in the molecular lines (WC (98), Chengalur et al. che99 (1999)).
Recently, Winn et al. (win02 (2002)) have published a HST I-band image of the z = 0.89 lensing galaxy. This latter appears as a typical nearly face-on spiral (probably of type Sb or Sc). The low inclination of the galaxy is confirmed by Koopmans & de Bruyn (koo05 (2005)), who modelled its kinematics from the HI absorption profile and find i = 17°– 32°. The bulge of the galaxy is located near the center of the radio ring. The SW radio source appears to lie right on top of a spiral arm, at a (model dependent) distance of 2 kpc from the center. The NE source lies at about twice this distance ( 4 kpc) on the other side of the nucleus. Both absorption components seem thus to arise in the counterpart of what we call in the Milky Way the Molecular Ring.
Adopting the cosmological parameters H0 = 70 kms-1 Mpc-1, = 0.3 and = 0.7, the redshift z = 0.89 corresponds to a lookback time of 7.2 Gyr, yielding an age 6 Gyr for the galaxy. Assuming that the first generation of stars formed 1 Gyr after the Big Bang, stars with masses 1.5 M⊙ barely had the time to contribute to the enrichment of the interstellar medium.
| PKS 1830-211 | |||
| NE image | R.A. (J2000) | 18h33m39932 | (1) |
| Dec. (J2000) | 21°03′39 73 | (1) | |
| SW image | R.A. (J2000) | 18h33m39886 | (1) |
| Dec. (J2000) | 21°03′4045 | (1) | |
| Redshift | z = 2.5 | (2) | |
| 3mm flux density | (variable) | 1.5 – 2.5 Jy | |
| Flux distribution | NE image | 63% | (3) |
| SW image | 37% | (3) | |
| Intervening galaxy | |||
| Redshift | z = 0.88582 | (3) | |
| Type | Sb or Sc | (4) | |
| Inclination | 17°– 32° | (5) | |
| Linear scale | 1″ 7.8 kpc | ||
| Velocity | SW absorption | 0 kms-1 | (6) |
| NE absorption | 147 kms-1 | (6) | |
| Age | 6 Gyr | ||
3 Observations
With the Plateau de Bure Interferometer (PdBI), we have carried out a high sensitivity and high spectral resolution survey of a dozen of mm absorption lines in the line of sight to PKS 1830-211. This survey is the result of a number of 2 – 4 hour-long observing sessions, carried out between 1999 and 2005 (see Table 2). The antennas were most of the time in a compact configuration which led to a synthesized beam 10″ at = 100 GHz ( = 21°), much larger than the source size. The phase reference was set at R.A. = 18h33m39937, Dec. = 21°03′3980 (J2000). The spectral resolution was 1.25 MHz before 2000, and 2 or 4 times better afterwards. For calibration purpose, a strong continuum source (usually 3C273 or 3C345), free of any absorption at the frequencies of interest was observed for 10 minutes shortly before and after PKS 1830-211.
The data were reduced and analyzed with the GILDAS/CLIC software. The data from each observing session were first calibrated for instrumental RF bandpass by fitting a high order polynomial on the spectrum observed for the strong continuum source. We checked that this calibration was accurate to better than 1%.
2
| Redshifted | Time | |||
|---|---|---|---|---|
| Line | frequency | Date | ON | Array⋄ |
| † (MHz) | source | |||
| HCO+ () | 94587.58 | 1999/06/11 | 3.0 h | 4C1 |
| 2001/03/20 | 2.5 h | 4ANT | ||
| 2001/06/29 | 3.5 h | 4ANT | ||
| 2002/06/25 | 3.0 h | 5D | ||
| 2003/02/26 | 2.2 h | 6Ap | ||
| 2003/03/01 | 2.6 h | 6Ap | ||
| H13CO+ () | 92006.01 | 1999/06/13 | 2.9 h | 4C1 |
| 2002/06/21 | 2.7 h | 5D | ||
| 2002/06/23 | 3.7 h | 5D | ||
| 2002/07/15 | 1.3 h | 5D | ||
| HC18O+ () | 90317.61 | 1999/08/03 | 3.2 h | 4ANT |
| 1999/09/09 | 2.8 h | 4C2 | ||
| 1999/10/02 | 2.8 h | 4C2 | ||
| 1999/11/12 | 1.8 h | 5D | ||
| 2001/05/08 | 1.7 h | 4ANT | ||
| HC17O+ () | 92327.67 | 1999/07/08 | 4.3 h | 4D2 |
| 1999/07/15 | 3.7 h | 4D2 | ||
| 1999/07/25 | 3.0 h | 4D2 | ||
| 1999/09/24 | 2.0 h | 4C2 | ||
| 1999/10/14 | 2.3 h | 4B1 | ||
| 1999/10/26 | 2.0 h | 4B1 | ||
| 1999/10/29 | 3.2 h | 4D1 | ||
| 1999/11/01 | 3.2 h | 4D1 | ||
| 1999/11/08 | 1.7 h | 5D | ||
| HCN () | 93996.83 | 1999/08/04 | 2.0 h | 4ANT |
| 2003/08/03 | 1.3 h | 30M | ||
| H13CN () | 91566.38 | 1999/08/29 | 2.7 h | 5D |
| 2001/07/03 | 2.6 h | 5D | ||
| HC15N () | 91264.34 | 1999/08/25 | 4.2 h | 4D1 |
| 1999/10/04 | 1.6 h | 4C2 | ||
| 2001/05/28 | 2.0 h | 4ANT | ||
| 2001/05/30 | 1.5 h | 4ANT | ||
| 2001/08/13 | 3.3 h | 4D1 | ||
| 2001/08/14 | 2.8 h | 4D1 | ||
| 2001/08/15 | 3.7 h | 4D1 | ||
| HNC () | 96151.68 | 2002/08/07 | 3.7 h | 5D |
| HN13C () | 92362.69 | 2001/08/26 | 2.7 h | 4D1 |
| 2001/10/15 | 1.2 h | 4ANT | ||
| H15NC () | 94244.99 | 2001/08/04 | 2.8 h | 4D1 |
| 2001/08/07 | 3.3 h | 4D1 | ||
| 2001/08/25 | 2.7 h | 4D1 | ||
| DNC () | 80924.89 | 2001/08/28 | 2.7 h | 4D1 |
| CS () | 103909.33 | 1999/07/09 | 3.3 h | 4D2 |
| C34S () | 102246.49 | 1999/09/21 | 1.8 h | 4C2 |
| 1999/09/23 | 2.2 h | 4C2 | ||
| 2001/05/09 | 1.8 h | 3ANT | ||
| 2001/05/10 | 3.4 h | 5D | ||
| 2001/05/14 | 2.6 h | 5D | ||
| H2S ()‡ | 89490.39 | 2005/07/05 | 4.3 h | 5D |
| 2005/07/29 | 3.2 h | 5D | ||
| 2005/09/05 | 3.0 h | 5D | ||
| 2005/09/09 | 1.8 h | 5D |
Notes:
⋄ The number of antennae is given with the name of the array configuration if defined.
† Redshifted frequencies are given for z = 0.88582.
‡ The HS (1) (89038.47 MHz) and HS (110-101) (89256.88 MHz) were observed simultaneously in the same correlator setup.
Next, the spectral data were calibrated in amplitude and phase with respect to the PKS 1830-211 continuum, whose flux was 2 Jy at = 3 mm. PKS 1830-211 being unresolved in the compact antenna configurations, the phases in this process were referenced to the barycenter of the continuum emission and the amplitudes normalized to the total continuum flux. Finally, the spectra observed on the different sessions and with the different baselines were co-added and a third-degree baseline withdrawn from the global spectrum, in order to remove small RF bandpass residuals (amplitude 2%) caused by instrumental drifts and/or strong atmospheric fluctuations.
The total integration time per line ranges from 1 h to 20 h; the rms noise on the weakest lines is between 2 and 7 mJy per 1.25 MHz channel.
In addition to the compact configuration observations just described, and which served as the basis of our molecular line survey, we observed on 2003 February 26th and March 1st the HCO+ () line in the extended A configuration. This configuration includes 400 m-long E-W and NE-W baselines that allow to spatially resolve the NW and SW source components. We used a special procedure to reduce these data. This procedure is described in §4.1.
Finally, we also observed on 2003 August 3rd the () line of HCN with the IRAM 30-m telescope. The spectrum shown in Fig. 3 is the sum of the 30-m and PdBI data.
4 Data analysis
4.1 Position of the absorptions
Using the BIMA array, Frye et al. fry97 (1997) (see also Swift et al. swi01 (2001)) successfully resolved the two continuum components. They derived an angular separation of 0.99″ 0.05″. Further evidence that the NE component was indeed responsible for the second absorption at V = 147 kms-1 was shown by WC (98). They used the BC configuration of the PdBI and fitted the position of the barycenter of emission directly from the visibilities.
Our A configuration PdBI observations of the HCO+ () line, which combine high sensitivity and high angular resolution enable us to locate with a much higher relative accuracy the velocity components. For this, we used the following procedure.
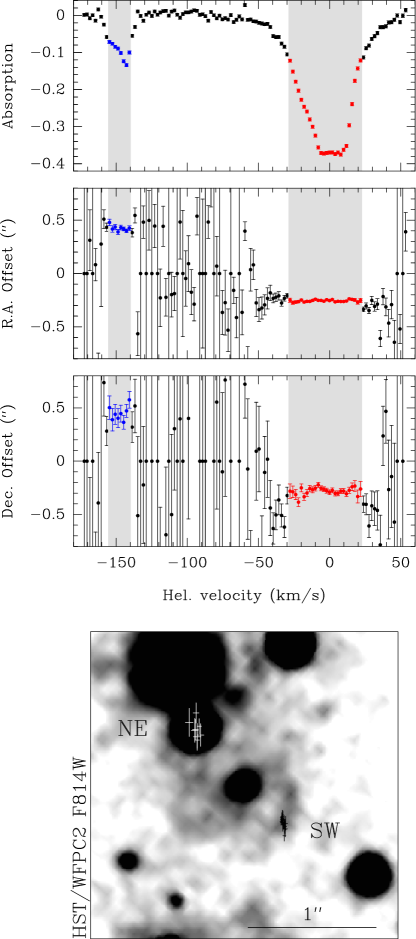
The RF bandpass was first calibrated using the quasar 1749+096 (on 2003 Feb. 26th) or 3C273 (on 2003 Mar. 1st). Next, the continuum data on PKS 1830-211 were self-calibrated by calculating the complex gains (amplitude and phase) corresponding to a point-like source of flux unity at the phase center. The latter was fixed through this procedure at the barycenter of the continuum emission. Then, the calculated gains were applied to the line visibilities and the continuum was subtracted. The resulting visibilities were fitted by a point source, channel by channel, to trace the position of the absorption. At this step, the absorptions at V147 kms-1 and V0 kms-1 were already clearly found to arise from two different locations (NE and SW respectively) separated by 1.01″ 0.03″ at a position angle of 42°.
The whole process was iterated: i) A new input continuum model, consisting of two point-like sources, located at the previously derived NE and SW positions and with fluxes in the ratio 1.7 (see Table 3), was used to self-calibrate the data. ii) the new continuum was subtracted from the calibrated visibilities to yield the amplitude of the absorption and its position in each velocity channel (Fig. 1).
We confirm that the two main absorption components (around V = 0 kms-1 and V = 147 kms-1) arise from two distinct compact sources, whose relative positions, estimated from weighted averages over each component, are (0.420″ 0.008″; 0.45″ 0.03″) for the NE component and (0.255″ 0.002″; 0.279″ 0.006″) for the SW component. This corresponds to a separation of 0.99″ 0.03″ and a position angle of 43°1°, in good agreement with the separation and position angle of the continuum sources derived from BIMA, MERLIN and VLA observations.
One purpose of our extended configuration observations was to check whether the 80 kms-1-broad absorption component centred at 0 kms-1 was arising entirely from the compact SW image, or if the line shoulders and/or wings were arising from the dimmer ‘tails’ and ‘knots’ visible at longer wavelengths, or from the weak Einstein ring. It should be noted that the V = 0 kms-1 HCO+ and HCN absorption profiles observed at 3-mm at low angular resolution are almost twice broader than those observed at 6-mm with a 0.1″ resolution (Carilli et al. car98 (1998)).
Fig. 1 shows that the absorption arises within 0.1″ (0.2″ in weak wings of the line) from a point-like source and shows no obvious velocity/position gradient. In particular, the emission at V 20 kms-1 and V 20 kms-1, which is not observed in the high resolution VLA and VLBA observations, does not arise from the ‘tails’ and ‘knots’, but comes from the compact SW ‘core’.
4.2 Magnification ratio
The flux of PKS 1830-211 is known to be variable. For example, van Ommen et al. (van95 (1995)) report a variation of the 15 GHz flux by a factor of 2 between 1990 and 1991, whereas Wiklind & Combes (wik99 (1999)) observe a similar increase of the 3-mm flux between 1997 and 1998. Although the 3-mm flux was mostly stable and close to 2.5 Jy in the course of our survey, we noted 20 – 30% changes between 1999 and 2001 and between 2001 and 2002. There was no significant change around August 2002, the period when the HNC line was observed.
A question central to this study is whether the magnification ratio of the NE and SW sources, = NE/SW, is also variable, as this would affect the amplitude of the V = 0 and 147 kms-1 absorption components with respect to the continuum flux. is expected to vary after a sudden increase of the flux of the background quasar, since the increase will first appear in the NE source, then in the SW source after a delay . The path length from the quasar to the observer is indeed shorter for the rays passing through the NE source (Nair et al. nai93 (1993)). has been measured by Lovell et al. (lov98 (1998)) and by Wiklind & Combes (wik99 (1999)) and found to be about 25 days. Micro-lensing events caused e.g. by stars may also randomly affect for short periods of time.
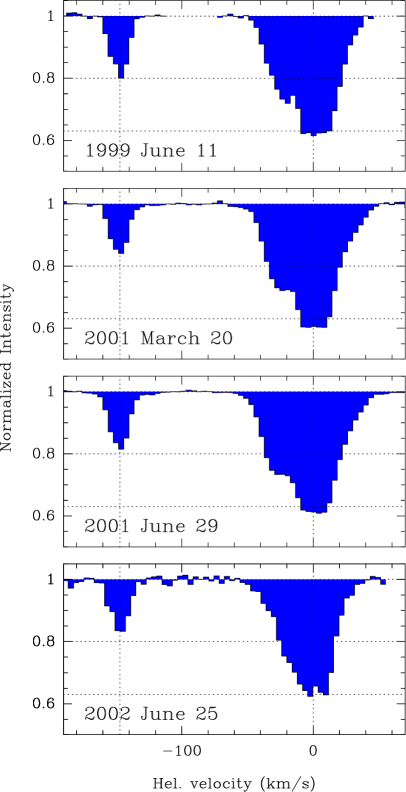
In order to check for variations of during the period of our observations, we have regularly observed the absorption spectrum of the HCO+ () line. Fig. 2 shows the line profiles on 4 different epochs. We see no variations in the lineshape or absorption depth that exceeds the 1-sigma rms uncertainty (typically a few percent – see Table 3). The 0 kms-1 component is known to be saturated in the HCO+ line. Assuming all the emission near 0 kms-1 comes from the NE source, we derive relative intensities of 37% and 63% for the SW and NE continuum sources, and a magnification ratio = 1.66 (Table 3). The lack of obvious variations of during our observing period simply means that the flux variations over intervals of time of 25 days were either small, or constant.
During their 3-year long monitoring of the HCO+ () line with the 30-m telescope (1996 – 98) Wiklind and Combes also observed magnification ratios in the range 1.4 – 1.7 with only a few excursions to values differing from = 1.6 by more than 2 (1 was typically 0.1). Swift et al. (swi01 (2001)) reported a significantly smaller ratio (1.2) for Dec. 1999, but this low ratio comes from the separation of the two continuum sources in a half-resolved map. Our average ratio is close to that measured with the VLA at 15 GHz and 23 GHz by Nair et al. (nai93 (1993)) in 1987 – 1990 (1.5 – 1.6).
We therefore assumed in the following that the relative fluxes of the NE and SW sources remained constant during our observations and simply co-added, when necessary, the calibrated spectra observed on different sessions. A variation of (e.g. by 20%) for short periods of time is however not excluded: it would merely change the absorption depths measured on those short periods (by %). This would have no significant effect on most isotopic ratios, that average data of different observing periods (see Table 2).
| Epoch | NE/SW ratio |
|---|---|
| 1995 Sep. 29 † | 1.6 0.2 |
| 1995 Sep. 30 † | 1.6 0.2 |
| 1995 Oct. 01 † | 1.5 0.1 |
| 1995 Oct. 26 † | 1.8 0.2 |
| 1999 Jun. 11 | 1.65 0.02 |
| 2001 Mar. 20 | 1.55 0.04 |
| 2001 Jun. 29 | 1.65 0.02 |
| 2002 Jun. 25 | 1.68 0.05 |
| 2003 Fev. 26 | 1.66 0.07 |
| 2003 Mar. 01 | 1.75 0.07 |
Notes: The magnification factor (NE/SW) is determined with the PdBI from
the saturation level of the HCO+ ()
line absorption at kms-1. In the case of extended configuration,
baselines longer than 300 m were flagged out.
† Re-reduction of previous PdBI observations (WC (98)).
4.3 Absorption profiles and opacities
Fig. 3 presents the absorption profiles for the (J=) lines of HCO+, HCN and HNC. Both the V = 0 kms-1 and V = 147 kms-1 components are detected in these 3 lines. The V = 147 kms-1 component had been previously observed by WC (98), but only for the HCO+ line and with a lower signal to noise ratio.
The absorption profiles of the V = 0 kms-1 and V = 147 kms-1 components are not Gaussian. The HNC () V = 0 kms-1 component consists of at least 3 Gaussian sub-components (Fig. 5) and the V = 147 kms-1 component of 2 sub-components, which implies the presence of several clouds in front of the SW and NE sources. The 5 Gaussian sub-components have velocities of 155, 150, 21, 3 and +7 kms-1. Their widths ( 10 – 20 kms-1) are typical of the width of Milky Way Giant Molecular Clouds.
A comparison of the HNC, HCN and HCO+ line profiles suggests a similar set of clouds with similar relative abundances, but with an increasing opacity from HNC to HCO+. A modelling of the line opacities, assuming that the SW source contains 37% of the total continuum flux, as derived in §3, and that the source filling factor by the absorbing clouds is close to 1, yields an opacity 2 at the peak of the HNC line, and a HCN/HNC opacity ratio of 3, fairly constant across the entire spectrum, from 160 to +20 kms-1.


Fig. 4 shows the J= line profiles of the rare 13C, 15N, 17O and 18O isotopologues of HCO+, HCN and HNC, as well as those of CS and C34S J=, and H2S and HS (J)=1. For these species, only the SW absorption is detected. The profiles of HNC and of the rare isotopomers are not flat-topped, but show narrow peaks near 0 kms-1. They are not only sharper than those of the main HCO+ and HCN isotopomers, but also shallower, indicating that they are not saturated. The absorption lines of H13CO+, HC18O+, H13CN and HC15N show very similar profiles, while the spectra of CS and H2S look different: the +7 kms-1 sub-component is much enhanced for those species. The similarity of the line opacity profiles of H13CO+ and HNC is illustrated in Fig. 5.
Assuming, again, that the SW source represents 37% of the total flux and that its filling factor is unity, the line opacity is given by:
| (1) |
where I(v) is the depth of the absorption from the continuum level and Isat the saturation level: I = 37% and I = 63% (we assume that the contribution from the Einstein ring is negligible at mm wavelengths). We emphasize here that the knowledge of the relative fluxes of the components allows us to derive the optical depths without any assumption on the line excitation temperature other that it is small with respect to the temperature of the quasar image. The major source of uncertainty on is coming from the filling factor, that may vary with velocity and species. However, we expect that all the isotopologues have the same spatial distribution, hence the same filling factor, as the abundant ones.
The flat shape of the HCO+ and HCN profiles around 0 kms-1 suggests that the clouds cover entirely the SW source. This coverage, however, may not be uniform, as the SW source size ( 2.5 mas, Carilli et al. car98 (1998)) is 10 pc at the distance of the galaxy and presumably large with respect to individual clouds. The apparent opacities in equation [1] are thus strictly speaking lower limits to the true opacities. However, the similarity of the absorption profiles on Fig. 4, which yet have very different opacities, suggests that the true opacities are not large, except for HCO+ and HCN near 0 kms-1, and that the values derived from equation [1] are close to the true opacities. This is illustrated in Fig. 5 which shows the opacity profiles of the HNC, H13CO+ and HC18O+ () lines, all of which are indeed very similar. We note that Carilli et al. (car98 (1998)) measure for the HCN () line an integrated apparent opacity kms-1 for the NE (V = 147 kms-1) component that agrees fairly well with our value of 3.5 kms-1 for the () line, demonstrating that the the component is indeed optically thin.
We have fitted the opacity profiles (eg. Fig. 5) derived with equation [1] for all the observed species with 4 Gaussian components: 3 for the SW source (50 V +40 kms-1), and one for the NE source (160 V 140 kms-1), which is too weak to be resolved, except in the HCO+ line. The fitted parameters (sub-component velocities, peak opacities and velocity widths) and integrated opacities are listed in Table 4 and Table 5 for the SW and NE components, respectively. The mean central velocities of the 3 absorption components towards SW are 21, 3 and 7 kms-1, and their mean linewidths are 13, 8 and 10 kms-1. The linewidths of these different components are typical of Giant Molecular Clouds in the Milky Way Molecular Ring.
Note that we could not derive reliable parameters for the rare isotopomer HC15N because of low S/N, and fixed the velocities of 2 Gaussian profiles to 3 and 7 kms-1. For the same reason, the NE absorption of the CS spectrum was fitted with velocity and width fixed to the same values as the HCN NE fit.
4
| V 3 kms-1 | V 7 kms-1 | V 23 kms-1 | ||||||||||
| SW | V0 | V1/2 | dV | V0 | V1/2 | dV | V0 | V1/2 | dV | |||
| (kms-1) | (kms-1) | (kms-1) | (kms-1) | (kms-1) | (kms-1) | (kms-1) | ||||||
| H13CO+ (1-2) | 3.3 | 0.27 | 8.6 | 2.5 (0.05) | 6.1 | 0.16 | 10.8 | 1.8 (0.06) | 19.5 | 0.06 | 15.5 | 1.0 (0.07) |
| HC18O+ (1-2) | 2.8 | 0.15 | 8.4 | 1.4 (0.06) | 5.9 | 0.06 | 12.2 | 0.7 (0.07) | 24.6 | 0.03 | 11.8 | 0.3 (0.07) |
| HC17O+ (1-2) | 1.8 | 0.01 | 10.0 | 0.15 (0.03) | – | – | – | – | – | – | – | – |
| H13CN (1-2) | 3.8 | 0.21 | 9.2 | 2.1 (0.08) | 8.4 | 0.08 | 7.6 | 0.6 (0.07) | 25.6 | 0.03 | 11.0 | 0.3 (0.08) |
| HC15N (1-2) | 3.0 † | 0.04 | 7.4 | 0.31 (0.03) | 7.0 † | 0.02 | 10.0 | 0.23 (0.04) | – | – | – | – |
| HNC (1-2) | 2.7 | 1.65 | 7.8 | 13.7 (0.07) | 6.1 | 1.17 | 11.5 | 14.2 (0.08) | 13.0 | 0.51 | 19.3 | 10.5 (0.1) |
| HN13C (1-2) | 3.3 | 0.12 | 6.8 | 0.9 (0.07) | – | – | – | – | – | – | – | – |
| H15NC (1-2) | – | (0.014) | – | 0.17 | – | – | – | – | – | – | – | – |
| DNC (1-2) | – | (0.011) | – | 0.19 | – | – | – | – | – | – | – | – |
| CS (3-4) | 3.1 | 0.54 | 8.3 | 4.8 (0.08) | 7.4 | 0.50 | 9.8 | 5.2 (0.09) | 25.5 | 0.13 | 16.3 | 2.3 (0.1) |
| C34S (3-4) | 3.5 | 0.06 | 7.4 | 0.44 (0.04) | 7.9 | 0.05 | 9.3 | 0.49 (0.05) | 18.1 | 0.02 | 10.1 | 0.25 (0.05) |
| H2S (101-110) | 6.6 | 0.29 | 6.3 | 2.0 (0.05) | 2.0 | 0.48 | 9.5 | 4.9 (0.06) | 19.4 | 0.07 | 11.1 | 0.8 (0.07) |
| HS (101-110) | 4.3 | 0.06 | 7.2 | 0.49 (0.07) | – | – | – | – | – | – | – | – |
| HS (101-110) | – | (0.016) | – | 0.19 | – | – | – | – | – | – | – | – |
Notes: Uncertainties on the integrated opacity are estimated as where is the rms uncertainty on the opacity for the velocity
resolution V ( 2 kms-1 here).
Upper limits are calculated as 3 where V1/2 is taken as the velocity width of the
same component of the main isomer or isotopomer.
The quoted uncertainties reflect the statistical noise and baseline residuals,
but not the uncertainties on the magnification ratio , which is assumed to
remain constant.
† Fixed parameter.
| Line | V0 | V1/2 | dV | |
|---|---|---|---|---|
| (kms-1) | (kms-1) | (kms-1) | ||
| HCO+ (1-2) | 147.2 | 0.35 | 14.7 | 5.5 (0.05) |
| HCN (1-2) | 146.4 | 0.28 | 11.6 | 3.5 (0.2) |
| HNC (1-2) | 146.0 | 0.07 | 14.1 | 1.1 (0.05) |
| CS (3-4) | 146.4 † | 0.02 | 11.6 † | 0.28 (0.08) |
| H13CO+ (1-2) | – | (0.007) | 14.7 † | 0.12 |
Notes: Uncertainties and upper limits on the integrated opacities are calculated as mentioned in
the caption of Table 4.
† Fixed parameter.
5 Isotopic ratios
In order to derive the line opacity ratios and the column density ratios of the different isotopologues, we assume that all the isotopologues from a same molecular species have the same spatial distribution and are similarly excited, hence that their line opacity profiles are similar.
The first hypothesis should be fulfilled, except for the species deeply affected by isotopic fractionation. In cold Galactic clouds, the abundances of molecules bearing 13C and, mostly, D atoms are known to be significantly affected by fractionation reactions and selective photodissociation. This is not the case, however, for the other species (see e.g. Langer et al. lan84 (1984)), and we will assume that their relative abundances do reflect the elemental isotopic abundance ratios. The hypothesis of similar spatial distribution is not critical in the sense that it yields isotopic ratios averaged over the (small) continuum source, as long as the line is not too optically thick.
The hypothesis of similar excitation is certainly correct for most line components and species: all the species studied here have large dipole moments and are hard to excite. Since the bulk of the absorption caused by a cloud pc with N(H2) = few cm-2 (Menten et al. men99 (1999)) is likely to arise in a low density envelope (n few cm-2), the molecules are essentially heated by the 5.1 K cosmic background, so that Trot 5.1 K. The lines of the main HCO+ and HCN isotopologues, the opacity of which is large between 10 and +10 kms-1, were not considered inside this velocity range for the derivation of the isotopic ratios.
The line opacity ratios derived for the different pairs of isotopologues are shown in Table 6. These ratios were calculated in the following way: five line opacity profiles, assumed to be identical for all isotopologues of a given molecular species, were derived by fitting the line opacity profiles of H13CO+, H13CN, HNC, CS and H2S with Gaussian components, as explained in §4.3 (see Fig. 5 and Table 4). Those species were selected because they are observed with a good signal-to-noise ratio and have a low or moderate opacity. The fitted opacity profiles were then sampled at the velocity resolution of the observations and squared to yield weights. The rare-to-abundant isotope line opacity ratio was then calculated as the weighted average of the ratios measured for each velocity channel, in the velocity ranges 10 V 10 kms-1 (line center) or 40 V 10 kms-1 (line wing). Finally, was inverted to yield the abundant-to-rare line opacity ratio, .
Similarly, the uncertainties on the line opacity ratios were first estimated for the rare-to-abundant ratios, . In all cases, the uncertainties are dominated by the noise on the rare isotopologue. Then, can be roughly decribed as a normal variable of variance . The error bars on the inverse (abundant-to-rare) ratio were then derived as equal to and +. Note that the bars are asymmetric for low signal-to-noise ratios. A more accurate evaluation of the errors from the likelihood function yields identical results.
Within our hypothesis of similar spatial distribution and similar excitation, the values of Table 6, multiplied by the inverse ratio of the square of the line frequencies, reflect the molecular isotopic abundance ratios.
We note that the 12C/13C and 14N/15N ratios derived from different species (e.g. HCN and HNC) and velocity components (e.g. wings vs center of line) agree within the quoted uncertainties. We come back to this point when we discuss the elemental isotopic ratios individually.
| Lines | Velocity | Line opacity |
|---|---|---|
| interval | ratios | |
| HCO+ / H13CO+ () | SW wings | 28 (3) |
| HCN / H13CN () | SW wings | 40 (5+7) |
| HNC / HN13C () | SW | 27 (3) |
| H13CN / HC15N () | SW | 4.2 (0.3) |
| HN13C / H15NC () | SW | 6 (2+4) |
| HNC / H15NC () | SW | 166 (58+194) |
| HCO+ / HC18O+ () | SW wings | 53 (10+16) |
| H13CO+ / HC18O+ () | SW | 2.01 (0.07) |
| HC18O+ / HC17O+ () | SW | 12 (2+3) |
| CS / C34S ()) | SW | 10.4 (0.7+0.8) |
| H2S / H234S () | SW | 8 (1.5) |
Notes: The SW component corresponds to velocities in the range 10 to +10 kms-1 and the SW wings to 40 to 10 kms-1. The quoted errors, 1, reflect the noise and baseline uncertainties, but not the uncertainties on the magnification ratio , which is assumed to remain constant.
The elemental isotopic ratios derived by averaging 222The mean value of the estimations was calculated as = ()/() with a variance = 1/. the values of Table 6 are given in Table 7, where we list, for comparison, the isotopic ratios in a number of Galactic and extragalactic sources. The former are the Solar System (SS), whose isotopic ratios probably represent the state of the ISM 4.5 Gyr ago, the local ISM, the Galactic Center (GC), which can be considered at a later stage of evolution, and the carbon rich circumstellar envelope IRC+10216 that consists of material entirely reprocessed in the core of a 2 M⊙ AGB star. The latter are giant clouds from the Large Magellanic Could (LMC), that are characterized by a low metallicity, and the nuclear regions of two nearby starburst galaxies, NGC 253 and NGC 4945.
The local ISM values come from Lucas & Liszt (luc98 (1998)) and were derived through absorption measurements against extragalactic continuum sources. They probably refer to the same type of clouds as those observed in our remote galaxy and are the most accurate values of Table 7. The envelope IRC+10216 is probably typical of the matter recycled to the ISM by low-mass stars. It is thought that two-third of the matter presently ejected by the stars in the Galactic ISM comes from such low mass stars. The sequence SS-ISM-GC-IRC+10216 may thus be considered in the first approximation as one of increasing processing of the gas by low-mass stars.
7
| 12C / 13C | 14N / 15N | 16O / 18O | 18O / 17O | 32S / 34S | |
| z = 0.89 galaxy | 27 2 | 130 † | 52 4 † | 12 | 10 1 |
| Solar System (a) | 89 | 270 | 490 | 5.5 | 22 |
| Local ISM (b) | 59 2 | 237 | 672 110 | 3.65 0.15 | 19 8 |
| Galactic Center (c) | 25 5 | 900 200 | 250 30 | 3.5 0.2 | 18 5 |
| IRC+10216 (d) | 45 3 | 4400 | 1260 | 0.7 0.2 | 21.8 2.6 |
| LMC (e) | 62 5 | 114 14 | 2000 | 1.8 0.4 | 18 6 |
| NGC 253 (f) | 40 10 | – | 200 50 | 6.5 1 | 8 2 |
| NGC 4945 (g) | 50 10 | 105 25 | 195 45 | 6.4 0.3 | 13.5 2.5 |
† Derived from a double ratio assuming 12C/13C = 27 2.
References:
a) Anders & Grevesse and89 (1989);
b) Lucas & Liszt luc98 (1998), except for 18O/17O taken from Penzias pen81 (1981);
c) Wilson & Matteucci wil92 (1992), Wilson & Rood wil94 (1994) and references therein;
d) Kahane et al. kah88 (1988), kah92 (1992) and Cernicharo et al. cer00 (2000);
e) Chin chi99a (1999);
f) Henkel & Mauersberger hen93 (1993), Harrison et al. har99 (1999) and Martín et al. mar05 (2005);
g) Wang et al. wan04 (2004).
5.1 Carbon
The 12C/13C elemental isotopic ratio is difficult to measure, since the main 12C isotopologues tend to be saturated when its 13C counterpart becomes detectable. This ratio, on the other hand, can be derived in our survey from 3 different molecules: HCO+, HCN and HNC. H13CO+, H13CN and HN13C are all detected in the SW component (V = 3 kms-1 component), but both HCO+ and HCN are heavily saturated at the peak of the line. The 12C/13C ratio can thus be measured only in the line wings (V 10 and V 10 kms-1). The opacity of the HNC line ( 2, see Fig. 5) is low enough to allow an estimate of the 12C/13C ratio even at the center of the line. Within the uncertainties, we find the same ratio for the 3 molecular species: . The mean isotopic ratio, estimated from a weighted average of the HCO+, HCN and HNC line opacity ratios, is , where the uncertainty only reflects the noise and the calibration errors, but not residual opacity effects linked e.g. to a change in the magnification ratio. Considering these restrictions, our ratio is in good agreement with that derived by Menten et al. (men99 (1999)) from VLA HNC () line observations for the same velocity component: 35. The HNC line is less optically thick than the line, but the VLA HN13C spectrum has a lower velocity resolution and is noisier than our spectra.
The relative abundances of 12C and 13C can be affected by isotopic fractionation (Lucas & Liszt luc98 (1998)). Milam et al. (mil05 (2005)), however, argue that the effects are limited and should not affect the isotopic ratios at the scales involved here. The agreement between the ratios derived from three different species and from two lines of the same species gives us confidence that the 12C/13C ratio in the SW source is indeed close to 27. Unfortunately, none of the 13C species is detected in the NE component (V = 147 kms-1). The upper limit on H13CO+ yields a 3 lower limit to the HCO+/H13CO+ ratio of 31, similar to the value of this ratio in the SW component.
The interpretation of the 12C/13C ratio in terms of nucleosynthesis is also not straightforward. 12C is a primary product of helium burning in intermediate and massive stars. 13C forms from 12C through the CNO cycles in the H-burning shell. It may form in H-burning shell of the very massive stars that produce 12C and/or could be produced later in a second generation of intermediate or low mass stars (Prantzos et al. pra96 (1996)). In the later scheme, the abundance of 13C relative to 12C is expected to increase with time and the degree of processing of the gas, but the observed 12C/13C ratio is not significantly lower in the IRC+10216 envelope than in the local interstellar medium (45 vs 59, see Table 7) which suggests that 13C behaves at least partly as a primary element. Thus, the low value of the 12C/13C ratio in the z = 0.89 galaxy may not be very meaningful.
5.2 Nitrogen
A direct measurement of the 14N/15N ratio is even more difficult than for the 12C/13C ratio, as it is larger. We derive this ratio directly from HNC for the V = 3 kms-1 component, or indirectly from the double (H13CN/HC15N)x[12C/13C] ratio. The isotopic ratios we arrive at are consistent and yield an average ratio 14N/15N = 130 20, a factor of two smaller than its Solar System and local ISM values.
The relative abundances of 14N and 15N are strongly affected by nuclear processing. In low mass stars, where the temperature of the H-burning zone is 108 K, the cold CNO cycles convert essentially C, N and O into 14N and destroy most of 15N. In massive stars, 15N is produced at equilibrium through the hot CNO cycle. In explosive episodes that mark the end of those stars (novae and supernovae), 14N is quickly converted into 15N and 18O. As a result, the 14N/15N ratio is a sensitive probe of the type of stars governing the nucleosynthesis; it should increase with the degree of processing by low mass stars. Indeed, 14N/15N is found to be much larger in the Galactic Center region than in the local ISM or in the Solar System and reaches an even larger value in the circumstellar shell IRC+10216 (Table 7). In contrast, the low ratio measured toward PKS 1830-211 fits well with the scenario where low mass stars played almost no role in the composition of the ISM in the z = 0.89 galaxy.
5.3 Oxygen
Because its value is very large, the 16O/18O ratio is usually measured through the double [13C/12C]x[16O/18O] ratio. The value we derive in this way, 60, is very low compared to the Solar and interstellar values ( 600), even though allowance should be made for a possible underestimation of 12C/13C, due to fractionation or residual opacity effects. That the actual ratio is low is confirmed by our direct measurement of the H12C16O+/H12C18O+ ratio in the wings of the SW component (Table 6), which also yields 60. This result is surprising, since both 16O and 18O form in massive stars and are predicted to behave about similarly, except at early ages, since 16O is a primary element and 18O a secondary element. And indeed, the 16O/18O ratio is found to decrease mildly or not at all between the local ISM to the Galactic Center (see Table 7 and Polehampton et al. pol05 (2005)). At early ages, the 16O/18O ratio is supposed to be larger (Prantzos et al. pra96 (1996)). The 16O/18O ratio in the Solar System, 1.6 times smaller than in the ISM, is however a well known puzzle in this context and is sometimes interpreted by an overabundance of 16O in the Solar Nebula.
The 18O/17O ratio, which is small and stems from lines that are certainly optically thin, may be more accurately derived. According to the current nucleosynthesis models, the 16O/18O and 16O/17O isotopic ratios are sensitive indicators of the stellar mass, 18O being essentially formed and released by short-lived massive stars while 17O comes mostly from long-lived low-mass stars (see e.g. Landré et al. lan90 (1990), Prantzos et al. pra96 (1996)). Our ratio 18O/17O = 12 is very large, compared to the canonical ISM value of 3 – 4 (Penzias pen81 (1981), Bensch et al. ben01 (2001), Wouterloot et al. wou05 (2005)) and to the Solar System value of 5.5. It is especially large with respect to the value observed in IRC+10216 and in other late type giant envelopes which are all 1 (Kahane et al. kah92 (1992)).
The high 18O/17O and low 16O/18O ratios, compared to the ISM and, mostly, to IRC+10216, are probably linked to the relative youth of the z = 0.89 galaxy. They may help us to better understand the puzzling 18O nucleosynthesis. It is worth noting that Combes & Wiklind (com95 (1995)) derived from similar absorption observations a limit C18O/C17O 15 in another high redshift galaxy (z = 0.68) on the line of sight to the quasar B0218+357.
The 18O/17O ratio has been estimated in the starburst nuclei of M 82, NGC 253 and NGC 4935 (Sage et al. sag91 (1991), Henkel & Mauersberger hen93 (1993)). The values, which are much more uncertain than in the cases of the ISM and the z = 0.89 galaxy, seem larger than the Local ISM value and may be explained by a initial mass function biased towards massive stars (Henkel & Mauersberger hen93 (1993)).
Fig. 7 compares in a single diagram the relative abundances of 16O, 17O and 18O as observed for the main Galactic and extragalactic sources. 17O appears particularly abundant in IRC+10216 and 16O unabundant in the z = 0.89 galaxy. The LMC stands in this diagram at the opposite of the z = 0.89 galaxy, but this could be an artifact of low metallicity and strong UV radiation field, which may lead to selective photodissociation of the rare C18O and C17O isotopes.

5.4 Sulfur
The 32S/34S ratio we derive from CS and H2S, 10 1, is at the same time accurate, since it is directly measured on optically thin lines for two different species, and meaningful, since only few molecular sources show such a clear departure of this ratio from its Solar System value, 22.
The 32S/34S ratio is found to be the same in the processed stellar envelope IRC+10216, in the Solar System and in the local ISM. The 34CS/33CS ratio is the same in all Galactic molecular sources, and the 13CS/C34S ratio, which is used to estimate the 32S/34S ratio in Giant Molecular Clouds where 12CS is optically thick, shows no variations across the Galaxy (Frerking et al. fre80 (1980), Chin et al. chi96 (1996)).
Because the 12C/13C ratio derived from H2CO and CO seems to decrease between the Solar neighbourhood and the Galactic Center, Chin et al. (chi96 (1996)) argue that the constancy of 13CS/C34S implies a similar decrease of 32S/34S. The 12C/13C gradient, however, is shallow, except perhaps near the Galactic Center. Moreover, CO and H2CO yield for the same galactocentric radius discrepant values (Wilson & Rood wil94 (1994)). Thus, the observed 12CO/13CO and HCO/HCO ratios may well be affected by 13C fractionation and/or line opacity effects and may not reflect the 12CS/13CS ratio, so that the presence of a 32S/34S gradient in the Galaxy is not established. As a matter of fact, it would be quite surprising to find a low 32S/34S ratio in the Galactic Center, where nucleosynthesis, we believe, is mainly driven by low mass stars.
The sulfur isotopes are produced and destroyed in massive and very massive stars. Their abundances stem from a critical balance between equilibrium and explosive nucleosynthesis. In a 25 M⊙ star, according to Woosley & Hoffman (woo86 (1986)), 34S is 20 times more efficiently produced at equilibrium than 32S and 100 times more than 33S. In an explosive oxygen burning episode, the three isotopes are produced about evenly. Our 32S/34S ratio of 10, twice smaller that in the local ISM, could imply that the IMF in the z = 0.89 galaxy is different from that of the Milky Way at the same age. Unfortunately, our non-detection of HS brings little information on this respect.
Wang et al. (wan04 (2004)) and Martín et al. (mar05 (2005)) report measurements of the 32S/34S ratio in the nuclear regions of two starburst galaxies, NGC 4945 and NGC 253. The values they derive (13.5 2.5 and 8 2, respectively) are similar to that we find in the z = 0.89 galaxy. They are much more uncertain, since they rely on the integrated intensity of the broad and weak 13CS line and on the knowledge of the 12C/13C ratio. In contrast, the 32S/34S in the LMC (18 6, according to Chin chi99a (1999)) is close to that in the local ISM.
5.5 Deuterium
Deuterium is produced in the Big Bang nucleosynthesis with a primordial [D/H] ratio of 2.5 10-5 (Spergel et al. spe03 (2003)). It is completely destroyed in the interior of stars, so that, ignoring infall of unprocessed gas, the D/H ratio is an indicator of the degree of evolution. In the local ISM, the average ratio D/H is 1.5 10-5.
The deuterium abundance can be greatly enhanced in molecules in the cold and dense gas. Extensive modelling of D-chemistry (see e.g. Roberts & Millar rob00 (2000)) predicts D/H values as large as 0.01 – 0.1 for molecules embedded in very cold clouds, and such high ratios have been observed in Galactic dark clouds (Guélin et al. gue82 (1982)), pre-stellar cores (Parise et al. par02 (2002)) and in the LMC (Chin et al. chi96 (1996)).
We searched during 3 hours for the DNC line with the PdB interferometer; no absorption was detected down to a level of = 0.011 (3) with a velocity resolution of V = 4.6 kms-1. Assuming a linewidth similar to the main isotopomer HNC, we obtain an upper limit from the ratio DNC()/HNC(): D/H 0.015 for the 3 kms-1 component.
Our upper limit is less constraining than that derived by Shah et al. (sha99 (1999)) from the double isotopic ratio: [DCO+]/[H13CO+].[13C/12C] 0.0022. The latter, however, contrary to our result, depends on the knowledge of the C isotopic ratio, a ratio that can be affected by fractionation. Both limits remain far higher than the primordial ratio and tell us little about stellar processing.
6 Molecular column densities
We have argued in §5 that the molecules studied here, which all have a large dipole moment, are likely to be at equilibrium with the cosmic background radiation, whose temperature at z = 0.89 is 5.1 K. The observations support this conclusion: Menten et al. (men99 (1999)) measure a rotation temperature Trot = 4.5 K from the observations of two rotational transitions of HC3N, and WC (96) from similar measurements find Trot = 4 2 for CS, H13CO+ and N2H+ and Trot 6 K for HNC. We therefore assume Tex = 5.1 K in our calculations.
The column densities of Table 8 were calculated from the equation:
| (2) |
where we assume LTE, optically thin lines and a filling factor of unity. EJ in this equation is the energy of the lower level of the transition, Q(Tex) = the partition function (gI = 3 for an ortho level, = 1 in any other case), and Aul the Einstein coefficient of the line Aul = . Here, is the electric dipole moment, Sul the line strength and gu the degeneracy factor of the upper level.
As concerns HCO+ and HCN, whose lines are optically thick, we calculated their column densities by multiplying those of their 13C isotopologues by 12C/13C = 27. This assumes that the 12C/13C ratio is the same for all molecules and all velocity components. Our results are in good agreement with the values of Menten et al. (men99 (1999)), which were derived from rotational transitions with lower J and lower opacities.
8
| Sul | gu | Aul | EJ,low | Q(5.14 K) | ||||
|---|---|---|---|---|---|---|---|---|
| (Debye) | (10-4 s-1) | (K) | (1012 cm-2) | (1012 cm-2) | ||||
| HCO+ | 3.90 | 2 | 5 | 4.02 | 4.3 | 2.77 | 300 (23) † | 11.4 (0.1) |
| H13CO+ | 3.90 | 2 | 5 | 3.70 | 4.2 | 2.83 | 11.1 (0.2) | 0.25 |
| HC18O+ | 3.90 | 2 | 5 | 3.50 | 4.1 | 2.88 | 5.1 (0.3) | – |
| HC17O+ | 0.4 (0.1) † | – | ||||||
| HCN | 2.99 | 2 | 5 | 2.32 | 4.3 | 2.78 | 289 (25) † | 12.3 (0.7) |
| H13CN | 2.99 | 2 | 5 | 2.14 | 4.1 | 2.84 | 10.7 (0.5) | 0.5 |
| HC15N | 2.99 | 2 | 5 | 2.13 | 4.1 | 2.85 | 2.1 (0.1) | – |
| HNC | 3.05 | 2 | 5 | 2.58 | 4.4 | 2.73 | 129.0 (0.5) | 3.7 (0.2) |
| HN13C | 4.8 (0.4)† | – | ||||||
| H15NC | 1.0 (0.2) † | – | ||||||
| DNC | 3.05 | 2 | 5 | 1.54 | 3.7 | 3.17 | 0.7 | – |
| CS | 1.96 | 4 | 9 | 1.50 | 14.1 | 4.72 | 560 (7) | 13 (4) |
| C34S | 1.96 | 4 | 9 | 1.42 | 13.9 | 4.79 | 53 (4) | – |
| H2S | 0.97 | 4.5 | 9 | 0.26 | 19.8 | 1.28 | 1104 (15) | 17 |
| HS | 110 (11) † | – |
A crude analysis of the chemistry in the z = 0.89 galaxy has been made by WC (96) and Menten et al. (men99 (1999)), who concluded that the molecular abundances in the SW velocity component (V 0 kms-1) are similar to those of Galactic dark clouds such as TMC 1. The HNC/HCN ratio we find (0.4) is indeed similar to that in those cold clouds (Hirota et al. hir98 (1998)) and two orders of magnitude larger than in the hot and dense clouds, such as Orion MC-1. A high HNC/HCN ratio probably means that these two species are formed by gas phase ion-molecule reactions via HCNH+. Note that a high HNC/HCN ratio has also been reported in the center of nearby starburst galaxies (e.g. Martín et al. mar06 (2006)).
The HCO+/N2H+ ratio, which reflects in the medium dense gas the CO/N2 ratio, is 6 (adopting the N2H+ integrated () line opacity measured by WC (96)). Its value is close to the ′′cosmic′′ O/N elemental ratio, 7.
Until now, H2S extragalactic detection was only reported in the LMC (Heikkilä et al. hei99 (1999)) and NGC 253 (Martín et al. mar05 (2005)). The abundance of H2S in the SW component is large (few with respect to H2, adopting (H2) = 3 1022 cm-2, WC (96)), compared to the standard values of 1 – 3 10-9 measured in the quiescent regions of OMC-1 and in the dark clouds (Minh et al. min89 (1989)). It is also a factor of 10 larger than in the local diffuse clouds, as measured by Lucas & Liszt (luc02 (2002)). This overabundance could reflect a large abundance of S in the gas, although the CS abundance seems normal. It could also mean that the absorbing gas at z = 0.89 is not that quiescent and that H2S molecules could be released from dust grains either by intense UV radiation from star forming regions or by shocks generated by young stellar objects, as is observed in the Orion (KL) outflow (Minh et al. min90 (1990)). The very wide absorption profile observed in a few pc-large SW absorbing cloud may support this last scenario.
Although we have measured only a few column densities for the NE velocity component (V = 147 kms-1), those also yield relative abundances similar to those of the cold dark clouds. In particular, the HNC/HCN ratio (0.3) is large.
7 Conclusion
The presence of an intervening nearly face-on spiral galaxy at z = 0.89 in the line of sight of the radio loud quasar PKS 1830-211 offers an unique chance to study the chemical and isotopic compositions of the interstellar medium in the spiral arm of a galaxy 2 – 3 times younger than the Milky Way. The use of the PdB interferometer has enabled us to combine very flat baselines and high sensitivity, making it possible to measure reliably the C, N, O and S isotopic abundance ratios in HCO+, HCN, HNC, CS, and H2S. The ratios derived from different species or velocity components are fully consistent, which supports the view that they are not affected by residual opacity effects and/or fractionation effects and that they reflect the elemental isotopic ratios.
A comparison of the isotopic ratios in the z = 0.89 galaxy with those observed in the local ISM, the Galactic Center, the circumstellar envelope IRC+10216 and the Solar System shows major differences with these sources. Mainly, the 17O/18O, and 14N/15N ratios, which are sensitive probes of the degree of processing of the gas by low mass stars and which are expected to increase with time are found to be smaller than in the ISM or the Solar System and much smaller than in the Galactic Center and in the fully processed low-mass star envelope IRC+10216. Most remarkably, the observed 16O/18O ratio is a factor of 10 lower than in the ISM and the Solar System and the 32S/34S ratio is twice lower than in the Galactic sources. These latter ratios result mainly from nucleosynthesis in high mass stars, it is likely that the stellar Initial Mass Function in the z = 0.89 galaxy is different from that of the Milky Way at the same age. The low 17O/18O, and 14N/15N ratios are consistent with the young age of the galaxy ( 6 Gyr) which is smaller than the lifetime of stars with masses 1.5 M⊙ and severly limits the importance of low mass stars in the regeneration of the ISM.
The isotopic ratios observed towards PKS 1830-211, although more extreme, are not unsimilar to those derived in the starburst nuclei of nearby galaxies, such as NGC 253, M82 and NGC 4945 (see e.g. Martín et al. mar06 (2006)). The later ratios, which result from the observation of weak and broad emission lines, are however far more uncertain.
The extension of this study to other remote galaxies is hampered by the small number of millimeter radio sources whose line-of-sight intercepts the plane of a remote galaxy. PKS 1830-211 is by far the brightest such source. The second best, at present, is the gravitational lens B0218+357 and several molecular lines have been observed in absorption at z = 0.68 toward this object (Wiklind & Combes wik95 (1995), Menten & Reid men96 (1996), Combes & Wiklind com97 (1997)). Even in this object, the detection of less abundant species is difficult (Henkel et al. hen05 (2005)). Fortunately, the flux of this source has been growing lately at millimeter wavelengths, giving hope that the rare carbon, oxygen and sulfur isotopes can be studied in the near future.
Acknowledgements.
We would like to thank all the members of the IRAM staff from the Plateau de Bure who made these observations possible. S.M. thanks Dr. Y.C. Minh for fruitful and stimulating discussions. We wish to thank the referee, whose comments helped to improve the paper. Based on observations carried out with the IRAM Plateau de Bure Interferometer. IRAM is supported by INSU / CNRS (France), MPG (Germany) and IGN (Spain).References
- (1) Anders E. & Grevesse N. 1989, Geochim. Cosmochim. Acta., 53, 197
- (2) Bensch F., Pak I., Wouterloot J.G.A., Klapper G. & Winnewisser G. 2001, ApJ, 562, L185
- (3) Carilli C.L., Menten K.M., Reid M.J. et al. 1998, astro-ph/9801157
- (4) Cernicharo J., Guélin M. & Kahane C. 2000, A&AS, 142, 181
- (5) Chengalur J.N., De Bruyn A.G. & Narasimha D. 1999, A&A, 343, 79
- (6) Chin Y.-N., Henkel C., Whiteoak J.B. et al. 1996, A&A, 305, 960
- (7) Chin Y.-N. 1999, IAU Symp. Vol. 190, p.279, Eds. Chu Y.H. et al.
- (8) Chin Y.-N., Henkel C., Langer N. & Mauersberger R. 1999, ApJ, 512, L143
- (9) Combes F. & Wiklind T. 1995, A&A, 303, L61
- (10) Combes F. & Wiklind T. 1997, ApJ, 486, L79
- (11) Combes F. & Wiklind T. 1998, ESO Messenger, 91, 29
- (12) Combes F. 1999, Ap&SS, 269, 405
- (13) Frerking M.A., Wilson R.W., Linke R.A. & Wannier P.G. 1980, ApJ, 240, 65
- (14) Frye B., Welch W.J. & Broadhurst T. 1997, ApJ, 478, 25
- (15) Gérin M., Philipps T.G., Benford D.J. et al. 1997, ApJ, 488, 31
- (16) Guélin M., Langer W.D. & Wilson R.W. 1982, A&A, 107, 107
- (17) Harrison A., Henkel C. & Russell A. 1999, MNRAS, 303, 157
- (18) Heikkilä A., Johansson L.E.B. & Olofsson H. 1999, A&A, 344, 817
- (19) Henkel C. & Mauersberger R. 1993, A&A, 274, 730
- (20) Henkel C., Chin Y., Mauersberger R. & Whiteoak J.B. 1998, A&A, 329, 443
- (21) Henkel C., Jethava N., Kraus A. et al. 2005, A&A, 440, 893
- (22) Hirota T., Yamamoto S., Mikami H. & Ohishi M. 1998, ApJ, 503, 717
- (23) Jauncey D.L., Reynolds J.E., Tzioumis A.K. et al. 1991, Nature, 352, 132
- (24) Kahane C., Gomez-Gonzalez J., Cernicharo J. & Guélin M. 1988, A&A, 190, 167
- (25) Kahane C., Cernicharo J., Gomez-Gonzalez J. & Guélin M. 1992, A&A, 256, 235
- (26) Koopmans L.V.E. & de Bruyn A.G. 2005, MNRAS, 360, L6
- (27) Landré V., Prantzos N., Aguer P. et al. 1990, A&A, 240, 85
- (28) Langer W.D., Graedel T.E., Frerking M.A. & Armentrout P.B. 1984, ApJ, 277, 581
- (29) Lidman C., Courbin F., Meylan G. et al. 1999, ApJ, 514, 57
- (30) Lovell J.E.J., Reynolds J.E., Jauncey D.L. et al. 1996, ApJ, 472, L5
- (31) Lovell J.E.J., Jauncey D.L., Reynolds J.E. et al. 1998, ApJ, 508, L51
- (32) Lucas R. & Liszt H. 1996, A&A, 307, 237
- (33) Lucas R. & Liszt H. 1998, A&A, 337, 246
- (34) Lucas R. & Liszt H. 2002, A&A, 384, 1054
- (35) Martín S., Martín-Pintado J., Mauersberger R., Henkel C. & García-Burillo S. 2005, ApJ, 620, 210
- (36) Martín S., Mauersberger R., Martín-Pintado J., Henkel C. & García-Burillo S. 2006, ApJS, 164, 450
- (37) Menten K.M. & Reid M.J. 1996, ApJ, 465, L99
- (38) Menten K.M., Carilli C.L., Reid M.J. 1999, ASP Conf. Ser., 156, 218
- (39) Milam S.N., Savage C., Brewster M.A., Ziurys L.M. & Wyckoff S. 2005, ApJ, 634, 1126
- (40) Minh Y.C., Irvine W.M. & Ziurys L.M. 1989, ApJ, 345, L63
- (41) Minh Y.C., Ziurys L.M., Irvine W.M. & McGonagle D. 1990, ApJ, 360, 136
- (42) Muller S. & Guélin M. 2003, ASP Conf. Ser., 304, 252
- (43) Nair S., Narasimha D. & Rao A.P. 1993, ApJ, 407, 46
- (44) Parise B., Ceccarelli C., Tielens A.G.G.M et al. 2002, A&A, 393, 49
- (45) Patnaik A. et al. 1994, in Proceedings of the 1993 Liege Symposium on Gravitational Lensing
- (46) Penzias A.A. 1980, Science, 208, 663
- (47) Penzias A.A. 1981, ApJ, 249, 518
- (48) Polehampton E.T., Baluteau J.-P. & Swinyard B.M. 2005, A&A, 437, 957
- (49) Prantzos N., Aubert O. & Audouze J. 1996, A&A, 309, 760
- (50) Roberts H. & Millar T.J. 2000, A&A, 361, 388
- (51) Sage L.J., Mauersberger R. & Henkel C. 1991, A&A, 249, 31
- (52) Shah R.Y., Wootten A., Mangum J.G., Carilli C.L. & Menten K.M. 1999, ASP Conf. Ser., 156, 233
- (53) Spergel D.N., Verde L., Peiris H.V. et al. 2003, ApJS, 148, 175
- (54) Subrahmanyan R., Narasimha D., Pramesh Rao A. & Swarup G. 1990, MNRAS, 246, 263
- (55) Swift J.J, Welch W.J. & Frye B.L. 2001, ApJ, 549, L29
- (56) van Ommen T.D., Jones D.L., Preston R.A. & Jauncey D.L. 1995, ApJ, 444, 516
- (57) Wang M., Henkel C., Chin Y.N. et al. 2004, A&A, 422, 883
- (58) Wiklind T. & Combes F. 1994, A&A, 286, L12
- (59) Wiklind T. & Combes F. 1995, A&A, 299, 382
- WC (96) Wiklind T. & Combes F. 1996, Nature, 379, 139 (WC96)
- WC (98) Wiklind T. & Combes F. 1998, ApJ, 500, 129 (WC98)
- (62) Wiklind T. & Combes F. 1999, astro-ph/9909314
- (63) Wilson T. & Matteucci F. 1992, A&A Rev., 4, 1
- (64) Wilson T.L. & Rood R.T. 1994, ARA&A, 32, 191
- (65) Winn J.N., Kochanek C.S., McLeod B.A. et al. 2002, ApJ, 575, 103
- (66) Woosley S.E. & Hoffman R. 1986, in ”Nucleosynthesis and Stellar Evolution”, eds Hauck B., Maeder A. & Meynet G., Geneva Observatory, p.67
- (67) Wouterloot J.G.A., Brand J. & Henkel C. 2005, A&A, 430, 549