An Upper Limit to the Degree of Evolution Between Supermassive Black Holes and their Host Galaxies
Abstract
We describe a model-independent integral constraint which defines an upper limit to the allowed degree of evolution in the ratio of black hole (BH) mass to host galaxy luminosity or mass, as a function of redshift. Essentially, if the BH/host ratio is excessive at redshift , then it would imply that the total mass density in BHs above some is larger at that redshift than at , which is impossible. This argument requires no knowledge of host or BH properties, only a lower limit to the observed luminosity density in the brightest galaxies at some . We calculate this upper limit from a variety of luminosity and mass functions in different bands from redshifts . We show that it is consistent with passive evolution of spheroid populations (with a fixed relation) in all cases, and provides tighter constraints than have generally been obtained previously, ruling out at observational and theoretical estimates suggesting that was significantly larger at high redshifts than locally, although relatively weak (factor by ) evolution is still allowed. We discuss a variety of possible “loopholes” or changes in the BH/host populations and correlations, and show that they typically lower the upper limits and strengthen our conclusions.
Subject headings:
quasars: general — galaxies: active — galaxies: evolution — cosmology: theory1. Introduction
Recent discoveries of tight correlations between the masses of supermassive black holes (BHs) in the centers of nearby galaxies and either the luminosity (e.g., Kormendy & Richstone, 1995), mass (Magorrian et al., 1998), or velocity dispersion (Ferrarese & Merritt, 2000; Gebhardt et al., 2000) of their host spheroids demonstrate a fundamental link between the growth of BHs and galaxy formation. Determining the evolution of these correlations with redshift is critical for informing analytical models (e.g., Silk & Rees, 1998) and simulations (Di Matteo et al., 2005; Robertson et al., 2006) which follow the co-formation of BHs and bulges, as well as theories which relate the evolution and statistics of BH formation and quasar activity to galaxy mergers (e.g., Hopkins et al., 2006a, d) and to the remnant spheroid population (Hopkins et al., 2006b). Likewise, the significance of observations tracing the buildup of spheroid populations (e.g., Cowie et al., 1996; Wolf et al., 2003; Bell et al., 2004a; Bundy et al., 2005b) and associations between spheroids in formation, mergers, and quasar hosts (e.g., Hopkins et al., 2006c) depends on understanding the evolution of BH/host correlations.
Efforts to directly infer these correlations at redshifts are, however, difficult and limited by the small numbers of objects with observable hosts. Consequently, different groups have reached seemingly contradictory conclusions, with O[III] velocity dispersion (Shields et al., 2003) and BH clustering (Adelberger & Steidel, 2005) measurements finding no evolution in these correlations out to redshifts , while CO velocity dispersion (Walter et al., 2004; Shields et al., 2005) and host -band luminosity (Peng et al., 2006) observations imply significant evolution (with BHs becoming over-massive relative to their hosts) occurring at . Spectral template fitting (Treu et al., 2004; Woo et al., 2006) suggests strong evolution at much lower redshifts , and comparison of radio quasar and galaxy populations (McLure et al., 2006) indicates evolution of the form . In addition to the difficulty of identifying host properties at these redshifts, the measurements generally rely upon virial line-width relations (e.g., Kaspi et al., 2005, and references therein) to determine BH masses, which have not been tested at high redshifts and require that the BH be visible as an optical, broad-line AGN.
It is therefore of interest to develop additional constraints on the evolution of BH/host correlations, especially ones which are independent of systematics in host measurements and selection effects in considering only AGN populations. For example, Merloni et al. (2004) compare the integrated quasar luminosity and stellar mass densities, and infer a much weaker evolution of the form , but this is subject to systematic uncertainties in quasar radiative efficiencies and (as discussed below) in observational completeness and galaxy type segregation at low luminosities. In this paper, we formulate and apply a model-independent integral constraint which provides an upper limit to evolution in these correlations as a function of redshift, and show that it rules out various proposed forms of evolution at high significance. We adopt a , , cosmology, but the choice of factors out in our analysis and the limits depend only weakly on and .
2. The Integral Constraint
If there exists some mean relationship between BH mass () and host mass or observed luminosity in a (rest-frame) band (), we can parameterize it with the coefficient ,
| (1) |
For simplicity in what follows, we adopt a linear correlation, but the argument can be generalized trivially for any functional dependence . The term can represent either total or strictly bulge/spheroid luminosity. Integrating the space density of both sides of Equation (1) down to some minimum , i.e.
| (2) |
gives an equivalent relation between BH mass density and galaxy (or spheroid) luminosity density (),
| (3) |
with the equivalent . Note that scatter in the relationship will introduce an additional multiplicative factor here, but this will generally cancel in our analysis (discussed further below). We divide the relations to obtain
| (4) | |||||
where the second equality comes from substitution with the definitions and . Note that this notation for is used by Peng et al. (2006), but in their case refers to individual systems, rather than the evolution of the mean relation. The third equality comes from the physical fact that it is not possible to destroy BH mass – the total mass above a given can never decrease from to the present. This is true for every and corresponding , which implies an upper limit to for arbitrary ,
| (5) |
where again the are defined in the same rest-frame band. Since is by definition a monotonic decreasing function of , the left hand side of Equation (5) is necessarily a monotonic increasing function of , and the upper limit for a given is well-defined. Any other functional dependence where BH mass increases with host luminosity or mass at fixed redshift will give a qualitatively identical constraint (it just will not lend itself to such convenient notation).
Given a luminosity function (LF) or luminosity density above some luminosity at and some higher redshift, we can determine the upper limit for every minimum luminosity . Figure 1 illustrates how this depends on the “dummy” variable , with an example of from Equation (5). This is heuristic for now, but in detail we use the -band observed local spheroid/red galaxy LF of Bell et al. (2003) to calculate , and the and COMBO-17 -band spheroid/red galaxy LFs from Faber et al. (2005) to calculate (see also Bell et al. (2004a); Willmer et al. (2005) for details and the nearly negligible - correction). We calculate the upper limit defined by Equation 5 () for every minimum luminosity at which the binned LF data exists (squares), with a upper limit (vertical error bar) estimated from the observational uncertainty in using Equation (5) to determine (technically we also add the errors in from in quadrature, but this is in all cases dominated by the errors).
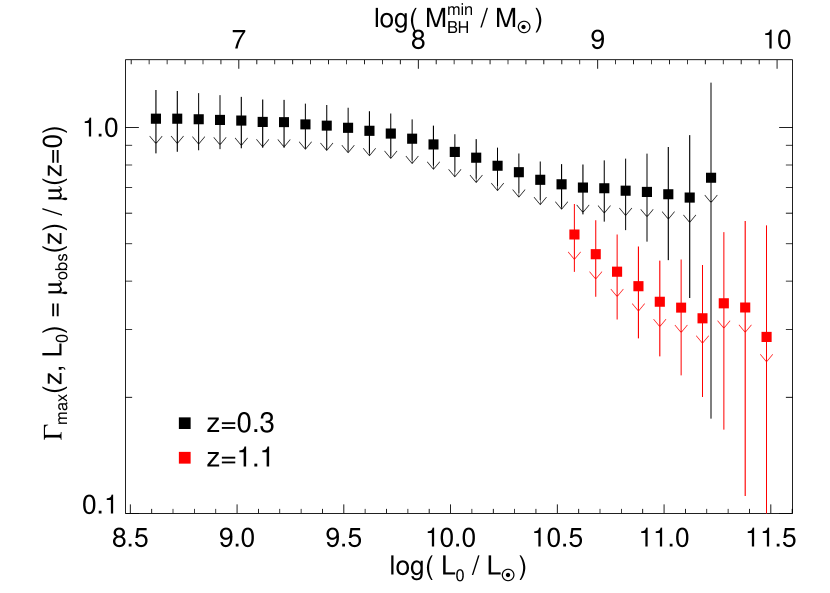
How strong the constraint is depends on which we integrate down to. For example, integrating to low effectively compares the cumulative BH mass densities at two redshifts, whereas integrating to a relatively high compares the BH mass density in only the most massive BHs. Both must be lower at than locally, but if e.g. the majority of the most massive BHs are in place by (such that their mass density is already comparable to that observed locally) while only a small fraction of low mass BHs exist (such that the total BH mass density may be substantially lower than that at ), then the former integration will give a much stricter limit . But since it is an upper limit which must hold above all minimum masses or luminosities , the lowest value of is the proper constraint.
This tends to derive from the highest luminosities because observations indicate that the stellar mass of the largest objects is largely formed by (“cosmic downsizing,” e.g., Cowie et al., 1996), meaning that the luminosity density in them is constant or rises with , as the stellar populations are younger and brighter at higher redshift. As long as the number of objects at the highest masses does not fall dramatically with , this trend in the constraints on is preserved. In other words, if a significant fraction of the most massive objects are formed by and their rest-frame luminosity is typically brighter at that time, then the BH mass to host luminosity ratio cannot also increase, or the mass density in the most massive BHs would be much higher at than it is today.
The observations are more complete and are dominated by spheroids at these luminosities, which reduces our uncertainties and also means that it does not matter whether the appropriate correlation is with spheroid or total galaxy light/mass. However, at the brightest luminosities, the number of observed objects is small and statistical uncertainty is larger. Therefore, in what follows, we take as our constraint the value of which has the minimum upper limit. This is a conservative assumption, as higher will give lower (but less well-constrained) limits and the cumulative significance of the upper limit (i.e. cumulative upper error with respect to the entire data set) will always be smaller than that we show.
With a well-defined from any observed sample at a given redshift, we now consider . Figure 2 shows this upper limit as a function of redshift, from a large number of different observed LFs, in , , and bands as well as estimated directly from stellar mass functions. We calculate (squares) and its error as above in each case, and also plot (horizontal error bars) the redshift range over which each binned LF is measured. Because it appears locally that the appropriate correlation is between and the bulge/spheroid luminosity or mass, we consider only samples which have measured LFs for both early and late types, and derive our constraints only from the early type luminosity density comparison. We discuss this below, however, and find it makes no difference to our conclusions. For each band, we compare to the best-determined local luminosity density as a function of the minimum luminosity . The resulting constraints are generally strongest from optical LFs, because these typically involve the largest samples and thus have the best statistics at the bright end. The mass-function constraints, by comparison, are similar where the samples are large enough to probe comparable number densities, but generally derive from much smaller samples.
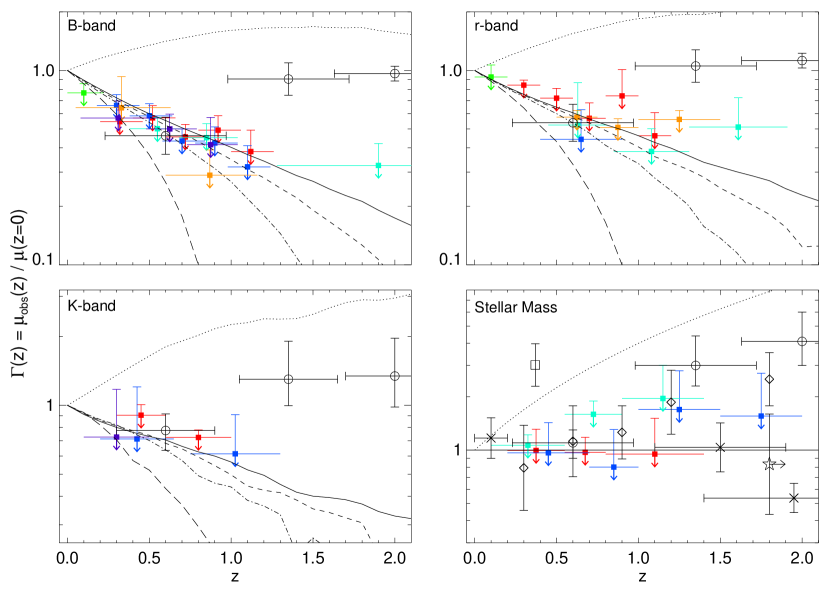
For comparison, we plot expected from passive evolution, assuming a constant BH to host stellar mass ratio () with the spheroid luminosity and colors passively evolving from a formation redshift (long dashed, dotted, short dashed, solid lines, respectively) at solar metallicity according to the stellar population synthesis models of Bruzual & Charlot (2003). We also plot (open black circles) the recent estimates of the evolution in these correlations from Peng et al. (2006). The authors directly measure the correlation with ; we use their adopted model to convert to mass, , and band estimates. Note that they assume passive evolution with ; as they point out, allowing for star formation or younger populations will push their estimates of to higher values. In the stellar mass panel, we also show (open black points) the observational estimates of Shields et al. (2003, crosses), Woo et al. (2006, square), Adelberger & Steidel (2005, star), and McLure et al. (2006, diamonds). The dotted line in each panel shows with , a rough upper envelope of these observations as they would manifest in other bands.
3. Discussion
Our model-independent integral measure provides a constraint on the evolution in the correlation between BH mass and host luminosity or mass. The upper limits we derive are competitive with or stronger than those from direct, but difficult observations of high-redshift BHs and their hosts, and can be applied in any band (including those for which direct estimates of these correlations at do not exist). Our upper limits are consistent with passive evolution (with reasonable formation redshifts ) at all redshifts and in every band, as well as hydrodynamic simulations of BH and spheroid co-formation at different redshifts (Robertson et al., 2006), and various estimates of these correlations at low redshifts (, Shields et al., 2003; Peng et al., 2006). The weak evolution inferred by Merloni et al. (2004) cannot be ruled out for sufficiently low , but the mass function data prefer a no-evolution case at . However, the best-fit evolution estimates (open points in Figure 2) by e.g. Treu et al. (2004); Shields et al. (2005); Peng et al. (2006); McLure et al. (2006); Woo et al. (2006) are ruled out at with respect to the upper limits we measure over each corresponding redshift interval. (Note that this does not necessarily mean their measurements are inconsistent with our upper limits at , as the error bars in the direct observations are large and generally inconsistent with passive evolution at only .) It should be noted, however, that there is a factor systematic normalization uncertainty in the virial BH mass estimators these authors adopt, and lowering e.g. the estimates of Peng et al. (2006) by such a factor (i.e. allowing for a factor of increase in by ) makes them consistent with our upper limits.
Given this apparent contradiction, it is natural to ask whether there are effects which could increase the upper limits () in Figure 2. Observational incompleteness will only lead to a higher “true” luminosity density at some , and lower (assuming the luminosity density at is not substantially less complete than that at higher redshift). If we have somehow severely overestimated the mass in large spheroids at high , i.e. if these red systems are really all dusty starbursts, this could increase , but many of the samples shown in Figure 2 are morphologically, not color, selected, and observations find that only a small fraction of the luminosity density in red galaxies at comes from dusty, intrinsically blue sources (too small to change our conclusions) (Bell et al., 2004b). However, this may rise to at (e.g., Cimatti et al., 2002), shifting the limits at these redshifts from the color-selected samples of Fontana et al. (2004) and Giallongo et al. (2005) up by a factor .
Furthermore, the most meaningful upper limits come from high luminosities (typically mag above the LF break at each ), where a significant fraction of the most massive galaxies are in place by and this constraint is most sensitive to a change in , but also where the observations are most well-constrained. For this reason, it makes no difference which local LF we use to compare in Equation (5), as they all agree well at these luminosities (see e.g. Figures 8 & 9 of Bell et al. (2003)). We have also directly tested this with the local LFs in Kochanek et al. (2001); Bell et al. (2003); Blanton et al. (2003); Nakamura et al. (2003) and find the results are similar. Moreover, it makes no difference whether or not we use the cumulative (all galaxy) LFs (i.e. assume a correlation between and total galaxy light or mass) instead of spheroid LFs as above, since spheroids dominate the luminosity density above these bright luminosities. In any case, the contribution of late-types tends to evolve in a similar fashion to that of early types (see e.g. the observations in Figure 2 and Drory et al., 2004). In even more detail, allowing for late types but accounting for their bulges (with more detailed morphology-dependent LFs) makes negligible difference, as e.g. Koo et al. (2005) find most massive bulges are already in place at , giving a similar constraint but with more objects and thus a stronger upper limit.
Changing the form of the correlation also does not alter our results. Our derivation of Eqn. 5 can be performed for any correlation of the form or , and any relationship where is an increasing function of host mass or luminosity will give a similar result. Furthermore, all non-linear forms of the correlation which have been proposed observationally or theoretically steepen at high luminosity (high ), increasing the implied mass of the most massive BHs and their relative weight in the BH mass density, and directly considering these non-linear (Kormendy & Richstone, 1995; Marconi & Hunt, 2003; Häring & Rix, 2004) or even log-quadratic (Wyithe, 2006) correlations in every case lowers .
But what if the shape or slope of changes with redshift? This would be particularly interesting, in the implication that the ratio evolves differently for systems of different mass. The exact effect on our derivation depends on the “pivot point” about which the relationship slope changes. For example, given that most of the measurements in Figure 2 have been restricted to high-, keeping these points fixed but finding a steeper slope at high redshift would imply a lower observed at lower masses, which could relieve tension between our upper limits and the observations, although it would also raise the implied at higher masses. In such a case, our integral constraint still obtains, it simply must be applied as a function of or , as becomes a function of mass as well as redshift. The limits shown in Figure 2 would then refer to the specific to which we perform our integration (generally ).
Allowing for scatter in the BH/host relationship likewise does not alter our results. Non-zero scatter will introduce a term in the left-hand side of Equation (5) (the appropriate exact factor will be a non-trivial function of , but since the relevant constraints come from somewhat above the LF break, this factor is accurate to and the qualitative behavior is identical). A larger scatter implies more objects at the highest for a given host LF, so if the scatter in these relations were significantly smaller at , it would increase . However, every observational indication, especially from the observations in conflict with a low , is for an increasing scatter with (Shields et al., 2003, 2005; Treu et al., 2004; Peng et al., 2006; Woo et al., 2006). Moreover, if the mean -host relation were higher in the past (), we still know observationally that there is a non-negligible population (especially at the highest masses of interest) which has only passively evolved since such times (no star formation beyond the level, and can only increase) (see e.g., Kauffmann et al., 2003; Bell et al., 2004a; Faber et al., 2005), so these systems must have been at or below the present relation at that redshift (spheroid-spheroid “dry” mergers, which by definition conserve the mean -host mass/luminosity relations, cannot change this). Therefore, the scatter must increase with in such a scenario, which gives a lower .
Since the limits on rule out increasing strongly in the mean (i.e. for the general population) relative to the host bulge or total galaxy, it is next worth asking whether the discrepant from some of the observations in Figure 2 could represent some particular (short-lived) stage of development. The simplest possibility is that once an object has formed its bulge or spheroid, it will lie on the appropriate (passively evolved) relation, but that the observations see disks which have grown their BHs but have not yet grown a bulge. In such a scenario, in spheroids is given by the passive evolution tracks, and there is an independent, potentially much larger for “pre-spheroids.”
This pre-spheroid population, however, cannot constitute all disks or blue “star-forming” galaxies. First, at least some disks have survived since , and this would demand they have overmassive BHs relative to the total galaxy light/mass, where in fact the opposite is observed (i.e. correlates with bulge, not total galaxy mass; e.g., Kormendy & Richstone, 1995). Second, this scenario trivially modifies our calculation of – we integrate over spheroids with from the passive evolution tracks and determine the upper limit to in the remaining disk population. In Figure 2 it is clear that the previous is already marginally consistent with the passive evolution tracks; adding an additional source of high-mass BHs is not possible. Regardless, integrating down to a lower (where disks begin to dominate the population) gives a similar constraint to those in Figure 2, since there is little room for “additional” BH mass density and, as noted above, the disk population evolves similarly to spheroids at the bright end (in the sense that the evolution is weak).
The remaining possibility is that objects with BHs larger than our upper limits are an even more limited sub-class of galaxies. The natural expectation might be that AGN or bright quasars in particular obey this discrepant relation, since essentially all of the estimates of the high-redshift relation are from quasars. Locally at least, bright quasars constitute a tiny fraction of galaxies, so they can have much higher BH masses than their inactive counterparts (i.e. higher ) without contributing much total BH mass. However, this phase would have to be short-lived, much like the quasar phase itself, or else it is equivalent to saying that a large fraction of non-spheroids obey this higher and violates the integral constraints as above. Therefore, the host must “catch up” to have the appropriate stellar mass for the (passively evolved) relation in a short period of time. However, cosmological cooling and infall generally requires a non-negligible fraction of a Hubble time, implying (if this were the mechanism to add bulge mass) that too large a fraction of galaxies would lie on the discrepant relation (given the integral constraints above), and invoking subsequent mergers or interactions to transport gas would imply that the quasar somehow “knows” the system is going to interact before the interaction begins.
This suggests that the mass required for the bulge to “catch up” is present, in the form of gas “about” to be turned into stars (see also e.g. Croton, 2005), but this hypothesis encounters a number of observational conflicts. To reach the appropriate relation given the observations in Figure 2 which imply strong evolution in , the systems would have to be gas at , which for the appropriate total mass range at these redshifts with these concentrations gives quiescent (lower-limit) star formation rates ’s of (e.g., Kennicutt, 1998; Springel et al., 2005). The typical quasar hosts would be late-type galaxies, and in the subsequent, brief period of rapid star formation the BH would be overmassive with the galaxy “catching up” (and could not significantly accrete without preventing this “catching up”).
All of these predictions appear to be opposite the observations, with quasar spectra dominated by post-starburst activity (Vanden Berk et al., 2006), typically early-type, bulge-dominated hosts (especially in the brightest quasars; Dunlop et al., 2003; Floyd et al., 2004), and observed starbursts usually showing high accretion rate BHs which are at that moment undermassive relative to their hosts (e.g., Borys et al., 2005). Moreover, if star formation is ongoing in these objects to grow their bulges, it implies a lower mass-to-light ratio and suggests that the discrepancy between their -host relations is even larger than that in Figure 2, amplifying these difficulties. Furthermore, by the highest luminosities and redshifts , the active fraction of BHs with masses is (relative to the total number of such objects at ; McLure & Dunlop, 2004), which creates some tension if these are a different population from the “finished” large spheroids at that redshift, which can already account for the mass density of such large BHs (but is perfectly consistent if these are the same population, and quasars have large bulges). Finally, associating this discrepant with quasars connects it not with the cosmological buildup of galaxies but with a particular evolutionary “snapshot” or event. This makes it difficult to explain why quasars at would appear in bulge-less systems as a “signpost” of bulge formation about to occur, while quasars of the same luminosity at and low-luminosity AGN (which form a continuum in ) would appear in normal, massive, bulge-dominated systems.
References
- Adelberger & Steidel (2005) Adelberger, K. L., & Steidel, C. C. 2005, ApJ, 627, L1
- Bell et al. (2003) Bell, E. F., McIntosh, D. H., Katz, N., & Weinberg, M. D. 2003, ApJS, 149, 289
- Bell et al. (2004a) Bell, E. F., et al. 2004a, ApJ, 608, 752
- Bell et al. (2004b) Bell, E. F., et al. 2004b, ApJ, 600, L11
- Blanton et al. (2003) Blanton, M. R., et al. 2003, ApJ, 592, 819
- Borys et al. (2005) Borys, C., et al. 2005, ApJ, 635, 853
- Bruzual & Charlot (2003) Bruzual, G. & Charlot, S. 2003, MNRAS, 344, 1000
- Bundy et al. (2005a) Bundy, K., Ellis, R. S., & Conselice, C. J. 2005a, ApJ, 625, 621
- Bundy et al. (2005b) Bundy, K., et al. 2005b, ApJ, in press [astro-ph/0512465]
- Chen et al. (2003) Chen, H.-W., et al. 2003, ApJ, 586, 745
- Cimatti et al. (2002) Cimatti, A., et al. 2002, A&A, 381, L68
- Cowie et al. (1996) Cowie, L. L., Songaila, A., Hu, E. M., & Cohen, J. G. 1996, AJ, 112, 839
- Croton (2005) Croton, D. J. 2005, MNRAS, in press [astro-ph/0512375]
- Dahlen et al. (2005) Dahlen, T., et al. 2005, ApJ, 631, 126
- Di Matteo et al. (2005) Di Matteo, T., Springel, V., & Hernquist, L. 2005, Nature, 433, 604
- Drory et al. (2004) Drory, N., et al. 2004, ApJ, 608, 742
- Dunlop et al. (2003) Dunlop, J. S., et al. 2003, MNRAS, 340, 1095
- Faber et al. (2005) Faber, S. M., et al. 2005, ApJ, in press [astro-ph/0506044]
- Ferrarese & Merritt (2000) Ferrarese, L., & Merritt, D. 2000, ApJ, 539, L9
- Floyd et al. (2004) Floyd, D. J. E., et al. 2004, MNRAS, 355, 196
- Fontana et al. (2004) Fontana, A., et al. 2004, A&A, 424, 23
- Franceschini et al. (2006) Franceschini, A., et al. 2006, A&A, in press [astro-ph/0601003]
- Gabasch et al. (2006) Gabasch, A., et al. 2006, A&A, 448, 101
- Gebhardt et al. (2000) Gebhardt, K., et al. 2000, ApJ, 539, L13
- Giallongo et al. (2005) Giallongo, E., et al. 2005, ApJ, 622, 116
- Häring & Rix (2004) Häring, N., & Rix, H.-W. 2004, ApJ, 604, L89
- Hopkins et al. (2006a) Hopkins, P. F., et al. 2006a, ApJS, 163, 1
- Hopkins et al. (2006b) Hopkins, P. F., et al. 2006b, ApJS, 163, 50
- Hopkins et al. (2006c) Hopkins, P. F., Bundy, K., Hernquist, L., Ellis, R. S., 2006c, ApJ, submitted, [astro-ph/0601621]
- Hopkins et al. (2006d) Hopkins, P. F., Somerville, R. S., Hernquist, L., Cox, T. J., Robertson, B., & Li, Y. 2006d, ApJ, submitted [astro-ph/0602290]
- Im et al. (2002) Im, M., et al. 2002, ApJ, 571, 136
- Kaspi et al. (2005) Kaspi, S., et al. 2005, ApJ, 629, 61
- Kauffmann et al. (2003) Kauffmann, G., et al. 2003, MNRAS, 341, 54
- Kennicutt (1998) Kennicutt, R. C. 1998, ARA&A, 36, 189
- Kochanek et al. (2001) Kochanek, C. S., et al. 2001, ApJ, 560, 566
- Koo et al. (2005) Koo, D. C., et al. 2005, ApJS, 157, 175
- Kormendy & Richstone (1995) Kormendy, J., & Richstone, D. 1995, ARA&A, 33, 581
- Magorrian et al. (1998) Magorrian, J. et al. 1998, AJ, 115, 2285
- Marconi & Hunt (2003) Marconi, A., & Hunt, L. K. 2003, ApJ, 589, L21
- McLure et al. (2006) McLure, R. J., et al. 2006, Astronomische Nachrichten, 327, 213
- McLure & Dunlop (2004) McLure, R. J., & Dunlop, J. S. 2004, MNRAS, 352, 1390
- Merloni et al. (2004) Merloni, A., Rudnick, G., & Di Matteo, T. 2004, MNRAS, 354, L37
- Nakamura et al. (2003) Nakamura, O., et al. 2003, AJ, 125, 1682
- Peng et al. (2006) Peng, C. Y., et al. 2006, ApJ[astro-ph/0603248]
- Pozzetti et al. (2003) Pozzetti, L., et al. 2003, A&A, 402, 837
- Robertson et al. (2006) Robertson, B., et al. 2006, ApJ, 641, 90
- Shields et al. (2003) Shields, G. A., et al. 2003, ApJ, 583, 124
- Shields et al. (2005) Shields, G. A., Menezes, K. L., Massart, C. A., & Vanden Bout, P. 2005, ApJ, [astro-ph/0512418]
- Silk & Rees (1998) Silk, J. & Rees, M. J. 1998, A&A, 331, L1
- Springel et al. (2005) Springel, V., Di Matteo, T., & Hernquist, L. 2005, MNRAS, 361, 776
- Treu et al. (2004) Treu, T., Malkan, M. A., & Blandford, R. D. 2004, ApJ, 615, L97
- Vanden Berk et al. (2006) Vanden Berk, D. E., et al. 2006, AJ, 131, 84
- Walter et al. (2004) Walter, F., et al. 2004, ApJ, 615, L17
- Willmer et al. (2005) Willmer, C. N. A., et al. 2005, ApJ, in press [astro-ph/0506041]
- Wolf et al. (2003) Wolf, C., et al. 2003, A&A, 401, 73
- Woo et al. (2006) Woo, J.-H., Treu, T., Malkan, M. A., & Blandford, R. D. 2006, ApJ, in press [astro-ph/0603648]
- Wyithe (2006) Wyithe, J. S. B. 2006, MNRAS, 365, 1082
- Zucca et al. (2005) Zucca, E., et al. 2005, A&A, in press [astro-ph/0506393]