Spitzer Observations of Var Her 04:
Possible Detection of Dust Formation in a Super-Outbursting TOAD
Abstract
We present four MIPS (24 µm) and two IRAC (3.6, 4.5, 5.8, and 8.0 µm) Spitzer observations of the newly discovered Tremendous Outburst Amplitude Dwarf nova (TOAD) Var Her 04 during decline from super-outburst. The four MIPS observations span 271 days and the two IRAC observations span 211 days. Along the line-of-sight to Var Her 04, there is a foreground M-star within 1″ of the variable; as a result, all of the Spitzer photometry presented in this paper is a blend of the foreground M-star and Var Her 04. We estimate the quiescent level of the TOAD to be magnitudes below that of the M-star. Based upon the spectral energy distribution and the 2MASS colors, we find the M-star to be an M3.5V dwarf at a distance of 80-130 pc. Based upon its outburst amplitude and quiescent apparent magnitude, we estimate the distance to Var Her 04 to be pc, suggesting that the line-of-sight foreground star is physically unrelated to the cataclysmic variable. All of the Spitzer photometry is consistent with the photospheric emission of the line-of-sight M3.5V star, except for one 24 µm observation obtained after the variable re-brightened. This 24 µm flux density is 75 Jy () above the preceding and following MIPS observations. We tentatively suggest that the mid-infrared brightening of 75 Jy may be associated with a dust formation event in the super-outburst ejecta. Assuming a dust temperature of K, we have estimated the amount of dust required. We find M⊙ of dust is needed, consistent with amounts of mass ejection in TOADs expected during super-outburst, and possibly making TOADs important contributors to the recycling of the interstellar medium.
1 Introduction
Tremendous Outburst Amplitude Dwarf novae (TOADs) consist of a white dwarf primary star and an extremely low-mass main sequence or brown dwarf secondary star (; e.g., Ciardi et al., 1998). With typical orbital periods of a few hours or less, the secondary star is tidally locked to the white dwarf, and overfills its Roche lobe. Material from the secondary star is transferred via the inner Lagrange point to an accretion disk surrounding the white dwarf. As material builds in the accretion disk, instabilities in the accretion disk give rise to rare “super-outbursts,” which, relative to the pre-outburst quiescent luminosity, are a hundred times more luminous than outbursts from normal dwarf novae such as U Gem and SS Cyg (e.g., Harrison et al., 2004). These outbursts are not thermo-nuclear, as is the case for classical novae. Rather, viscous heating causes the disk temperature to rise until ionization of hydrogen occurs, causing a pressure wave to propagate inward, pushing material onto the surface of the white dwarf (Howell, Szkody, & Cannizzo, 1995). The release of gravitational energy powers the super-outburst luminosity, with dramatic brightening of 6 or more magnitudes. Super-outbursts for TOADs occur very infrequently – on timescales of multiple decades.
During the super-outburst, TOADs have winds ( km/s; Howell et al., 1995) which are strong enough to expel material from the binary system much like classical novae (Long et al., 2003), and unlike other types of dwarf novae which rarely display outflows that exceed (or even approach) escape velocity during outburst (e.g., U Gem, SS Cyg). The outburst declines in TOADs typically last a few hundred days and often show a characteristic magnitude dip in the optical near 50 days (Richter, 1992), much like what is seen in the lightcurves of slow novae near 100 days (e.g., Gehrz et al., 1998; Evans, 2003; Evans et al., 2005). In slow novae, the optical dip can be magnitudes deep, and is attributed to the formation of an optically thick dust shell in the ejecta (Smith, Aitken, & Roche, 1994; Evans, 2003; Evans et al., 2005).
In TOADs, the optical dip is suggested to be a dramatic drop in the mass transfer rate from the secondary star on to the outbursting accretion disk, or a cooling wave propagating through the accretion disk, causing a cessation of the outburst. Approximately 10 days later, the dwarf nova re-brightens (Patterson et al., 2002), attributed to a continuation of the outburst, but at lower luminosity (Richter, 1992). However, the evidence for the exact mechanism is sparse.
Given that TOADs have winds strong enough to eject material from the system like classical novae, an alternative explanation of the optical dip might be the formation of dust within the super-outburst ejecta. The V band (0.55 m) light curve for the 1995 super-outburst of the TOAD AL Comae Berenices has an optical dip that is magnitudes deep (Howell et al., 1996), while the corresponding I band (0.9 m) dip is only magnitudes deep (Pych & Olech, 1995) – consistent with the 0.5 magnitude difference between the dust extinction at 0.55 m and 0.9 m (Mathis, 1990). However, no infrared observations to detect the formation of dust during super-outburst have been attempted - until now.
On 2004 June 16, a previously unknown star in Hercules went into outburst (IAUC #, 8363; Price et al., 2004). Photometric observations revealed the presence of superhumps providing a good indication that this was a super-outburst and an estimate for the orbital period. Given the large outburst amplitude and the very short orbital period ( minutes), Var Her 04 was identified as a TOAD. For a given TOAD, super-outbursts are rare (timescales of decades); we took advantage of this timely opportunity to observe the outburst with the Spitzer Space Telescope. We obtained two observations with IRAC (3.0, 4.5, 5.6, 8.0 µm) and four observations with MIPS (24 µm) to investigate for whether dust is formed in the ejecta of TOAD super-outbursts and, hence, possibly explain the observed dip in the optical light curves of TOADs whose origin is a mystery.
2 Spitzer Observations
Four observations were obtained with the 24 µm channel on the MIPS instrument (Rieke et al., 2004), and two observations were obtained with all four channels (3.6, 4.5, 5.8, and 8.0 µm) with the IRAC instrument (Fazio et al., 2004). The first three MIPS observations (hereafter, referred to as MIPS-1, MIPS-2, MIPS-3) were each separated by approximately 30 days beginning on 21 Aug 2004, 67 days after the peak of the outburst. The final MIPS observation (MIPS-4) was obtained in May 2005 almost a full year past the outburst peak. The first IRAC observation (IRAC-1) was obtained between between the second and third MIPS observation, and the second IRAC observation (IRAC-1) was obtained near the time of MIPS-4. Table 1 details the dates and number of days past outburst peak for each of the Spitzer observations.
The operational mode of the Spitzer spacecraft is to observe in advance-scheduled instrument campaigns; i.e., a single instrument for a dedicated period of time. As a result, while our requests of monthly spacing between the observations were generally met, we had no control over exactly when those observations were made. Figure 1 displays a validated V-band lightcurve obtained from the American Association of Variable Star Observers (AAVSO). The times of the MIPS and IRAC observations are marked to indicate when in the outburst the observations were made. As discussed in §3.1, along the line-of-sight to Var Her 04, there is an M-star within 1″ of the variable. None of the photometric measurements presented in this paper (including the AAVSO lightcurve) spatially resolve the foreground M-star from Var Her 04.
After decline from the primary outburst, there are two minor re-brightening ( mag) events peaking at days and days (Fig. 1). The full amplitude of these two re-brightenings is uncertain as the photometry is dominated by the M-star when Var Her 04 is faint. The MIPS-1 observation ( days) was made just prior to the first re-brightening. The MIPS-2 observation ( days) was obtained during decline from the first re-brightening. The IRAC-1 ( days) observation was made 11 days prior to the second re-brightening peak, and MIPS-3 ( days), and the MIPS-3 observation was during decline from the second minor re-brightening. There are no AAVSO validated CCD+V data corresponding to the time of MIPS-3, but interpolation suggests that the lightcurve may have been on a slow decline between and days. The final Spitzer observations (IRAC-2 and MIPS-4) were obtained well after the outburst event had ended, and represent the photometric levels of the foreground M-star (see §3.1 below).
The IRAC data were processed with the S13.2.0 pipelines. The MIPS-1, MIPS-2, and MIPS-3 data were processed with the S10.5.0 pipelines, and the MIPS-4 data were processed with S12.0.2 pipeline. The Basic Calibrated Data (BCD) for each Astronomical Observation Request (AOR) were subsequently mosaiced using MOPEX (Makovoz & Marleau, 2005) to create one single deep image for each of the IRAC and MIPS visits. The total on-source integration time was 570 seconds for each IRAC observation, consisting of 19 dithered 30 second frames. During each MIPS 24 µm observation, Var Her 04 was observed for a total of 3000 seconds, consisting of 20 photometry cycles with an exposure time of 10 seconds per frame. Source identification and aperture photometry was performed using an IDL version of DAOPHOT. Because the MIPS-4 observation was reduced with a slightly different pipeline sequence, only differential photometry was performed on all of the MIPS frames to allow for direct comparison between the visits.
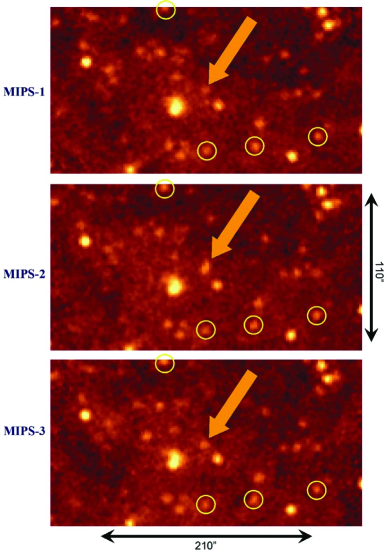
Figure 2 displays “cut-outs” of the MIPS-1, MIPS-2, and MIPS-3 images centered on Var Her 04.111MIPS-4 appears nearly identical to MIPS-1 and MIPS-3, and is not shown. In the figure, the arrows mark the position of the Var Her 04, and the circles indicate the stars used for photometric comparison in the ensemble differential photometry. The equatorial coordinates for each of the comparison stars and the variable are given in Table 2. These comparison stars were chosen because they were within a few arcminutes of Var Her 04, were of comparable brightness to Var Her 04 at 24 µm, and were apparently photometrically stable at 24 µm. The comparison were stars were weighted and combined into an ensemble comparison star (e.g., Everett et al., 2002) and used to perform standard differential photometry on Var Her 04.
3 Discussion
3.1 Distance to Var Her 04 and the Foreground Star
Var Her 04, a super-outbursting TOAD, has an orbital period ( minutes) and a mass ratio () very similar to that of WZ Sge (Price et al., 2004). During its 2001 outburst, WZ Sge had a peak outburst magnitude near mag (Patterson et al., 2002), while Var Her 04 had a peak outburst magnitude of mag (see Figure 1). TOADs have an average outburst amplitude of mag (Howell, Szkody, & Cannizzo, 1995). If we assume that WZ Sge and Var Her 04 have the same intrinsic outburst amplitude (as most TOADs do; e.g., Howell et al., 1995), we can scale the properties of WZ Sge ( pc Harrison et al., 2004) to Var Her 04. At times fainter, the implied distance of Var Her 04 is times further away than WZ Sge for an estimated distance of pc.
There is a foreground star located southeast of Var Her 04. Because of the line-of-sight proximity of the foreground star, all of the photometry presented in this work is an unresolved blend of Var Her 04 and the foreground star. To understand the contribution of the foreground star to our photometry, we retrieved the near-infrared photometry at the position of the foreground star (2MASS J18392619+2604087) from the Two-Micron All Sky Survey (2MASS; Skrutskie et al. 2006) archive. The 2MASS star has near-infrared magnitudes of , , and mag. The quiescent near-infrared brightness for the resolved variable Var Her 04 is mag (Price et al., 2004). Thus, while the 2MASS magnitudes are an unresolved blend between the foreground star and Var Her 04, the variable contributes less than 3% to the total near-infrared brightness, and the magnitudes, as measured by 2MASS, are dominated by the foreground star.
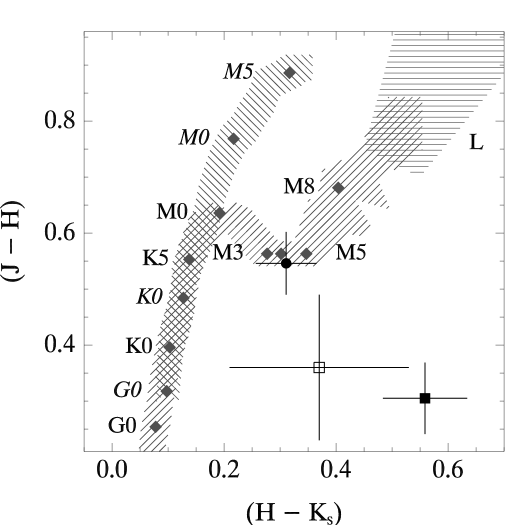
We have plotted the 2MASS colors in the color-color diagram shown in Figure 3. Because of the divergence of the near-infrared colors of giants and main sequence stars for spectral types later than about K5, the 2MASS photometry allows us to identify unambiguously the foreground star as a main sequence object with spectral type M40.5. The near-infrared colors for the short-orbital-period dwarf nova WZ Sge could not be mistaken for those of a normal, low mass main sequence star (see Figure 3). The near-infrared colors of WZ Sge are quite similar to those reported by Price et al. (2004) for the resolved quiescent variable (3).
Comparison of the 2MASS J-band magnitude of the foreground star with the absolute magnitudes expected for M3 – M4 dwarf stars (, Hawley et al., 2002), we find a distance range of pc for the foreground star which is substantially closer than Var Her 04, and suggests that the foreground star is merely line-of-sight and physically unrelated to Var Her 04.
Scaling the quiescent brightness of WZ Sge ( mag, Patterson et al., 2002), Var Her 04 has an expected quiescent brightness of mag, suggesting that the mag floor in Figure 1 (marked by the horizontal dashed line) is not the quiescent level of Var Her 04, but rather is the visual magnitude of the foreground M-star.
With an expected quiescent value of mag and an outburst amplitude of mag, Var Her 04 is similar in brightness to the TOAD AL Comae Berenices ( mag, mag; Howell et al., 1996). AL Com is at a distance of 250 pc (Sproats, Howell, & Mason, 1996), consistent with the distance estimated for Var Her 04 from the peak outburst brightness.
3.2 Mid-Infrared Photometry
The differential lightcurve for the four MIPS observations (Figure 4) clearly shows that at the time of MIPS-2 ( days), Var Her 04 is 75 Jy brighter than it is at the time of MIPS-1, MIPS-3, and MIPS-4. The ensemble comparison does not exhibit the same brightness change, and remains within 1 of the “zero-level.” The MIPS-2 photometric point is away from the zero-level baseline. The brightness level increase in MIPS-2 can be seen by eye in Figure 2. MIPS-4 was obtained days after the outburst event and sets the baseline for the M-star flux density at 24 µm. The agreement of MIPS-1 and MIPS-3 with MIPS-4 implies that the two former observations are primarily of the foreground M-star without a significant contribution from Var Her 04. Only the 24 µm flux density at MIPS-2 is significantly different.
For the two IRAC observations, absolute aperture photometry was performed. The ensemble comparison stars were used to check for changes between the IRAC-1 and IRAC-2 observations, but no significant deviations were detected. As IRAC-2 was obtained long after the outburst event had ended, the agreement between the IRAC-1 and IRAC-2 photometry, separated by over 200 days (see Figure 1), indicates that both IRAC-1 and IRAC-2 are dominated by the foreground M dwarf and contain little (if any) contribution from the Var Her 04.
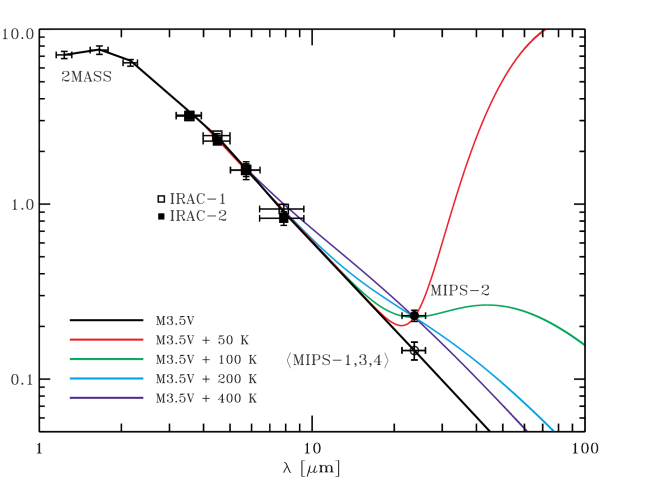
We scaled an empirical template for the 2MASS and IRAC flux densities of an M3.5V star (Patten et al., 2006) to the 2MASS J-band flux density (Figure 5). The resulting reduced chi-square of the M3.5V template fit to the 2MASS-IRAC data is . M3V and M4V templates were also fitted but resulted in significantly worse chi-squares (). The goodness of the M3.5V fit for both the 2MASS and the IRAC data indicates that the IRAC data (like the 2MASS) are dominated by the M3.5V star, with little contribution from Var Her 04.
The MIPS 24 µm differential photometric data (Figure 4) were scaled such that the weighted mean of the MIPS-1, -3,and -4 data equaled the M3.5V template extrapolated to 24 µm. All of the photometry from the four MIPS campaigns and the two IRAC campaigns are reported in Table 3. In the following section, we discuss the source the 24 µm brightening seen in MIPS-2.
3.3 The 24 µm Brightening
Using Figure 1 as a reference, the optical (V) emission begins to rise just again after the MIPS-1 observation ( days) and after the initial decline from the primary outburst. The cause of this re-brightening is unknown but may be a continuation of the outburst event. At days, the V emission peaks and begins to decline again with a minimum near days. The MIPS-2 observation at days is nearly at this minimum.
The MIPS-3 observation ( days) was obtained on a day with no validated AAVSO CCD+V data. However, if we assume that the decline rate in V from days to days equals the climb rate in V from days to days, then the V magnitude at the time of MIPS-3 equals the V magnitude at the time of MIPS-2. In fact, we expect the V-band decline rate to be slower than the V-band climb rate (e.g., AL Com Howell et al., 1996). Thus, the V-band brightness at the time of MIPS-3 is likely brighter than the V-band brightness at the time of MIPS-2. We note here that the true rates of rise and decline and the true depths of the minima are diluted by the presence of the unresolved foreground M-star.
The 24 µm emission associated with MIPS-3 is less than the 24 µm emission at MIPS-2, even though the V magnitudes at the time of MIPS-3 is (likely) brighter than or equal to V magnitude at the time of MIPS-2. Further, the 24 µm emission at MIPS-3 equals the 24 µm emission associated with MIPS-1 and MIPS-4, suggesting that the 24 µm emission observed at MIPS-1, -3, and -4 are dominated by the foreground M-star. Thus, the 24 µm increase observed at days (MIPS-2) occurs, not because Var Her 04 simply has gotten brighter, but rather there is an additional emission source associated with Var Her 04.
It is conceivable that the foreground M-star could have undergone a flare event exactly at the time of the MIPS-2 observation. However, as flare events generally last a few hours or less (e.g., Rockenfeller et al., 2006), the MIPS-2 visit would have to coincide exactly with the flare. Additionally, we inspected the first and second halves of the MIPS-2 data cube to search for variability within the MIPS-2 observation, as might be expected if the M-star had undergone a flare event. We found the photometry of Var Her 04 for the split data to agree within Jy indicating there is no significant change in brightness during the MIPS-2 observation. Consequently, we attribute the 24 µm brightening solely to the variable Var Her 04.
We hypothesize that Var Her 04 may have undergone a dust formation event (near days) during the optical re-brightening event, in a manner very similar to what occurs in slow-novae dust formation events (e.g., Evans et al., 2005). Var Her 04, after a steady decline since peak outburst. Var Her 04 begins to re-brighten ( days). Although the exact rate and level of the decline and full re-brightening is lost in the confusion of the foreground star), typical re-brightening in TOADs is magnitudes (e.g., WZ Sge & AL Com: Richter, 1992; Kuulkers, Howell, & van Paradijs, 1996).
In our hypothesis, the re-brightening event at days may be sufficient to allow dust production to occur (at days), and the amount of dust produced is sufficient to obscure the optical emission from Var Her 04, causing the V magnitude to drop. At days, the dust is at its densest and the optical emission is at a minimum. The exact level of this dip is lost in the glare of the foreground M-star. It is at this conjuncture that the infrared emission from the dust is at its peak brightness (MIPS-2).
The dust shell continues to expand. As the dust dissipates, the optical emission from Var Her 04 is unveiled and the V-band lightcurve re-brightens. As the dust dissipates, the 24 µm emission declines (MIPS-3) and returns to the pre-event level (MIPS-1) which also equals the final quiescent level (MIPS-4). If this proposed scenario is correct, the dust forms and dissipates in approximately days ( days to days).
Without a contemporaneous flux density at a longer wavelength (e.g., 70 µm), we cannot constrain the dust temperature . We can assume, however, a reasonable set of dust temperatures (50, 100, 200, and 400 K). In Figure 5, we display the composite spectral energy distribution with the 50, 100, 200, and 400 K blackbody curves overlayed (recall that the 2MASS and Spitzer photometry does not spatially resolve the foreground star from Var Her 04). The 50, 100, 200, and 400 K blackbody curves predict 70 µm flux densities in outburst of 10, 0.2, 0.03, and 0.02 mJy, respectively.
Without a 70 µm (or longer) flux density, we cannot differentiate between dust temperatures, but we can estimate the amount of dust required to produce the 75 Jy brightening at 24µm for each of these dust temperatures via
| (1) |
where is the observed flux density at frequency , is the grain emissivity at frequency , is the grain radius, is the grain mass density, is the distance to Var Her 04, and is the Planck function at dust temperature . Assuming µm, g cm-3, , and (e.g., Muthumariappan, Kwok, & Volk, 2006), we estimate dust masses of M⊙ for dust temperatures of 50, 100, 200, and 400 K, respectively.
For an outburst amplitude of mag, a typical TOAD accretes approximately M⊙ on to the white dwarf surface during a super-outburst (Osaki, 1996; Cannizzo, 2001). For a re-brightening event of mag, the expected amount of material ejected just from this event may be times less. Even if all of this material is ejected from the white dwarf surface, and all of that material forms dust, there is not enough mass to explain the 24 µm emission if the dust temperature is less than K. However, if a few percent of this material is ejected from the white dwarf surface and condenses into dust grains outside the sublimation radius, the derived dust masses for dust temperatures of K are consistent with the anticipated accretion amounts during a super-outburst event.
Theory predicts that there are 104 - 105 TOADs throughout the Galaxy (e.g., Howell et al., 2001). If each TOAD outbursts, on average, once every 10 years, then there may be 103 - 104 outbursts per year throughout the Galaxy. If each outburst produces M⊙ of dust, this corresponds to M⊙ of dust injected into the interstellar medium per year. On average there is one classical nova per year in the Galaxy, and each classical nova ejects M⊙ of dust into the interstellar medium (Gehrz et al., 1998), perhaps making the total population of TOADs as important as classical novae in the recycling of the interstellar medium.
4 Summary
We have obtained Spitzer MIPS and IRAC observations of the newly discovered Tremendous Outburst Amplitude Dwarf nova (TOAD) Var Her 04 in decline from super-outburst. Four MIPS observations at 24 µm were made spanning 271 days. In addition, two sets of IRAC observations (all four bands) spanning 211 days were also made. All of the Spitzer photometry is consistent with the photospheric emission of a line-of-sight (but physically unrelated) M3.5V star, except for one 24 µm observation obtained after the variable re-brightened. We tentatively suggest that the mid-infrared brightening of 75 Jy may be associated with a dust formation event. We estimate that the amount of dust required to produce such a brightening at 24 µm is only M⊙, consistent with the amount of material expected in super-outburst ejecta. Given the total population of TOADs in the Galaxy, TOADs may be as important as classical novae in terms of their production of dust. A dedicated observing program to study TOADs (that are not spatially confused with foreground stars) in super-outburst is needed to understand more clearly the ejecta processes, and the contribution of TOADs to the recycling of the interstellar medium.
References
- Cannizzo (2001) Cannizzo, J. K. 2001, ApJ, 561, L175
- Ciardi et al. (1998) Ciardi, D. R. et al. 1998, ApJ, 504, 450
- Evans (2003) Evans, A. 2003, Ap&SS, 275, 131
- Evans et al. (2005) Evans, A., et al. 2005, MNRAS, 360, 1483
- Everett et al. (2002) Everett, M. E. 2002, PASP, 114, 656
- Fazio et al. (2004) Fazio, G. G., et al. 2004, ApJS, 154, 10
- Gehrz et al. (1998) Gehrz, R. D., et al. 1998, PASP, 110, 3
- Harrison et al. (2004) Harrison, T. et al. 2004, AJ, 127, 460
- Hawley et al. (2002) Hawley, S. L., et al. 2002, AJ, 123, 3409
- Howell, Szkody, & Cannizzo (1995) Howell, S. B., Szkody, P., & Cannizzo, J. K. 1995, ApJ, 439, 337
- Howell et al. (1995) Howell, S. B. et al. 1995, ApJ, 453, 454
- Howell et al. (1996) Howell, S. B. et al. 1996, AJ, 111, 2367
- Howell et al. (2001) Howell, S. B., Nelson, L. A., & Rappaport, S. 2001, ApJ, 550, 897
- IAUC # (8363) IAU Circular #8363
- Kuulkers, Howell, & van Paradijs (1996) Kuulkers, E., Howell, S. B., & van Paradijs, J. 1996, ApJ, L87
- Long et al. (2003) Long, K. S. et al. 2003, ApJ, 591, 1172
- Makovoz & Marleau (2005) Makovoz, D., & Marleau, F. R. 2005, PASP, 117, 1113
- Mathis (1990) Mathis, J. 1990, ARA&A, 28, 37
- Muthumariappan, Kwok, & Volk (2006) Muthumariappan, C., Kwok, S., & Volk, K. 2006, ApJ, 640, 353
- Osaki (1996) Osaki, Y. 1996, PASP, 108, 39
- Patten et al. (2006) Patten, B., et al. 2006, ApJ, in press (astro-ph/0606432)
- Patterson et al. (2002) Patterson, J. et al. 2002, PASP, 114, 721
- Price et al. (2004) Price, A., et al. 2004, PASP, 116, 1117
- Pych & Olech (1995) Pych, W. & Olech, A. 1995, Acta Astronomica, 45, 385
- Richter (1992) Richter, G. A. 1992, RvMA, 5, 26
- Rieke et al. (2004) Rieke, G. H., et al. 2004, ApJS, 154, 25
- Rockenfeller et al. (2006) Rockenfeller, B. et al. 2006, MNRAS, 367, 407
- Skrutskie et al. (2006) Skrutskie, M. F., et al. 2006, AJ, 131, 1163
- Smith, Aitken, & Roche (1994) Smith, C. H., Aitken, D. K., & Roche, P. F. 1994, MNRAS, 267, 225
- Sproats, Howell, & Mason (1996) Sproats, L. N., Howell, S. B., & Mason, K. O. 1996, MNRAS, 282, 1211
| Observation | UT Date | Days Past Outburst | AOR Key |
|---|---|---|---|
| MIPS-1 | 21 Aug 2004 | 67 | 12000000 |
| MIPS-2 | 22 Sep 2004 | 99 | 12000768 |
| IRAC-1 | 07 Oct 2004 | 114 | 12001024 |
| MIPS-3 | 18 Oct 2004 | 125 | 12001280 |
| IRAC-2 | 06 May 2005 | 325 | 13533696 |
| MIPS-4 | 19 May 2005 | 338 | 13533440 |
| Star | R.A. (J2000) | Dec. (J2000) |
|---|---|---|
| [hh:mm:ss] | [dd:mm:ss] | |
| Var Her 04 | 18:39:26 | 26:04:08 |
| Comparison-1 | 18:39:20 | 26:03:39 |
| Comparison-2 | 18:39:24 | 26:03:32 |
| Comparison-3 | 18:39:26 | 26:03:29 |
| Comparison-4 | 18:39:28 | 26:05:07 |
| Bandpass | Flux Density | Observation |
|---|---|---|
| [m] | [mJy] | ID |
| 1.235 (0.162) | 2MASS J | |
| 1.662 (0.251) | 2MASS H | |
| 2.159 (0.262) | 2MASS Ks | |
| 3.550 (0.75) | IRAC-1 | |
| IRAC-2 | ||
| 4.493 (1.015) | IRAC-1 | |
| IRAC-2 | ||
| 5.731 (1.425) | IRAC-1 | |
| IRAC-2 | ||
| 7.872 (2.905) | IRAC-1 | |
| IRAC-2 | ||
| 23.7 (4.7) | MIPS-1,3,4bbMean of differential photometry from MIPS-1, MIPS3 and MIPS-4 scaled to the M3.5V template. | |
| MIPS-2 |