Mid-infrared Identification of 6 cm Radio Source Counterparts in the Extended Groth Strip
Abstract
A new 6 cm survey of almost 0.6 deg2 to a limit of 0.55 mJy/beam (10) finds 37 isolated radio sources and 7 radio source pairs (not necessarily physical companions). IRAC counterparts are identified for at least 92% of the radio sources within the area of deep IRAC coverage, which includes 31 isolated sources and 6 pairs. This contrasts with an identification rate of 74% to in visible light. Eight of the IRAC galaxies have power law spectral energy distributions, implying that the mid-infrared emission comes from a powerful AGN. The remaining 26 IRAC galaxies show stellar emission in the mid-infrared, probably in most of these galaxies because the stellar emission is bright enough to outshine an underlying AGN. The infrared colors suggest that the majority of these galaxies are bulge-dominated and have redshifts . Visible spectra from the DEEP2 redshift survey, available for 11 galaxies, are consistent with this suggestion. The IRAC galaxies fall into two distinct groups in a color-magnitude diagram, one group (the “stripe”) includes all the AGN. The other group (the “blue clump”) has blue 3.6 to 8 µm colors and a small range of 8 µm magnitudes. This separation should be useful in classifying galaxies found in other radio surveys.
1 Introduction
Radio observations are an excellent way to identify star-forming galaxies and active galactic nuclei (AGN), being subject to fewer selection effects than optical surveys (e.g. obscuration; spectral line contamination). Until recently a large fraction of the most distant known galaxies had first been detected in radio surveys, their nature betrayed by steep radio spectra and faint optical/infrared (opt/IR) counterparts (e.g., van Breugel et al., 1999). Indeed, the discovery by Minkowski (1960) that 3C 295 — an object we shall meet later in this paper — lies at (at that time the most distant known object) was due to its initial detection at 159 MHz and a photometric redshift prediction by Baum (1957) of the kind that is now commonplace (e.g., Blake & Bridle, 2005).
Wide, low-frequency surveys such as 3CR tend to yield associations with bright ellipticals (radio galaxies) and a smattering of radio quasars and BL Lacs (e.g., Spinrad, Marr, Aguilar, & Djorgovski, 1985), whereas at higher frequencies (e.g. 5 GHz) radio quasars become more common. At lower flux densities, around 1 mJy, the source counts steepen: evidence of either primeval radio galaxies (Windhorst, 1986) or that the star-forming galaxies play an increasingly important role (van der Laan, Katgert, Windhorst, & Oort, 1983). Indeed, for low radio luminosities ( W Hz-1) Yun, Hibbard, Condon, & Reddy (1999) argue that the fraction of AGN in radio-selected samples drops to around 10%, as revealed via an excess of radio emission above that predicted by the far-IR/radio correlation (e.g., Helou, Soifer, & Rowan-Robinson, 1985). All of these AGN also reveal their nuclear activity in the mid-infrared or X-ray wavebands.
Determining the nature of faint radio sources is non-trivial. Even the first step — obtaining optical or IR identifications — can be time consuming, a task that ultimately yields little but a slit position for spectroscopic follow up and a very basic measure of stellar mass and star-formation rate, both subject to obscuration by dust for galaxies at high redshift.
This paper presents moderately-deep radio observations of the Extended Groth Strip (EGS) obtained at a wavelength of 6 cm using the Very Large Array. Deeper observations at 20 cm have been obtained (Ivison et al., 2006), but this paper gives an overview of the counterparts of the bright population, those sources we expect to be dominated by AGN. For distant galaxies, the rest-frame near-IR observations provided by Spitzer enable relatively easy identifications and the best possible measure of stellar mass (e.g., Bell & de Jong, 2001) and hence of the likely evolutionary state of a radio galaxy.
Throughout this paper, magnitudes are in the Vega system, and the notation [] means the Vega magnitude at wavelength .
2 VLA Observations
The EGS is a region of sky that includes the original HST WFPC2 Groth Strip Survey. (See Vogt et al. 2005 for details of the original HST survey.) The EGS is centered near J2000 RA=14h 19m 00s Dec=52° 50′ 00″ and covers roughly 2° by 025 at a position angle of 50°. Observations within the EGS (many now being labelled “AEGIS”) include deep optical imaging, deep Spitzer mid-IR imaging (Fazio et al., 2004b; Barmby et al., 2006), and X-ray observations with both Chandra (Nandra et al., 2005) and XMM Newton (Waskett et al., 2003). There is also Keck spectroscopy from the DEEP2 Redshift Survey (Davis et al., 2003) covering the redshift range for normal galaxy types. Not all observations cover the entire strip area. In particular, the Spitzer observations include only a 10′-wide strip centered within the EGS region. Davis et al. (2006) summarize many of the data sets.
We chose to image the EGS with the VLA at 6 cm instead of 20 cm because the bright radio source 3C 295 is located nearby at RA=14h 09m 3349 and Dec=52° 26′ 130 (J2000), only 85 from the southwest corner of the Spitzer coverage in the EGS. At 6 cm, contamination levels are much lower than at 20 cm because 3C 295 is a factor of 3.5 times fainter and 3.3 times farther away in terms of the primary beam size. The shorter observing wavelength makes this survey relatively more sensitive to flat-spectrum radio sources than a 20 cm survey would be.
The observations were obtained at the Very Large Array (VLA) in BnA configuration for a total of 19 hours over 3 days from 2003 October 11–13 (program AW615). This configuration gives wide coverage on the sky with angular resolution similar to that of the IRAC imaging data, as required for identifying IRAC counterparts to the radio sources. At 4.8 GHz the VLA antennas have a primary beam with a FHWM of . The mapping grid contained 74 pointings, spaced apart, providing roughly uniform sensitivity beyond the full Spitzer area in the EGS. Each pointing center was observed for 15 minutes. The observations were carried out in continuum mode with two intermediate frequency (IF) bands, each 50 MHz wide, centered at 4885 and 4835 MHz. The point source VCS2 J1400+6210 (=4C 62.22) was observed for 2 minutes every 17 minutes to provide phase calibrations. Phase stability was sufficient to give astrometric accuracy better than 01 rms. We observed the flux calibrators 3C 286 for 12 minutes on October 12 and 3C 48 for 15 minutes on October 13. No flux calibrator was observed on October 11.
The data were reduced using the AIPS software package. We used TVFLG to ignore bad visibility data with discrepant amplitude values. Flux calibrations were derived from observations of 3C 286 and 3C 48, which gave 1.71 Jy for the flux density of the phase calibrator. Measurements with the two primary calibrators agreed within 2%, which we take as an estimate of the flux calibration uncertainty. We then used 4C 62.22 to provide phase calibrations and amplitudes for the October 11 data. Images containing bright (10 mJy/beam) point sources were self-calibrated.
For each of the 74 pointings we used the IMAGR task in AIPS to create a 2048x2048 pixel image with a pixel scale of 04 per pixel. ROBUST was set to 0, which is an intermediate case between uniform and natural weighting of the sparsely-sampled UV points, and UVTAPER was set to 170 k, effectively de-weighting the A-array elements and reducing the elongation of the synthesized beam. To avoid clean bias we CLEANed the images to a flux level of 260 Jy/beam, corresponding to 4 rms, which typically took 100–200 CLEAN iterations. The 1 rms in these images is 60–70 Jy/beam. Each image is 1365 on a side, larger than the FWHM of the primary beam. The synthesized beam is approximately 10 by 15 at a PA of 25°, but it varies slightly from pointing to pointing. This size is similar to the IRAC FWHM of 17–20 (Fazio et al., 2004a). We also imaged a small region at the location of 3C 295 and found no residual flux with an rms noise of 67 Jy/beam. Thus any artifacts from 3C 295 should be below the 1 level.
For each quarter of the length of the strip, overlapping images were combined into a mosaic using the LINMOS routine in the MIRIAD software package. This routine does a simple linear mosaicing. In the four mosaic images, within the FWHM of the overlapping primary beams, the rms noise is 42 Jy/beam. Initial source detection was performed on these mosaic images using SExtractor with a threshold of 143 Jy/beam. Each potential source was then checked in the original images (not mosaics), and sources below 10 were removed from the list. This conservative detection limit was needed to avoid spurious sources; many 5 bumps are real, but many are sidelobes caused by the limited UV coverage. Many radio surveys with better sensitivity are available, including in the EGS (Ivison et al., 2006), and the purpose of this paper is best served by maximizing reliability. We used the AIPS task JMFIT to determine final sources positions and flux densities and corrected the latter for delay beam distortions (Condon et al., 1998).
3 Radio Source Counterparts
Altogether 51 radio components (some of which may be radio doubles) were detected in an area of 0.5735 deg2 (the 50% primary beam limit). This agrees well with the number of sources expected on the basis of previous surveys (45, based on an average sensitivity limit of 0.55 mJy/beam — Ciliegi et al. 2003). Table 1 lists the source catalog and parameters of each source: name,111Radio sources from this paper are named EGS06 followed by the cardinal number given in Table 1. The ‘06’ in the name refers to the observation wavelength in centimeters. position, primary beam correction, corrected total flux density, and deconvolved angular size if the source is resolved. For source pairs, components are listed separately regardless of the likelihood of physical association. Table 1 includes 37 isolated sources and seven pairs with separations in the range 3″ to 13″. For three cases (10/11, 17/18, and 50/51), the radio morphology is that of a classical double. For the other five cases, we cannot tell from the radio morphology alone whether they are classical doubles or separate sources. For the closest pairs, where the two components might be blended at the VLA resolution, combined flux densities are given as well as separate ones for each component.
Fomalont et al. (1991, hereafter FWKK) surveyed a small part of the present EGS field to much deeper flux density, a completeness limit of 25 Jy at 5 GHz. They found 8 sources within our coverage area and with flux densities greater than 0.2 mJy. Table 2 compares our results with those of FWKK. Our survey detected the four sources with the highest flux densities but not the four faintest, as expected. For the seven pointlike sources, flux densities or upper limits agree within the uncertainties except perhaps for EGS06 23=15V70, which might have varied in the 14 years between surveys. Source 21=15V10 is extended, and it is hard to make a direct comparison between the two surveys because they used different VLA configurations. All in all, the two surveys agree within their limited area of overlap.
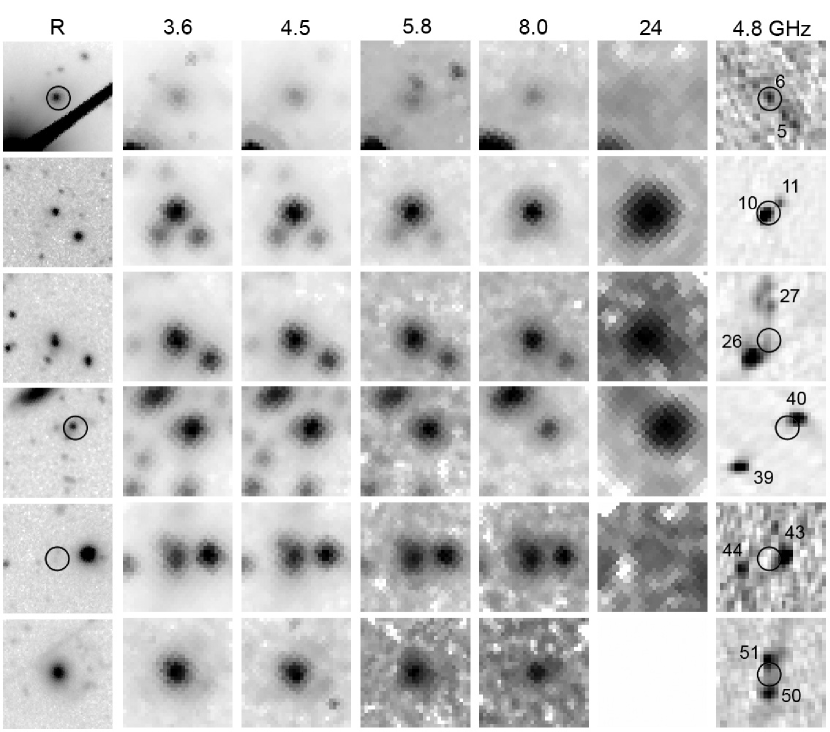
The position of each radio source was examined in the IRAC 3.6 to 8 µm images of the EGS. These images have angular resolution (FWHM) of 2″ and 5 sensitivities 0.9 to 6.2 Jy (Barmby et al., 2006; Davis et al., 2006). Eight radio sources or pairs are outside the IRAC coverage area.222 Some of the sources “outside the IRAC area” have a few IRAC frames covering the position, but data are noisy and affected by cosmic rays. Sources 5/6 show an IRAC source at the position of the northern radio component (6) but nothing close to the southern one (5) (which may be slightly extended or double in the radio). This could be a double radio source with very different lobe distances from the host galaxy, or the radio sources could be unrelated with only the northern one having an IRAC counterpart, or the southern radio source, which has low signal-to-noise, might not be real. Most likely is that the IRAC observations are not deep enough to detect the true counterpart; despite that, we show the data for the source near EGS06 6 in tables and figures. Sources 17/18 have a faint IRAC source at 3.6 and 4.5 µm (2.7 and 3.7 Jy respectively) 09 north of the northern source (18), but we do not consider this a detection of a counterpart. Because the radio morphology is that of a classical double, we would expect the counterpart to be between the radio lobes. Source 32 and 48 have IRAC sources nearby but too far from the radio positions to be deemed counterparts. Deeper IRAC data would be needed to say more about these sources. Of 31 isolated radio sources inside the IRAC coverage area (first part of Table 1), 28 have IRAC counterparts within 08, and the other three have no IRAC counterpart closer than 12. We consider the first group identified and the second group not. Trials with random positions suggest about 1.5% chance of an IRAC source within 08 of a given position; i.e., zero to one of the IRAC counterparts may be spurious on this basis. However, most of the proposed counterparts have flux densities well above the IRAC survey limit, and spurious matches involving such bright sources are far less likely. Of five possible source pairs with IRAC coverage (second part of Table 1), the two pairs with radio morphology of classical doubles both have an IRAC source between the two radio components, as expected.333 IRAC exposure time for 50/51 is only 1/10 normal, but the source has high flux density and was reliably detected. However cosmic rays badly affect the 5.8 µm photometry. Thus for 33 “easy” cases, we find IRAC counterparts for 30, an identification rate of 91%.
The three additional radio source pairs are more difficult to assess. Source 26 is pointlike, but the nearby northern radio source (#27) shows multiple sub-components. An IRAC source is 41 northeast of the southern radio source. (See Figure 1.) We consider this a valid counterpart to a likely radio double, despite the IRAC galaxy not being centered between the two radio sources. Radio sources 39/40 have wide separation, and there are additional, faint IRAC sources in the field. Any interpretation is uncertain, but we deem the brightest IRAC source, located between the two radio sources, a valid counterpart to a radio double. There is an IRAC source between sources 42/43, 26 from #43. On higher resolution red images from Subaru, this source is double with separation 14. We consider this a likely counterpart to the 42/43 pair. Thus our best guess is that we have three IRAC counterparts to three radio doubles and an overall identification rate of . While these three identifications are uncertain, they won’t change subsequent conclusions of this paper. IRAC positions are listed in Table 3.
The high identification rate (90%) in the infrared contrasts with a much lower rate that would be found in visible light. Only 24 radio sources have counterparts in the DEEP2 catalog (, Davis et al. 2003; see also Coil et al. 2004 and http://deep.berkeley.edu/), and of these, only 12 are brighter than . The faintness of the counterparts to 5 GHz radio sources found here contrasts with the results of a 1.4 GHz survey (Mobasher et al., 1999), where half the radio sources were found to have visible counterparts with . A more direct but smaller comparison sample is a 5 GHz survey in the Lockman Hole (Ciliegi et al., 2003). In that survey, of 12 radio sources with mJy, 8 have counterparts with , although Ciliegi et al. accepted larger position offsets than we do. In contrast, we find counterparts that bright in for only 14 of the EGS radio sources (with mJy). Considering that the radio surveys have different depths, different wavelengths, different counterpart identification criteria, and are done in different regions of sky, there are probably no major inconsistencies in the fraction of counterparts optically identified.
Photometry of each IRAC counterpart was done on the four IRAC images and the MIPS 24 µm image.444Sensitivity at 70 and 160 µm was not sufficient to say anything useful about individual sources. (The MIPS images are also described by Barmby et al. 2006.) A center position was measured on whichever image offered the best signal to noise ratio (usually 3.6 µm but sometimes longer wavelengths), and the IRAF task apphot was used to measure flux in a 52 diameter beam. Sky was measured in an annulus of radius between 17′′ and 24′′, though the exact choice did not matter. The IRAC sources are all pointlike, and flux densities are given in Table 4 based on the point source calibration. Except for sources near the edge of coverage (indicated in Table 4), all the detected counterparts are bright relative to the limiting magnitude of the images, and statistical uncertainties (given in the last row of Table 4) are small. Systematic uncertainties, due for example to centering errors or companion sources, are typically 5% but can reach 10% for objects with nearby companions. Calibration uncertainty is about 3% (Reach et al., 2005).
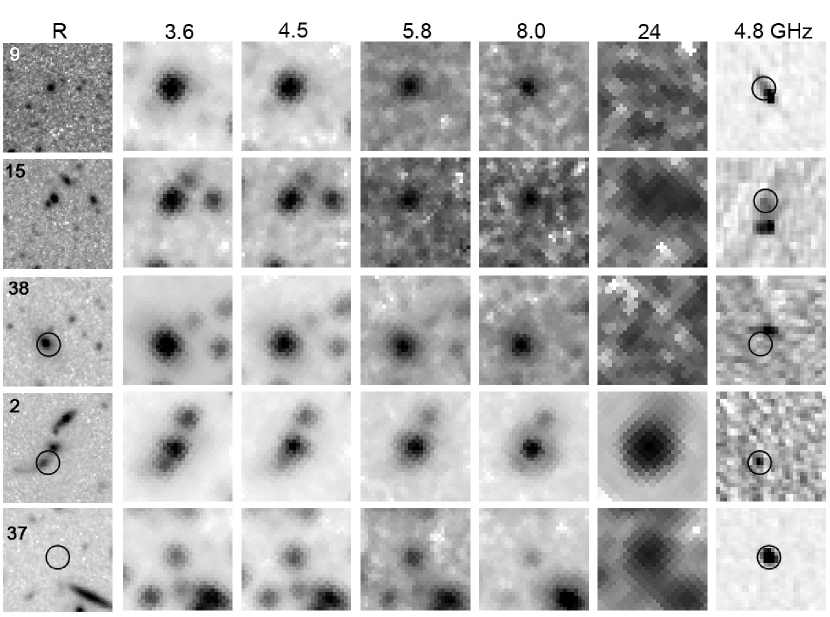
Within the well-observed IRAC region, there are only three radio sources that may not have IRAC counterparts. Fig. 2 shows thumbnails of these. Sources 9 and 15 show faint radio extensions to the northeast and north, respectively. In each case, there is an IRAC and MIPS source within the radio extension 18 and 41 respectively from the radio peak positions.555 Source 9 has full-depth IRAC coverage. Upper limits for a counterpart coincident with the radio peak are 0.9 Jy at 3.6 and 4.5 µm and 6 Jy at 5.8 and 8 µm, 5. Source 15 is closer to the edge of the IRAC coverage; exposure time is about 1/3 normal at 3.6 and 5.8 µm and about 60% of normal at 4.5 and 8.0 µm with detection limits correspondingly higher. While these sources could be the radio counterparts, establishing them as such would require more evidence. Source 38 shows a bright galaxy (167 Jy at 3.6 µm) located 26 southeast of the radio position.666 This position has full-depth IRAC coverage. The high-resolution image shows a much fainter galaxy () 14 northwest of the bright one, 12 east of the radio source peak and within an eastward radio extension. This faint galaxy could be the counterpart, but at the low angular resolution of the infrared images it is difficult to distinguish from the bright galaxy nearby. The bright galaxy itself is extremely red, having . It could perhaps be the radio counterpart, but the large offset from the radio position would be difficult to explain.
If there are radio sources without IRAC counterparts, they are unlikely to be local galaxies (cf., Masci et al., 2001). Gruppioni, Oliver, & Serjeant (2001) suggested that radio sources with no counterparts in deep optical surveys are likely to be early-type galaxies at . However, the absence of an IRAC counterpart for these galaxies is difficult to explain. At , the IRAC 3.6 µm detection limit 0.7 Jy corresponds to a stellar luminosity of order L⊙, and such low luminosity galaxies are unlikely to harbor powerful radio sources. Even at , a galaxy with L⊙ should have been detected at 4.5 µm. Any radio sources without IRAC counterparts are thus either less luminous or more distant than these limits.
4 Discussion
Spectral energy distributions (SEDs) indicate the type of galaxy and likely redshift range. Apparent magnitude is also a good distance indicator for radio galaxies (e.g., Fig. 1 of van Breugel et al., 1999). Fig. 3 shows an IRAC color-magnitude diagram for the radio source counterparts. There are two distinct groups of galaxies. One group, the “blue clump,” is brighter than and quite blue (. A second group follows a distinct “stripe” from faint and blue to bright and red. Similar, though less distinct, separations are present in other C-M diagrams.
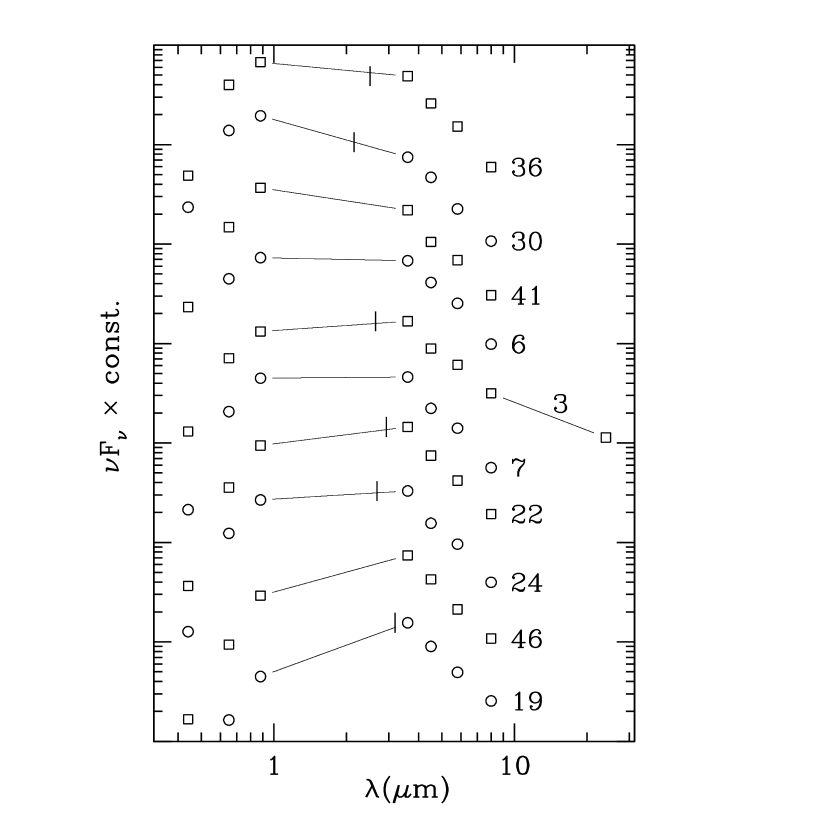
Eight of the radio source counterparts have distinct power law SEDs (Fig. 4): nearly a straight line in the log-log plot. (Davis et al. 2006 describe the BRI data used in the SED plots.) All these sources have spectral index (). Such SEDs are signatures of powerful AGN or QSOs (e.g. Elvis et al., 1994). Two of these galaxies are confirmed spectroscopically as broad-line AGN (Table 3); there are no spectra for the other six. All eight of the power-law galaxies are red in the [3.6][8.0] color and fall along the “stripe” in the C-M diagram with the brightest AGN being the reddest. This may represent the combined effects of AGN luminosity and galaxy distance. Luminous, nearby AGN have little contribution from starlight at 8 µm and are therefore bright and red. Less luminous AGN are fainter, and the greater contribution of starlight relative to the AGN makes the color bluer. More distant AGN are also fainter, but because the observed radiation emerged at shorter wavelength in the galaxy’s rest frame, starlight makes a bigger contribution than for nearby galaxies.
Two other galaxies occupy the stripe region of the C-M diagram along with the AGN. One of them (#2) is a component of a dusty, interacting system. The infrared component corresponding to the radio source has a near power-law SED (Fig. 5) but with an upturn at 3.6 µm. This component could be an AGN with contribution from starlight at the shortest wavelength. Fig. 2 shows thumbnail images of this source.
The other source in the stripe, #37, is unusual. It is easily detected in all IRAC bands with a flat SED (Fig. 5), but it is invisible on I-band HST images (, 0.04Jy). The source is bright at 24 µm and has the second-highest radio flux density in the survey. One possibility is that #37 is a dusty galaxy at , consistent with the color and the 1.6 µm stellar emission peak being observed near 5 µm (Fig. 5). The observed 24 µm would then come from the PAH emission features at rest 6–8 µm, and the faint V and I magnitudes could be attributed to a combination of the Balmer spectral break and heavy dust reddening. Higdon et al. (2005) reported finding four radio sources with similar 24 µm flux densities and upper limits in visible light, but #37 has much higher radio flux density than any of the Higdon et al. sources. Houck et al. (2005) gave redshifts for 17 MIPS sources, but only one would have been detectable in our radio survey. That source (their #13 at ) is ten times brighter at 24 µm but perhaps eight times fainter at 6 cm (guessing a radio spectral index of ) than our #37. An alternative possibility is that #37 could be similar to extreme radio galaxies reported by van Breugel et al. (1999) and Waddington et al. (1999). If the intrinsic color is not extreme and the usual magnitude-redshift relation (van Breugel et al., 1999) applies, the magnitude suggests but is consistent with redshift as large as 5.
The galaxies in the “blue clump” in the color-magnitude diagram are all well above the sensitivity limit of the IRAC data. Waddington et al. (2000) identified counterparts of radio galaxies found at 1.4 GHz and found a peak in 2.2 µm number counts at . This peak almost certainly represents the same population as the blue clump, but Waddington et al. could say little about these galaxies without data at longer wavelengths. The blue clump galaxies have SEDs consistent with normal galaxies (Figs. 6–8). The color-color diagrams in Figs. 9 and 10 compare these galaxies to the colors of typical spiral and elliptical galaxies. Most of the galaxies have as indicated by the color tracks in Figs. 9 and 10, primarily the color. The 3.6 µm magnitudes of the blue clump galaxies range from 14.5 to 16.5, consistent with the redshift-K relation (van Breugel et al., 1999) for and the expected at these redshifts. If , and assuming a radio spectral index not far from the usual , the radio power emitted at 1.4 GHz is 1024 W Hz-1. Such high radio luminosity indicates an AGN, consistent with the findings of Hammer et al. (1995) and Mobasher et al. (1999) in their radio surveys. Benn et al. (1993) found a much larger fraction of star-forming galaxies, but their data apply to fainter radio flux densities and brighter optical magnitudes, hence lower redshifts, than the sources studied here. The absence of an obvious power law emission component in the mid-infrared implies that the active nucleus is either obscured or has such low luminosity that it does not dominate the near infrared SED of the galaxy. Barmby et al. (2006) found that 60% of X-ray selected AGN also lack a dominant mid-IR power law component. No doubt similar galaxies exist at larger redshifts than are detected here, but they are below the detection limit of the radio survey because of the strong K-correction as well as inverse-square dimming.
The galaxy classes separated in the color-magnitude diagram also show different ratios of radio to near-infrared flux density. Fig. 11 shows that for a given radio flux density, the blue clump galaxies tend to be brighter at 3.6 µm than the stripe galaxies. Georgakakis et al. (1999, their Fig. 12) found that the radio sources with the highest flux densities (which are the only ones our survey could have detected) tended to be AGN and absorption systems (i.e., ellipticals) rather than star-forming galaxies. Presumably the radio emission comes from an AGN in these types. Masci et al. (2001) also found radio emission larger than expected from star formation alone in their radio sample. If radio flux density indicates “AGN power,” Fig. 11 suggests that the clump galaxies contain a large stellar population that outshines the underlying AGN. Further observations (and in particular redshifts) will be needed to determine whether the “blue clump” and “stripe” populations differ in fundamental ways or are simply the result of varying ratios of AGN to stellar light.
Photometric classification of galaxies is an uncertain business at best, but Figs. 9 and 10 show there is a tendency for more blue-clump galaxies to fall close to the elliptical than the spiral colors. The colors also provide very rough photometric redshifts. Figs. 6 and 7 illustrate the SEDs. In all cases where DEEP2 spectroscopy is available, it confirms the photometric classifications.777Most of the spectra were not yet available when the photometric classifications were made, so this is not a case of “knowing the answer in advance.” The spectra exhibit three main classes:
-
1.
An old stellar population (labelled “old” in Table 3). These galaxies show calcium H and K lines in absorption and often the G band, consistent with high luminosity, early-type galaxies. A few of these galaxies show weak [O II] emission lines indicative of some recent star formation or LINER activity, but the colors are red (0.33), suggesting that the star formation or nuclear activity has had little effect on the bulk of the stellar population. Of the ten galaxies in Fig. 6, the six that have spectra are all of old type.
-
2.
Three galaxies show strong Balmer absorption lines typical of A stars; these galaxies are labelled “post-SB” (post-starburst) in Table 3. All three are in the blue clump and have colors resembling the spiral template. (See Fig. 7.) One of the three galaxies (#39/40) also shows [Ne V] emission lines characteristic of AGN. Its SED shows a rise at 8 µm, which may be the signature of a power-law spectral component.
-
3.
Three galaxies show AGN emission lines. Two with broad emission lines show power law SEDs (Fig. 4), and the third is #39/40 mentioned above.
Appendix A gives details of all the spectra. The apparent numbers of ellipticals and spirals are consistent with previous results (Georgakakis et al., 1999; Gruppioni, Mignoli, & Zamorani, 1999; Ciliegi et al., 2003; Richards et al., 1998; Chapman et al., 2003). The prevalence of early-type, i.e., not star forming, galaxies adds weight to our suggestion that the radio sources arise from active nuclei, not starbursts. Despite the good agreement between photometry and spectra as regards galaxy type, there is one discrepancy in the redshift order. Source 3 has a higher redshift than #22 according to color, but spectroscopy shows the opposite. This should serve as a warning to be cautious about classifications or redshifts derived from limited photometry. Nevertheless, the spectroscopic redshifts confirm the general redshift range derived from colors and magnitudes.
Another indicator of nuclear activity is X-ray emission (Mushotzky, 2004). Published X-ray observations with Chandra (Nandra et al., 2005) and XMM-Newton (Waskett et al., 2003) cover part of the EGS (Barmby et al., 2006). Six radio sources are within the area covered by both Chandra and XMM: four (EGS06 14/22/23/24) are not detected in X-rays. Source 19 is coincident with Chandra source 83 but is not detected by XMM; source 21 coincides with Chandra source 55 and XMM source 53. Eight radio sources (eleven components) are within the area covered by XMM alone: six (EGS06 12/13/15/17/18/20/26/27) are not detected in X-rays, but EGS06 10/11 and 16 are coincident with XMM sources 5 and 43, respectively. The X-ray/radio coincidence rate is therefore 4/14, or 29%. EGS06 10/11 has the highest radio flux density in the sample and is a definite AGN from its SED. The other three X-ray-detected sources are clump sources with no obvious distinction from the other clump sources except that #16 shows modest excess emission at 8 µm that might be attributed to an AGN power law. The ratio of 24 µm flux density to soft X-ray flux puts all four X-ray sources into the AGN category by an order of magnitude (Weedman, Charmandaris, & Zezas 2004; in their units). EGS06 10/11 and 23 are the only radio sources in the X-ray area whose IRAC SEDs are AGN-like. A possible explanation for the X-ray non-detection of 23 is obscuration, as found by Donley et al. (2005) for “radio-excess AGN.” Detection of radio sources that are likely to be AGN yet do not show X-ray emission is additional evidence that no single-wavelength survey can produce a complete list of AGN.
5 Conclusions
IRAC images are a powerful means of identifying and classifying radio sources. Deep IRAC images identify counterparts to at least 92% and possibly 100% of 0.5 mJy radio sources. Many of the counterparts have very red visible to mid-infrared colors, underscoring the difficulty of identification at shorter wavelengths. The radio sources are likely to arise from powerful AGN, but only about 25% show a typical AGN power-law component that dominates the mid-infrared emission. For about 70% of the counterparts, galaxy starlight dominates the mid-infrared emission. The starlight-dominated galaxies can be identified by their blue IRAC colors. These “blue clump” galaxies show a small range of apparent magnitude, suggesting a relatively small range of redshift for this galaxy type in this survey. The small range is probably a combination of the radio survey sensitivity limit and relative rarity at low redshift of galaxies hosting powerful radio sources. The separation into “stripe” and “blue clump” galaxies should be useful in classifying galaxies found in other radio surveys.
Appendix A Details of DEEP2 Visible Spectra
Spectra are all of good quality. Whenever the [O II] doublet is seen with good S/N, the lines have velocity widths too broad for a clean separation of the doublet components, which are 220 km s-1 apart. The implied large internal kinematics are consistent with the prevailing view that radio sources are hosted by a massive galaxies.
For each object that has a spectrum, the DEEP2 catalog number, mask, and slit identifications are listed in parentheses followed by a brief description of the spectrum. Objects are identified by their EGS06 numbers as given in Tables 1 and 3.
3: (11021233, mask 1101, slit 111) Absorption spectrum characteristic of old population shows Ca HK, H, G band, H, and Mg b.
19: (12007962, mask 1245, slit 85) The absorption line spectrum showing Ca HK is consistent with an old stellar population; moderate-strength [O II] emission is also seen.
21: (12012467, mask 1243, slit 88) Moderate strength [O II] is seen along with moderately strong Balmer absorption lines of H and H. Spectral type is between an old and post-starburst stellar population.
22: (12012898, mask 1205, slit 107) Excellent match to an old stellar population template through H and [O III]; [O II] emission is visible but of too low S/N to estimate a velocity width.
24: (12016405, mask 1209, slit 72) Excellent match to an old stellar population template from Ca H through Mg b; [O II] is out of spectral range.
28: (12020403, mask 1210, slit 97) AGN signatures are seen with Mg II, [Ne V], and [O II] all in emission and broad. Two sets of strong Mg II absorption are superimposed with one that is close to the redshift defined by the [O II] emission line and another that is shifted to the red (perhaps from infalling gas) by about 300 km s-1. There is also a ”foreground” Mg II absorption doublet seen at redshift z=1.38; candidates for its source may be among galaxies seen in the field at separations of about 3″.
30: (13004312, mask 1300, slit 73) Good match to a pure absorption-line old stellar population over the wavelength range from near H through H.
36: (13025514, mask 1309, slit 49) Excellent match to a pure old stellar population over the wavelength range from the G band through Na I. Faint continuum of another spectrum 2″ away shows a slight absorption at the G band. Being at the same redshift as that of the radio galaxy, this feature suggests that we may be watching a minor merger.
44: (13058191, mask 1315, slit 121) Excellent S/N continuum shows unusually strong Balmer absorption indicative of a post-starburst. [O II] is outside the spectral range, and the red end is past Mg b. H and H emission lines are also seen; they appear tilted in the 2-D spectrum and are spatially asymmetric. Moreover, the H emission is redshifted by several 10’s of km s-1 with respect to its absorption, consistent with a possible inflow of ionized gas. [O III] lines are not seen. The r image shows no companions within 3″.
10/11: (11045619, mask 1114, slit 83) The spectrum has broad emission lines of Mg II and [Ne V], as well as strong Mg II and Mg I in absorption. If the emission lines of [Ne V] are used as a reference, these absorption lines of Mg II show a redshift by 150 km s-1, while a much weaker set of Mg II absorption lines appear with a blueshift of over 500km/s.
39/40: (13032337, mask 1313, slit 30) The spectrum has excellent S/N and shows unusually strong Balmer absorption lines that are characteristic of post-starbursts. Strong [Ne V] emission lines at 3345Å and 3426Å characteristic of AGN along with strong [O II] are also detected with velocity dispersions of about 200 km s-1. This AGN/starburst spectrum is flanked by two other spectra a few arcsecs away and at slightly lower redshifts by about 100 km s-1. One shows narrow (unresolved) emission lines of [O II], H, and H, while the other shows broader lines ( km s-1) of [O II] and [Ne III]. Yet another flanking feature is weak detection of [O II] emission at redshift z=1.42, presumably from a background (possibly lensed) galaxy. The r image shows at least four other galaxies at separations 3″.
References
- Barmby et al. (2006) Barmby, P., et al. 2006, ApJ, 642, 126
- Baum (1957) Baum, W. A. 1957, AJ, 62, 6
- Bell & de Jong (2001) Bell, E. F., & de Jong, R. S. 2001, ApJ, 550, 212
- Benn et al. (1993) Benn, C. R., Rowan-Robinson, M., McMahon, R. G., Broadhurst, T. J., & Lawrence, A. 1993, MNRAS, 263, 98
- Blake & Bridle (2005) Blake, C., & Bridle, S. 2005, MNRAS, 363, 1329
- Chapman et al. (2003) Chapman, S. C., et al. 2003, ApJ, 585, 57
- Ciliegi, Gruppioni, McMahon, & Rowan-Robinson (2001) Ciliegi, P., Gruppioni, C., McMahon, R., & Rowan-Robinson, M. 2001, Ap&SS, 276, 957
- Ciliegi et al. (2003) Ciliegi, P., Zamorani, G., Hasinger, G., Lehmann, I., Szokoly, G., & Wilson, G. 2003, A&A, 398, 901
- Ciliegi et al. (2005) Ciliegi, P., et al. 2005, ArXiv Astrophysics e-prints, arXiv:astro-ph/0506690
- Coil et al. (2004) Coil, A. L., Newman, J. A., Kaiser, N., Davis, M., Ma, C.-P., Kocevski, D. D., & Koo, D. C. 2004, ApJ, 617, 765
- Condon et al. (1998) Condon, J. J., Cotton, W. D., Greisen, E. W., Yin, Q. F., Perley, R. A., Taylor, G. B., & Broderick, J. J. 1998, AJ, 115, 1693
- Davis et al. (2003) Davis, M., et al. 2003, Proc. SPIE, 4834, 161
- Davis et al. (2006) Davis, M., et al. 2006, ApJ, in press.
- Donley et al. (2005) Donley, J., Rieke, G. H., Rigby, J. R. & Pérez-González, P. G. 2005, ApJ, in press (astro-ph/0507676)
- Elvis et al. (1994) Elvis, M., et al. 1994, ApJS, 95, 1
- Fazio et al. (2004a) Fazio, G. G., et al. 2004, ApJS, 154, 10
- Fazio et al. (2004b) Fazio, G. G., et al. 2004, ApJS, 154, 39
- Fomalont et al. (1991) Fomalont, E. B., Windhorst, R. A., Kristian, J. A., & Kellerman, K. I. 1991, AJ, 102, 1258 (FWKK)
- Georgakakis et al. (1999) Georgakakis, A., Mobasher, B., Cram, L., Hopkins, A., Lidman, C., & Rowan-Robinson, M. 1999, MNRAS, 306, 708
- Gonzalez-Solares et al. (2005) Gonzalez-Solares, E. A., et al. 2005, MNRAS, 358, 333
- Gruppioni, Mignoli, & Zamorani (1999) Gruppioni, C., Mignoli, M., & Zamorani, G. 1999, MNRAS, 304, 199
- Gruppioni, Oliver, & Serjeant (2001) Gruppioni, C., Oliver, S., & Serjeant, S. 2001, Ap&SS, 276, 791
- Gruppioni et al. (2003) Gruppioni, C., Pozzi, F., Zamorani, G., Ciliegi, P., Lari, C., Calabrese, E., La Franca, F., & Matute, I. 2003, MNRAS, 341, L1
- Hammer et al. (1995) Hammer, F., Crampton, D., Lilly, S. J., Le Fevre, O., & Kenet, T. 1995, MNRAS, 276, 1085
- Higdon et al. (2005) Higdon, J. L., et al. 2005, ApJ, 626, 58
- Helou, Soifer, & Rowan-Robinson (1985) Helou, G., Soifer, B. T., & Rowan-Robinson, M. 1985, ApJ, 298, L7
- Houck et al. (2005) Houck, J. R., et al. 2005, ApJ, 622, L105
- Hopkins et al. (1999) Hopkins, A., Afonso, J., Cram, L., & Mobasher, B. 1999, ApJ, 519, L59
- Ivison et al. (2006) Ivison, R. J., Chapman, S. C, Faber, S. M., Smail, I., Biggs, A. D., Conselice, C. J., Wilson, G., Salim, S., Huang, J.-S., & Willner S. P. 2006, ApJ, submitted.
- Masci et al. (2001) Masci, F. J., et al. 2001, PASP, 113, 10
- Minkowski (1960) Minkowski, R. 1960, ApJ, 132, 908
- Mobasher et al. (1999) Mobasher, B., Cram, L., Georgakakis, A., & Hopkins, A. 1999, MNRAS, 308, 45
- Mushotzky (2004) Mushotzky, R. 2004, in ASSL Vol. 308: Supermassive Black Holes in the Distant Universe, ed. A. Barger (Kluwer Academic, Dordrecht), 53
- Nandra et al. (2005) Nandra, K., Laird, E. S., Adelberger, K., Gardner, J., Mushotzky, R. F., Rhodes, J., Steidel, C. C., Teplitz, H. I., & Arnaud, K. A. 2005, MNRAS, 356, 568
- Norris et al. (2001) Norris, R. P., et al. 2001, Deep Fields, Proc. ESO/ECF/STScI Workshop, Springer, p. 135
- Reach et al. (2005) Reach, W. T., et al. 2005, PASP, 117, 978
- Richards et al. (1998) Richards, E. A., Kellermann, K. I., Fomalont, E. B., Windhorst, R. A., & Partridge, R. B. 1998, AJ, 116, 1039
- Schinnerer et al. (2004) Schinnerer, E., et al. 2004, AJ, 128, 1974
- Spinrad, Marr, Aguilar, & Djorgovski (1985) Spinrad, H., Marr, J., Aguilar, L., & Djorgovski, S. 1985, PASP, 97, 932
- Stern et al. (2005) Stern, D. et al. 2005, ApJ, in press.
- van Breugel et al. (1999) van Breugel, W., De Breuck, C., Stanford, S. A., Stern, D., Röttgering, H., & Miley, G. 1999, ApJ, 518, L61
- van der Laan, Katgert, Windhorst, & Oort (1983) van der Laan, H., Katgert, P., Windhorst, R., & Oort, M. 1983, IAU Symp. 104: Early Evolution of the Universe and its Present Structure, 104, 73
- Vogt et al. (2005) Vogt, N. P., et al. 2005, ApJS, 159, 41
- Waddington et al. (1999) Waddington, I., Windhorst, R. A., Cohen, S. H., Partridge, R. B., Spinrad, H., & Stern, D. 1999, ApJ, 526, L77
- Waddington et al. (2000) Waddington, I., Windhorst, R. A., Dunlop, J. S., Koo, D. C., & Peacock, J. A. 2000, MNRAS, 317, 801
- Waskett et al. (2003) Waskett, T. J., Eales, S. A., Gear, W. K., Puchnarewicz, E. M., Lilly, S., Flores, H., Webb, T., Clements, D., Stevens, J. A., & Thuan, T. X. 2003, MNRAS, 341, 1217
- Weedman, Charmandaris, & Zezas (2004) Weedman, D., Charmandaris, V., & Zezas, A. 2004, ApJ, 600, 106
- Windhorst (1986) Windhorst, R. A. 1986, Highlights in Astronomy, 7, 355
- Yun, Hibbard, Condon, & Reddy (1999) Yun, M. S., Hibbard, J. E., Condon, J. J., & Reddy, N. 1999, Ap&SS, 266, 29


| Name | RA | Dec | PB | Stot | Size(″) | Comments |
|---|---|---|---|---|---|---|
| EGS06 | J2000 | corr | mJy | maj min | ||
| Isolated sources | ||||||
| 1 | 14 15 03.92 | 52 01 06.5 | 1.14 | |||
| 2 | 14 14 33.36 | 52 02 53.1 | 1.12 | |||
| 3 | 14 14 36.75 | 52 05 03.1 | 1.02 | 0.6 0.3 | ||
| 4 | 14 15 08.83 | 52 06 42.2 | 1.16 | |||
| 7 | 14 16 15.07 | 52 11 21.6 | 1.00 | |||
| 8 | 14 16 11.86 | 52 12 04.8 | 1.02 | 0.6 0.2 | ||
| 9 | 14 15 36.84 | 52 14 09.7 | 1.15 | 5.0 1.0 | pa 40° | |
| 12 | 14 16 08.06 | 52 24 58.5 | 1.24 | 1.0 0.5 | outside IRAC area | |
| 13 | 14 16 21.88 | 52 25 03.3 | 1.06 | 0.9 0.3 | ||
| 14 | 14 17 59.29 | 52 25 54.0 | 1.39 | 0.6 0.2 | ||
| 15 | 14 16 30.12 | 52 27 01.1 | 1.15 | 5.0 1.0 | peak flux position, extended to north | |
| 16 | 14 16 27.95 | 52 27 07.1 | 1.21 | |||
| 19 | 14 17 49.20 | 52 28 03.1 | 1.13 | 1.1 0.3 | ||
| 20 | 14 16 23.30 | 52 28 27.2 | 1.41 | outside IRAC area | ||
| 21 | 14 17 32.63 | 52 32 03.1 | 1.04 | 1.9 0.8 | ||
| 22 | 14 17 13.59 | 52 32 13.8 | 1.07 | |||
| 23 | 14 18 09.95 | 52 33 00.2 | 1.19 | 1.8 0.5 | ||
| 24 | 14 17 53.38 | 52 35 39.3 | 1.02 | |||
| 25 | 14 17 04.19 | 52 37 54.5 | 1.81 | 1.3 0.6 | outside IRAC area | |
| 28 | 14 18 05.55 | 52 40 32.3 | 1.19 | |||
| 29 | 14 19 45.50 | 52 46 48.1 | 1.33 | 0.3 0.2 | ||
| 30 | 14 19 10.40 | 52 48 30.7 | 1.14 | 7.4 1.5 | pa 49° | |
| 31 | 14 18 37.75 | 52 51 28.9 | 1.14 | |||
| 32 | 14 18 45.92 | 52 51 42.0 | 1.05 | outside IRAC area | ||
| 33 | 14 19 46.17 | 52 56 47.2 | 1.20 | 0.6 0.0 | ||
| 34 | 14 20 50.34 | 52 57 46.9 | 1.44 | 0.8 0.0 | ||
| 35 | 14 21 01.41 | 52 57 55.4 | 1.55 | outside IRAC area | ||
| 36 | 14 20 33.36 | 52 58 00.8 | 1.03 | 0.5 0.0 | ||
| 37 | 14 20 33.26 | 53 00 03.8 | 1.18 | |||
| 38 | 14 21 04.93 | 53 02 09.4 | 1.22 | 1.8 1.1 | ||
| 41 | 14 20 33.35 | 53 08 21.0 | 1.05 | 0.8 0.1 | ||
| 44 | 14 20 56.85 | 53 13 07.5 | 1.00 | 1.0 0.4 | ||
| 45 | 14 21 54.78 | 53 15 00.6 | 1.13 | |||
| 46 | 14 21 27.90 | 53 15 16.1 | 1.18 | |||
| 47 | 14 21 37.15 | 53 20 55.2 | 1.01 | 1.5 0.8 | ||
| 48 | 14 22 01.41 | 53 27 55.3 | 1.43 | outside IRAC area | ||
| 49 | 14 23 12.71 | 53 27 56.7 | 1.07 | 1.4 0.0 | ||
| Possible multiple sources | ||||||
| 5 | 14 14 53.00 | 52 10 25.2 | 1.19 | 3.5 0.6 | size uncertain, outside IRAC area | |
| 6 | 14 14 53.35 | 52 10 29.0 | 1.19 | 58 from 5, outside IRAC area | ||
| 10 | 14 16 22.85 | 52 19 15.9 | 1.8 0.6 | classical double morphology, | ||
| 11 | 14 16 22.56 | 52 19 18.0 | 1.0 1.0 | 31 separation | ||
| tot | 1.05 | |||||
| 17 | 14 16 25.55 | 52 27 14.4 | 1.2 | 36 from 18, outside IRAC area | ||
| 18 | 14 16 25.79 | 52 27 17.3 | 2.1 | outside IRAC area | ||
| tot | 1.28 | |||||
| 26 | 14 17 32.84 | 52 38 15.0 | 1.15 | 101 from 27 | ||
| 27 | 14 17 32.70 | 52 38 25.0 | 1.15 | multiple spots | ||
| 39 | 14 21 19.29 | 53 03 22.6 | 1.13 | 123 from 40 | ||
| 40 | 14 21 18.24 | 53 03 30.4 | 1.10 | 1.0 0.6 | ||
| 42 | 14 21 26.99 | 53 10 47.0 | 1.16 | 75 from 43 | ||
| 43 | 14 21 26.19 | 53 10 49.1 | 1.15 | 1.5 1.1 | ||
| 50 | 14 22 51.01 | 53 36 13.9 | classical double morphology, | |||
| 51 | 14 22 51.00 | 53 36 19.0 | 55 separation | |||
| tot | 1.27 | |||||
Note. — “PB corr” is the primary beam correction, which has been applied to the flux densities in column 5. Sizes of major and minor axes are given in arcsec after deconvolving the synthesized beam. Sources are considered possible multiples if there are two resolved components within 15′′. Combined flux densities are given only if the two components are potentially blended in the radio data. Systematic position uncertainties are 01 rms.
| FWKK name | this paper name | aaFlux densities in parentheses are below the detection threshold of this paper but were measured from the mosaics. Uncertainties in peak flux density are about 0.06 mJy/beam, and all sources are nearly pointlike at our resolution (according to FWKK) except 15V 10. Upper limits given are 3 assuming point sources. | |
|---|---|---|---|
| 15V | EGS06 | (mJy) | (mJy) |
| 02 | — | (0.23) | |
| 03 | — | 0.2 | |
| 10 | 21 | bbFWKK give the total flux density of this extended source: core and two lobes. (See FWKK Fig. 3a.) The lobes are resolved out in our BnA data, and our flux density includes only the core. Table 4 of FWKK suggests that the core comprises about 40% of the total flux density. | |
| 21 | — | (0.23) | |
| 34 | 19 | 1.3 | |
| 50 | 14 | 0.6 | |
| 70 | 23 | 1.0 | |
| 78 | — | 0.3 |
| EGS06 | R.A | Dec | sep(″) | comments |
|---|---|---|---|---|
| Isolated radio sources | ||||
| 1 | 14:15:03.89 | +52:01:06.7 | 0.3 | |
| 2 | 14:14:33.33 | +52:02:52.9 | 0.3 | interacting component; see Fig. 2 |
| 3 | 14:14:36.76 | +52:05:03.1 | 0.1 | , old (wk [O II]) |
| 4 | 14:15:08.84 | +52:06:42.0 | 0.2 | |
| 7 | 14:16:15.07 | +52:11:21.6 | 0.0 | |
| 8 | 14:16:11.84 | +52:12:04.0 | 0.8 | |
| 13 | 14:16:21.86 | +52:25:03.5 | 0.3 | |
| 16 | 14:16:27.89 | +52:27:07.2 | 0.6 | X-ray |
| 14 | 14:17:59.30 | +52:25:53.8 | 0.2 | edge of IRAC coverage, poor data |
| 19 | 14:17:49.21 | +52:28:03.2 | 0.1 | aaHammer et al. (1995) found and elliptical classification for EGS06 19 = 15V 34, but the DEEP2 redshift seems secure. See Appendix A., old (wk [O II]), X-ray |
| 21 | 14:17:32.62 | +52:32:03.3 | 0.2 | , post-SB, X-ray |
| 22 | 14:17:13.63 | +52:32:13.9 | 0.4 | , old |
| 23 | 14:18:09.96 | +52:33:00.4 | 0.2 | |
| 24 | 14:17:53.40 | +52:35:39.6 | 0.3 | , old |
| 28 | 14:18:05.56 | +52:40:32.8 | 0.5 | , broad-line AGN |
| 29 | 14:19:45.50 | +52:46:48.0 | 0.1 | |
| 30 | 14:19:10.43 | +52:48:30.6 | 0.3 | , old |
| 31 | 14:18:37.77 | +52:51:28.6 | 0.4 | |
| 33 | 14:19:46.08 | +52:56:47.1 | 0.8 | |
| 34 | 14:20:50.37 | +52:57:46.9 | 0.3 | |
| 36 | 14:20:33.37 | +52:58:00.9 | 0.1 | , old |
| 37 | 14:20:33.27 | +53:00:03.7 | 0.1 | |
| 41 | 14:20:33.34 | +53:08:21.0 | 0.1 | |
| 44 | 14:20:56.84 | +53:13:07.7 | 0.2 | , post-SB |
| 45 | 14:21:54.80 | +53:15:00.6 | 0.2 | |
| 46 | 14:21:27.87 | +53:15:16.1 | 0.3 | close double in R |
| 47 | 14:21:37.14 | +53:20:55.1 | 0.1 | |
| 49 | 14:23:12.67 | +53:27:56.9 | 0.4 | multiple in R |
| Possible radio doubles | ||||
| 6 | 14:14:53.34 | +52:10:28.8 | 0.2 | poor data at 3.6 & 5.8 µm |
| 14:16:22.76 | +52:19:16.4 | , broad-line AGN, X-ray | ||
| 14:17:32.55 | +52:38:18.1 | 41 NE of 26 | ||
| 14:21:18.42 | +53:03:29.0 | 21 SE of 40, , post-SB narrow-line AGN | ||
| 14:21:26.48 | +53:10:48.7 | 26 W of 43 | ||
| 14:22:51.02 | +53:36:16.8 | exposure time 0.1normal | ||
| EGS06 | 3.6 µm | 4.5 µm | 5.8 µm | 8.0 µm | 24 µm | |||
|---|---|---|---|---|---|---|---|---|
| 1 | 15.1 | 15.9 | 12.2 | 9.9 | ||||
| 2 | 85.8 | 68.0 | 94.4 | 176.2 | b | |||
| 3 | 1.15 | 9.23 | 23.18 | 120.4 | 79.9 | 70.5 | 50.4 | 54 |
| 4 | 0.52 | 2.33 | 4.98 | 79.7 | 85.1 | 99.0 | 156.6 | 166 |
| 7 | 0.94 | 13.44 | 39.45 | 165.8 | 100.4 | 81.7 | 45.2 | |
| 8 | 0.25 | 0.31 | 0.89 | 27.1 | 28.3 | 19.5 | 14.9 | |
| 13 | 0.28 | 0.53 | 2.21 | 63.8 | 64.6 | 44.7 | 31.9 | |
| 16 | 1.47 | 10.73 | 40.59 | 132.1 | 95.1 | 80.8 | 80.8 | 278 |
| 14 | 0.57 | 1.68 | 5.04 | 79.4: | 78.3: | 92.5: | 45.4: | |
| 19 | 0.3 | 2.13 | 7.88 | 111.9 | 80.9 | 57.3 | 40.7 | |
| 21 | 0.29 | 2.67 | 8.11 | 78.3 | 57.5 | 41.5 | 36.2 | |
| 22 | 0.51 | 7.32 | 26.25 | 164.9 | 106.3 | 76.8 | 48.8 | |
| 23 | 17.7 | 20.5 | 21.5 | 28.0 | 22 | |||
| 24 | 0.70 | 10.10 | 29.65 | 149.4 | 88.4 | 70.3 | 40.1 | |
| 28 | 1.61 | 3.02 | 4.51 | 42.2 | 49.4 | 52.8 | 65.8 | 77 |
| 29 | 9.55 | 21.64 | 28.95 | 123.4 | 148.0 | 198.6 | 359.1 | 598 |
| 30 | 10.34 | 90.12 | 171.40 | 268.9 | 211.1 | 130.9 | 85.7 | |
| 31 | 37.7 | 42.6 | 26.5 | 10.2: | ||||
| 33 | 25.9 | 30.4 | 31.2 | 23.8 | 29 | |||
| 34 | 39.6 | 54.1 | 70.3 | 108. | 139 | |||
| 36 | 2.15 | 25.89 | 59.27 | 175.4 | 116.9 | 88.2 | 47.51 | |
| 37 | 18.8 | 23.8 | 24.8 | 21.3 | 225 | |||
| 41 | 3.24 | 30.39 | 102.40 | 249.6 | 149.7 | 126.1 | 77.3 | |
| 44 | 24.39 | 48.98 | 100.00 | 418.0 | 252.1 | 189.7 | 150.2 | 27 |
| 45 | 0.19 | 0.35 | 2.28 | 106.4 | 100.6 | 71.8 | 61.5 | 25 |
| 46 | 0.37 | 3.06 | 12.85 | 134.0 | 96.0 | 61.8 | 43.3 | |
| 47 | 0.69 | 1.70 | 3.70 | 96.0 | 100.1 | 71.4 | 53.0 | |
| 49 | 31.1 | 36.5 | 30.4 | 31.2 | 57 | |||
| 6 | 46.13 | 101.8: | 388.0 | 293.2 | 232.9 | 125.1 | ||
| 10/11 | 1.46 | 5.73 | 14.43 | 185.4 | 267.9 | 365.4 | 561.8 | 792 |
| 26/27 | 1.90 | 19.12 | 53.26 | 223.0 | 154.7 | 138.4 | 126.1 | 109 |
| 39/40 | 3.34 | 9.38 | 29.03 | 142.8 | 109.2 | 86.7 | 115.8 | 894 |
| 42/43 | 99.7 | 92.9 | 61.4 | 43.9 | ||||
| 50/51 | 7.17 | 60.87 | 112.20 | 177.2 | 142.6 | 60.2 | ||
| noiseccTypical uncertainty from photon noise alone. See text for discussion of additional measurement uncertainties. | 0.08 | 0.10 | 0.19 | 0.2 | 0.2 | 1.2 | 1.2 | 18 |
.