Does Radiative Feedback by the First Stars Promote or Prevent Second Generation Star Formation?
Abstract
We study the effect of starlight from the first stars on the ability of other minihaloes in their neighbourhood to form additional stars. The first stars in the CDM universe are believed to have formed in minihaloes of total mass at redshifts , when molecular hydrogen () formed and cooled the dense gas at their centres, leading to gravitational collapse. Simulations suggest that the Population III (Pop III) stars thus formed were massive () and luminous enough in ionizing radiation to cause an ionization front (I-front) to sweep outward, through their host minihalo and beyond, into the intergalactic medium. Our previous work suggested that this I-front was trapped when it encountered other, nearby minihaloes, and that it failed to penetrate the dense gas at their centres within the lifetime of the Pop III stars (). The question of what the dynamical consequences were for these target minihaloes, of their exposure to the ionizing and dissociating starlight from the Pop III star requires further study, however. Towards this end, we have performed a series of detailed, 1D, radiation-hydrodynamical simulations to answer the question of whether star formation in these surrounding minihaloes was triggered or suppressed by radiation from the first stars. We have varied the distance to the source (and, hence, the flux) and the mass and evolutionary stage of the target haloes to quantify this effect. We find: (1) trapping of the I-front and its transformation from R-type to D-type, preceded by a shock front; (2) photoevaporation of the ionized gas (i.e. all gas originally located outside the trapping radius); (3) formation of an precursor shell which leads the I-front, stimulated by partial photoionization; and (4) the shock- induced formation of in the minihalo neutral core when the shock speeds up and partially ionizes the gas. The fate of the neutral core is mostly determined by the response of the core to this shock front, which leads to molecular cooling and collapse that, when compared to the same halo without external radiation, is either: (a) expedited, (b) delayed, (c) unaltered, or (d) reversed or prevented, depending upon the flux (i.e. distance to the source) and the halo mass and evolutionary stage. When collapse is expedited, star formation in neighbouring minihaloes or in merging subhaloes within the host minihalo sometimes occurs within the lifetime of the first star. Roughly speaking, most haloes that were destined to cool, collapse, and form stars in the absence of external radiation are found to do so even when exposed to the first Pop III star in their neighbourhood, while those that would not have done so are still not able to. A widely held view that the first Pop III stars must exert either positive or negative feedback on the formation of the stars in neighbouring minihaloes should, therefore, be revisited.
keywords:
cosmology: large-scale structure of universe – cosmology: theory – early universe – stars: formation – galaxies: formation1 Introduction
Cosmological minihaloes at high redshift – i.e. dark-matter dominated haloes with virial temperatures , with masses above the Jeans mass in the intergalactic medium (IGM) before reionization () – are believed to have been the sites of the first star formation in the universe. To form a star, the gas inside these haloes must first have cooled radiatively and compressed, so that the baryonic component could become self-gravitating and gravitational collapse could ensue. For the neutral gas of H and He at inside minihaloes, this requires that a sufficient trace abundance of molecules formed to cool the gas by atomic collisional excitation of the rotational-vibrational lines of . The formation of this trace abundance of proceeds via the creation of intermediaries, or , which act as catalysts, which in turn requires the presence of a trace ionized fraction, in the following two-step gas-phase reactions (see, e.g., Peebles & Dicke 1968; Saslaw & Zipoy 1967; Lepp & Shull 1984; Shapiro & Kang 1987; Shapiro, Giroux, & Babul 1994, henceforth, “SGB94”; Galli & Palla 1998):
| (1) |
and
| (2) |
Unless there is a strong destruction mechanism for (e.g. cosmic microwave background at ), the former (equation 1) is generally the dominant process for formation.
Gas-dynamical simulations of the Cold Dark Matter (CDM) universe suggest that the first stars formed in this way when the dense gas at the centres of minihaloes of mass cooled and collapsed gravitationally at redshifts (e.g. Abel, Bryan, & Norman 2000, 2002; Bromm, Coppi, & Larson 1999, 2002; Yoshida et al. 2003; Machacek, Bryan, & Abel 2001, 2003; Yoshida et al. 2006). This work and others further suggest that these stars were massive (), hot (), and short-lived (), thus copious emitters of ionizing and dissociating radiation.
These stars constitute the Population III (Pop III) stars, or zero metallicity stars, which are believed to have exerted a strong, radiative feedback on their environment. The details of this feedback and even the overall sign (i.e. negative or positive) are poorly understood. Once the ionizing radiation escaped from its halo of origin, it created H II regions in the IGM, beginning the process of cosmic reionization. The photoheating which accompanies this photoionization raises the gas pressure in the IGM, thereby preventing baryons from collapsing gravitationally out of the IGM into new minihaloes when they form inside the H II regions, an effect known as “Jeans-mass filtering” (SGB94; Gnedin & Hui 1998; Oh & Haiman 2003). Inside the H II regions, whenever the I-fronts encounter pre-existing minihaloes, those minihaloes are subject to photoevaporation (Shapiro, Iliev, & Raga 2004, henceforth, SIR; Iliev, Shapiro, & Raga 2005, henceforth, ISR). A strong background of UV photons in the Lyman-Werner (LW) bands of also builds up which can dissociate molecular hydrogen inside minihaloes even in the neutral regions of the IGM, thereby disabling further collapse and, thence, star formation (e.g. Omukai & Nishi 1999; Haiman, Abel, & Rees 2000; Omukai 2001). This conclusion changes, however, if some additional sources of partial ionization existed to stimulate formation without heating the gas to the usually high temperature of fully photoionized gas () at which collisional dissociation occurs, such as X-rays from miniquasars (Haiman, Rees, & Loeb, 1996a) or if stellar sources create a partially-ionized boundary layer outside of intergalactic H II regions (Ricotti, Gnedin, & Shull, 2001). Such positive feedback effects, however, may have been only temporary, because photoheating would soon become effective as background flux builds up over time (MacIntyre, Santoro, & Thomas, 2006).
The study of feedback effects has been limited mainly by technical difficulties. Haiman et al. (2000) studied the feedback of LW, ultraviolet (UV), and X-ray backgrounds on minihaloes without allowing hydrodynamic evolution. Ricotti et al. (2001) studied the radiative feedback effect of stellar sources only on a static, uniform IGM. Ricotti, Gnedin, & Shull (2002a, b) studied stellar feedback more self-consistently by performing cosmological hydrodynamic simulations with radiative transfer, but the resolution of these simulations is not adequate for resolving minihaloes. Machacek, Bryan, & Abel (2001, 2003) also performed cosmological hydrodynamic simulations, with higher resolution, but radiative feedback was treated assuming the optically thin limit, which overestimates the ionization efficiency, especially in the high density regions which would initially be easily protected from ionizing radiation due to their high optical depth. The first self-consistent, radiation-hydrodynamical simulations of the feedback effect of external starlight on cosmological minihaloes were those of SIR and ISR, who studied the encounter between the intergalactic I-fronts that reionized the universe and individual minihaloes along their path. These simulations used Eulerian, grid-based hydrodynamics with radiative transfer and adaptive mesh refinement (AMR) to “zoom-in” with very high resolution, to demonstrate that the I-fronts from external ionizing sources are trapped when they encounter minihaloes, slowing down and transforming from weak, R-type to D-type, preceded by a shock. The gas on the ionized side of these I-fronts was found to be evaporated in a supersonic wind, and, if the radiative source continued to shine for a long enough time, the I-front eventually penetrated the minihaloes entirely and expelled all of the gas. These simulations elucidated the impact of the I-front and the physical effects of ionizing radiation on minihalo gas, quantifying the timescales and photon consumption required to complete the photoevaporation. They did not, however, address the aftermath of “interrupted” evaporation, when the source turns off before evaporation is finished.
Recent studies by O’Shea et al. (2005), Alvarez, Bromm, & Shapiro (2006a), and Mesinger, Bryan, & Haiman (2006) addressed this question for minihaloes exposed to the radiation from the first Pop III star in their neighbourhood, instead of the effect of either a steadily-driven I-front during global reionization or a uniform global background. The results of O’Shea et al. (2005) and Mesinger et al. (2006) are seriously misleading, however, since they did not account properly for the optical depth to hydrogen ionizing photons.
O’Shea et al. (2005) assumed that the UV radiation from the first Pop III star that formed inside a minihalo in some region would fully ionize the gas in the neighbouring minihaloes. Using 3D hydrodynamics simulations, they found that, when the star turned off, molecules formed in the dense gas that remained at the centre of the neighbouring minihalo, fast enough to cool the gas radiatively and cause gravitational collapse leading to more star formation. The formation mechanism was the same as that described by Shapiro & Kang (1987), in which ionized gas of primordial composition at a temperature cools radiatively and recombines out of ionization equilibrium, enabling an enhanced residual ionized fraction to drive reaction (1) (and [2], as well) as the temperature falls below the level at which collisional dissociation suppresses molecule formation. As a result, O’Shea et al. (2005) concluded that the radiative feedback of the first Pop III stars was positive, triggering a second generation of star formation in the minihaloes surrounding the one that hosted the first star.
Mesinger, Bryan, & Haiman (2006) also used 3D hydrodynamics simulations to consider the fate of the gas in the relic H II regions created by the first Pop III stars. they concluded that the radiative feedback of the first stars could be either negative or positive and estimated a critical UV intensity which would mark the transition from negative to positive feedback. Mesinger et al. (2006), however, studied this effect only in the optically thin limit, as had also been done by Machacek et al. (2001, 2003). The main mechanisms of the positive feedback effect in O’Shea et al. (2005) and Mesinger et al. (2006) are, therefore, identical.
Alvarez et al. (2006a), on the other hand, performed a high-resolution ray-tracing calculation to track the position of the I-front created by the first Pop III star as it swept outward in the density field of a 3D cosmological SPH simulation of primordial star formation in the CDM universe over the lifetime of the star. When this I-front encountered the minihaloes in the neighbourhood of the one which hosted the first Pop III star, it was trapped by the minihalo gas before it could reach the high-density region (core), due to the minihalo’s high column density of neutral hydrogen. This is consistent with the results of SIR and ISR mentioned above. According to Alvarez et al. (2006a), in fact, the lifetime of the Pop III star is less than the evaporation times determined by SIR and ISR for the relevant minihalo masses and flux levels in this case, so the neutral gas in the core is never ionized by the I-front. It seems that the initial assumption of full ionization of nearby haloes by O’Shea et al. (2005) and the optically thin limit assumed by Mesinger et al. (2006) are invalid.
The final fate of this protected neutral core, however, is still unclear, because the I-front tracking calculations by Alvarez et al. (2006a) did not include the hydrodynamical response of the minihalo gas to its ionization, a full treatment of radiative transfer or the primordial chemistry involving . One might naively expect that the nett effect would be negative, because heating from photoionization would ultimately expel most of gas from minihaloes, although the results of SIR and ISR, again, show that this minihalo evaporation would not be complete within the lifetime of the Pop III star. On the other hand, partial ionization beyond the I-front by hard photons from a Pop III star might be able to promote formation, once the dissociating UV radiation from the star is turned off, which would then lead to a cooling and collapsing core. This issue can be addressed only by a fully coupled calculation of radiative transfer, chemistry, and hydrodynamics, which will be the focus of this paper.
We shall attempt to answer the following questions: Does the light from the first Pop III star in some neighbourhood promote or prevent the formation of more Pop III stars in the surrounding minihaloes? More specifically, do the neutral cores of these nearby minihaloes, which are shielded from the ionizing radiation from the external Pop III star, subsequently cool and collapse gravitationally, as they must in order to form stars, or are they prevented from doing so? Towards this end, we simulate the evolution of these target haloes under the influence of an external Pop III star using the 1-D spherical, Lagrangian, radiation-hydrodynamics code we have developed. We adopt a Pop III star as a source, and place different mass haloes at different distances to explore a wide range of the parameter space for this problem. Masses of target haloes are chosen to span the range from those too low for haloes to cool and collapse by cooling without external radiation to those massive enough to do so on their own.
Our calculation is the first self-consistent gas-dynamical calculation of the feedback effects of a single Pop III star on nearby haloes. A similar approach by 1-D radiation-hydrodynamics calculation has been performed by Kitayama et al. (2001). Their work, however, focuses on the effect of a steady global background from quasars and from stars with surface temperatures , rather than a single, short-lived Pop III star with . In addition, while we were preparing this manuscript, a study which is similar to our work was reported by Susa & Umemura (2006), where a 3D radiation-hydrodynamics calculation with SPH particles was performed111A new preprint by Abel, Wise, & Bryan (2006) has also appeared which addresses this issue. We will discuss this further in Section 6.6. A major difference of their work from ours is that they focus on the subclumps of the halo which hosts the first Pop III star, while we focus on external minihaloes in the neighbourhood of such a host halo. We also apply a more accurate treatment of self-shielding, as well as a more complete chemistry network of neutral and ionic species of H, He, and . A more fundamental difference from these previous studies is our finding of a novel formation mechanism: collisional ionization of pre-I-front gas by a shock detached from a D-type I-front. This mechanism occurs at the centre of target haloes, which would otherwise remain very neutral. This mechanism creates new electrons abundant enough to promote further formation, which can even expedite the core collapse.
In Section 2 we describe the details of the 1-D spherical radiation-hydrodynamics code we have developed. Some details left out in Section 2 will be described in Appendices. In Section 3.1, we describe the initial setup of our problem. We briefly describe a test case in Section 4, where we let a minihalo evolve from an initially ionized state, to show that our code reproduces the result of O’Shea et al. (2005) in that case. In Section 5 and Section 6, we present the main results of our full radiation-hydrodynamics calculation. We summarize our results in Section 7. Throughout this paper, we use the CDM cosmological parameters, (, , , ) = (, , , ), consistent with the WMAP first-year data (Spergel et al., 2003)222As we do not perform a statistical study, our result is independent of the cosmic density power spectrum. The three-year WMAP data does not show a big discrepancy in the set of cosmological parameters of the interest in this paper (Spergel et al., 2006). The change in and the index of the primordial power spectrum would translate to redshift delay of structure formation and reionization (Alvarez et al., 2006b).
2 Numerical Method: 1-D spherical, radiation-hydrodynamics with primordial chemistry network
In this section, we describe in detail the 1-D spherical, Lagrangian, radiation-hydrodynamics code we have developed for both dark and baryonic matter. We describe how hydrodynamics, dark matter dynamics, radiative transfer, radiative heating and cooling, and finally the nonequilibrium chemistry are handled. The finite differencing scheme, reaction rates, and certain other details not treated in this section will be described in Appendices. We include the neutral and ionic species of H, He and , namely H, , He, , , , , and , in order to treat the primordial chemistry fully. As deuterium and lithium exist in a negligible amount, we neglect and species333D and Li components have usually been neglected due to their relatively low abundance, hence the negligible contribution to cooling (e.g. Lepp & Shull 1984; Shapiro & Kang 1987). Recent studies by Nagakura & Omukai (2005) and Johnson & Bromm (2006), however, show that enough HD is generated in strongly-shocked, ionized primordial gas which then can cool below the temperature of already achieved by cooling alone, down to the temperature of the CMB. As the HD cooling process is negligible if gas remains neutral (e.g. Johnson & Bromm (2006)), however, we may neglect the HD cooling process in our calculation as long as we are interested in the centre of target haloes which remains mostly neutral at any time. We will discuss this issue further in Section 7..
2.1 Hydrodynamic Conservation Equations
The baryonic gas obeys inviscid fluid conservation equations,
| (3) |
| (4) |
| (5) |
where is the internal energy per unit baryon mass, is the external heating rate, and is the radiative cooling rate. Note that all the variables in equations (3) - (5) denote baryonic properties, except for , the mass enclosed by a radius , which is composed of both dark and baryonic matter.
We do not change the adiabatic index throughout the simulation. As long as monatomic species, H and He, dominate the abundance, is the right value to use. This ratio of specific heats, , can change significantly, however, if a large fraction of H is converted into molecules. For example, the three-body formation process,
| (6) |
will occur vigorously when and , which will invalidate the use of a constant . To circumvent such a problem, when such high density occurs, we simply stop the simulation. This process is, nevertheless, important in forming the protostellar molecular cloud (e.g. Abel et al. 2002). This issue will be further discussed in Section 6, when we define the criterion for the collapse of cooling regions.
2.2 Dark Matter Dynamics
Gravity is contributed both by the dark matter and the baryonic components. Let us first focus on the dark matter component. In order to treat the dark matter gravity under spherical symmetry, almost all previous studies have used either a frozen dark matter potential or a set of self-gravitating dark matter shells in radial motion only (e.g. Thoul & Weinberg 1995). Both methods have their own limitations. The frozen potential approximation cannot address the effect of a possible evolution of the gravitational potential. The radial-only dark matter approximation suffers from the lack of any tangential motion, producing a virialized structure whose central density profile is much steeper ( with ; see e.g. ) than that of haloes in cosmological, 3-D N-body simulations (, as found in Navarro, Frenk, & White 1997).
In order to treat the dynamics of dark matter more accurately than these previous treatments, we use the the fluid approximation we have developed and reported elsewhere (Ahn & Shapiro, 2005). We briefly summarize its derivation here; for a detailed description, see Ahn & Shapiro (2005). Collisionless CDM particles are described by the collisionless Boltzmann equation. When integrated, it yields an infinite set of conservation equations, which is called the BBGKY hierarchy (e.g. Binney & Tremaine 1987). However, CDM N-body simulations show that virialized haloes are well approximated by spherical symmetry. These simulations also show that the velocity dispersions are highly isotropic: radial dispersion is almost the same as the tangential dispersion. These two conditions make it possible to truncate the hierarchy of equations to a good approximation, which then yields only three sets of conservation equations. Amazingly enough, these equations are identical to the normal fluid conservation equations for the adiabatic index gas:
| (7) |
| (8) |
| (9) |
where the subscript represents dark matter, the effective pressure is the product of the dark matter density and the velocity dispersion at a given radius, and the effective internal energy per dark matter mass . We use these effective fluid conservation equations (equation 7, 8, 9) to handle the motion of dark matter particles.
Note that dark matter shells in this code represent a collection of dark matter particles in spherical bins, in order to describe “coarse-grained” properties such as density () and the effective pressure (). As these coarse-grained variables follow the usual fluid conservation equations, the hyperbolicity of these equations leads to the formation of an effective “shock.” The location of this shock will determine the effective “post-shock” region. This post-shock region corresponds to the dark matter shell-crossing region. Because of the presence of this effective shock, we also use the artificial viscosity technique. This collisional behaviour of our coarse-grained dark matter shells originates from our choice of physical variable. For further details, the reader is referred to Ahn & Shapiro (2005) and Alvarez et al. (2003) for description and application of our fluid approximation.
2.3 Radiative transfer
A full, multi-frequency, radiative transfer calculation is performed in the code. Since cooling is of prime importance here, we first pay special attention to calculating the optical depth to UV dissociating photons in the LW bands and the corresponding self-shielding function. We then describe how we calculate the optical depth associated with any other species depending upon the location of the radiation source. The finite difference scheme for the calculation of radiative rates is described in the Appendix A.
2.3.1 Photodissociation of and Self-Shielding
Hydrogen molecules are photodissociated when a UV photon in the LW bands between and excites to an excited electronic state from which dissociation sometimes occurs. When the column density of becomes high enough (), the optical depth to photons in these Lyman-Werner bands can be high, so can “self-shield” from dissociating photons. Exact calculation of this self-shielding requires a full treatment of all 76 Lyman-Werner lines, even when only the lowest energy level transitions are included. Such a calculation is feasible under simplified conditions such as a radiative transfer problem through a static medium (e.g. Haiman et al. 2000; Ricotti et al. 2001). Unfortunately, for combined calculations of radiative transfer and hydrodynamics, such a full treatment is computationally very expensive.
Under certain circumstances, however, one can use a pre-computed self-shielding function expressed in terms of the molecular column density and the temperature of gas, which saves a great amount of computation time. In a cold, static medium, for instance, one can use a self-shielding function provided by Draine & Bertoldi (1996):
| (11) |
The photodissociation rate is then given by
| (12) |
where () is the mean intensity in the spectral region of the LW bands. This approximation has been widely used in the study of high redshift structure formation (e.g. Kitayama et al. 2001; Glover & Brand 2001; Yoshida et al. 2003; Kitayama et al. 2004).
The problem with equation (11) is that when the gas temperature is high or gas has motion along the line of sight to the source, the thermal and velocity broadening of the LW bands caused by the Doppler effect can significantly reduce the optical depth. A better treatment for thermal broadening is also given by Draine & Bertoldi (1996), now in terms of the molecular column density and the velocity-spread parameter of the gas:
| (13) |
where , , and where is the atomic weight (Spitzer, 1978). For , .
In the problem treated in this paper, we frequently find in the gas parcel (shell) which contributes most of the column density. We also find that this gas parcel usually moves at (see Section 6.2). The combined effect of the thermal broadening and the Doppler shift on the shielding function, then, may be well approximated by a thermally broadened shielding function with . Throughout this paper, therefore, we use equation (13) with to calculate the self-shielding. For the photo-dissociation rate, we use equation (12).
We show in Fig. 1 how much the static, cold shielding function (equation 11) may overestimate the self-shielding in our problem, by comparing this to the thermally-broadened shielding function (equation 13) at . The biggest discrepancy between these two shielding functions exists for . Interestingly enough, the column density in our problem usually resides in this regime. It is crucial, therefore, to take into account the effects of thermal broadening and Doppler shift carefully, as we do in this paper.

2.3.2 External Source
Since our calculations are 1-D, spherically-symmetric, we have assumed the external radiation source contributes a radial flux at frequency and radius , measured from the minihalo centre, given by
| (14) |
where is the source luminosity, and is the optical depth along the radial direction from radius to the source located at a distance .
The radiative rate of species at radius is then given by
| (15) |
where we have used the fact that , as long as the external radiation can be approximated as a 1D planar flux. In practice, one calculates this rate in a given grid-cell – i.e. spherical shell – with finite thickness. If such a grid-cell has a small optical depth, is almost constant across the grid, so one could take the grid-centred value of to calculate . This naive scheme, however, does not yield an accurate result when a grid-cell is optically thick, where may vary significantly over the cell width. This problem occurs frequently for solving radiative transfer through optically thick media, where individual cells have large optical depth. In order to resolve this problem, we use a “photon-conserving” scheme like that described by Razoumov & Scott (1999) and Abel et al. (1999). The details of our implementation of this scheme are described in the Appendix A.
2.4 Heating and Cooling
2.4.1 Photoheating
Photoheating results from thermalization of the residual kinetic energy of electrons after they are photoionized. In general, the photoheating function is described by
| (16) | |||||
where is the threshold energy over which the residual photon energy is converted into the kinetic energy of electrons, and the nett heating function is the sum of individual heating functions ({}). In finite-differencing equation (16), we also use the photon-conserving scheme as we do for equation (15). This prevents cells with large optical depth from obtaining unphysically high heating rates. See Appendix A for details.
2.4.2 Radiative cooling
Cooling occurs through various processes. For atomic species, it comes from collisional excitation, collisional ionization, recombination, free-free emission, and CMB photons scattering off free electrons (Compton cooling/heating). For atomic H and He, cooling is dominated by collisional excitation (for ) and free-free emission (for ). The atomic cooling rate decreases rapidly at , as there are no collisions energetic enough to cause excitation. It is difficult, therefore, to cool gas below solely by atomic cooling of primordial gas.
Molecular hydrogen (), however, is able to cool gas below , down to , by collisional excitation of rotational-vibrational lines by H atoms. An important question to address is how much is created, maintained, or destroyed under the influence of an ionizing and dissociating radiation field. Even a small fraction, , is sometimes enough to cool gas below (e.g. see Shapiro & Kang 1987).
We use cooling rates in the parametrized forms given by Anninos et al. (1997), except for the hydrogen molecular cooling. For cooling, we use the fit given by Galli & Palla (1998), where the low density cooling rate has been updated significantly from the previously used rate by Lepp & Shull (1984), which suffers from the uncertainties associated with the only collisional coefficients available at that time. At low densities, , the cooling rate of Lepp & Shull (1984) is bigger by an order of magnitude than that of Galli & Palla (1998) at .
2.5 Nonequilibrium chemistry
The general rate equation for the abundance of species is given by
| (17) |
where is the collective source term for the creation of species , and the second term is the collective “sink” term for the destruction of species . The processes included and adopted are shown in Table 5 in Appendix B. Most of the rate coefficients are those from the fits by Shapiro & Kang (1987), with a few updates.
We also adopt the rate solving scheme proposed by Abel et al. (1997). It is well known that coupled rate equations in the form of equation (17) are “stiff” differential equations, whose numerical solution suffers from instability if explicit ODE solvers are used. Abel et al. (1997) show that their implicit, backward difference scheme provides enough stability. Accuracy of the solution is achieved by updating each species in some specific order, rather than updating all species simultaneously from their values at the last time step. In addition, the abundance of the relatively fast reactions of and are approximated by their equilibrium values, which are expressed by simple algebraic equations. See the Appendix A for the corresponding finite-differencing scheme.
We will frequently quote our results in terms of the fractional number density of species , , where is the number density of the total atomic hydrogen atoms. We use , however, to denote the fractional electron number density, , which is a measure of the ionized fraction.
2.6 Code tests
We tested our code against the following problems which have analytic solutions:
(A) the self-similar, spherical, cosmological infall and accretion shock resulting from a point-mass perturbation in an Einstein-de Sitter universe of gas and collisionless dark matter (Bertschinger, 1985);
(B) the self-similar blast wave which results from a strong, adiabatic point explosion in a uniform gas – the Sedov solution (Sedov 1959)
(C) the propagation of an I-front from a steady point-source in a uniform, static medium
(D) the gas-dynamical expansion of an H II region from a point source in a uniform gas (Lasker, 1966)
(E) the gas-dynamical expansion-phase of the H II region from a point-source in a nonuniform gas whose density varies with distance from the source as , (Franco, Tenorio-Tagle, & Bodenheimer, 1990).
Our code passed all the tests described above with an acceptable accuracy. Test results are described in Appendix C.
3 The Simulations
3.1 Initial Setup
We now describe the initial setup for the problem of radiative feedback effects of Pop III stars on nearby haloes at . The first stars form inside rare, high density peaks at high redshift. We place target haloes of different mass at different locations from the source, with proper distance , which are all assumed to be affected directly by the radiation field from the source Pop III star of mass 444The additional case of , , , will be discussed separately in Section 6.6 with regard to the case in which the target minihalo is merging with the minihalo which hosts the star, separated by less than its virial radius from the star. We expose the target halo to this radiation field for the lifetime of the star, (Schaerer 2002). The source Pop III star is assumed to be located in a halo of mass Time is measured from the arrival of the stellar radiation at the location of the target minihalo.
This setup is well justified by the cosmological simulations by Alvarez et al. (2006a). A cosmological gas and N-body simulation of structure formation in the CDM universe on small scales by a GADGET/SPH code was used to identify the site at which the first Pop III star would form. This occurred at , at the location of the highest density SPH particle in the simulation box, located within a halo of mass This provided the initial density field for the I-front tracking calculations in Alvarez et al. (2006a). The I-front from this first star escaped from the host halo quickly with high escape fraction, traveling as a supersonic, weak R-type front. By the end of the lifetime of the star () for stellar masses in the range , the star’s H II region had reached a maximum radius of about .
We approximate the spectral energy distribution (SED) of the source star by a blackbody spectrum. A Pop III star of mass , according to Schaerer (2002), has the time-average effective temperature and luminosity . The corresponding ionizing photon luminosity with this blackbody spectrum is , where is the hydrogen ionization threshold energy. We assume that the source radiates with these time-averaged values throughout its lifetime, then stops. As the photons escape in a time scale short compared to the lifetime of the star and the escape fraction is high, we simply ignore the effect of the intervening gas (e.g. optical depth from the host halo and the IGM) and assume that the bare radiation field hits the edge of target haloes directly.
As we fix the luminosity of the source, different distances correspond to different fluxes. We express the frequency-integrated ionizing photon flux, in units of , to give the dimensionless flux, , where is the ionizing photon luminosity (in units of ) and () is the distance in units of kpc (Mpc), respectively. The value is typical for minihaloes encountered by intergalactic I-fronts during global reionization (e.g. see Shapiro et al. 2004). Interestingly enough, for our “small-scale” problem has a similar value. The Pop III star in our problem has . For distances , , and , corresponds to 46.3, 11.6, 5.14 and 1.5, respectively.
3.2 Initial Halo Structure
For the initial halo structure, we adopt the minimum-energy truncated isothermal sphere (TIS) model (Shapiro, Iliev, & Raga 1999; Iliev & Shapiro 2001), which will be described further in Section 3.2.1. The thermodynamic properties and chemical abundances of the gas in these target haloes, however, is somewhat ambiguous. The density and virial temperature of these haloes are higher than those of the IGM in general, which drives their chemical abundances to change from the IGM equilibrium state to a new equilibrium state. The most notable feature is the change of and . The IGM equilibrium value of the electron abundance, , is high enough to promote formation inside minihaloes to yield a high molecule fraction, . At the density of gas in the halo core, this newly created is capable of cooling the minihalo gas to , and depending on the virial temperature, the minihalo may, therefore, undergo a runaway collapse.
The time for this evolution of the target halo gas is short compared to the age of the universe when the first star forms in their neighbourhood. As a result, it is likely that the target haloes are exposed to the ionizing and dissociating radiation from that first star as they are in the midst of evolving, with fine-tuning required to catch all of them in a particular stage of this evolution. As the evolutionary “phase” of our target haloes is uncertain, we adopt two different phases as our representative initial conditions. In Phase I, chemical abundances have not yet evolved away from their IGM equilibrium values. This stage is characterized by low fraction, and high electron fraction, . Phase II is the state which is reached, after allowing the Phase I minihalo to evolve chemically, thermodynamically and hydrodynamically for a few million years (a small fraction of a Hubble time, at ), until the electron fraction has decreased to . Phase II is characterized by high fraction, , and cooling-induced compression of the core relative to Phase I, by a factor between 1 and 20, higher for higher minihalo mass.
3.2.1 Phase I: Unevolved Halo with IGM chemical abundance in hydrostatic equilibrium
The first phase we choose is the initial state we assumed above, namely the nonsingular TIS structure with IGM chemical abundances. This phase is characterized by gas in hydrostatic equilibrium, with the truncation radius (outer boundary of the halo)
| (18) | |||||
the virial temperature
| (19) | |||||
where is the mean molecular weight (1.22 for neutral gas and 0.59 for ionized gas) and the central density
| (20) |
which can also be expressed in terms of the hydrogen number density by
| (21) | |||||
where is the hydrogen mass fraction in the baryon component. This central density is about where is the mean matter density at redshift , while at , . For more details, see Shapiro et al. (1999) and Iliev & Shapiro (2001).
We assign chemical abundances that reflect the IGM equilibrium state, which is characterized by high electron fraction – high enough to promote formation under the right conditions – and low fraction – low enough to contribute negligible molecular cooling. We adopt , , , , and for other species (see, e.g. SGB94; Ricotti et al. 2001).
3.2.2 Phase II: Evolved Halo with Recombining and Cooling Core
The second initial condition we choose is the evolved state (Phase II) reached by allowing the system to evolve from Phase I initial conditions before the arrival of radiation from the Pop III star. In particular, we follow this evolution until the central electron fraction has dropped to by recombination from Phase I. We choose this condition because it is now characterized by high molecule and low electron fraction, contrary to Phase I. The fate of this halo will then mainly be determined by how easily this abundant is protected against dissociating radiation after the star turns on. The answer will also depend upon how much change has occurred hydrodynamically, because in some cases the halo core may have cooled and collapsed significantly enough to be unaffected by the feedback from late irradiation.


The time to reach Phase II is different for different mass haloes because of different gas properties. Initially, as we start from the TIS density profile whose central density is independent of the halo mass, the recombination rate is higher for smaller mass haloes, because hydrogen recombines according to the following:
| (22) |
The situation becomes complicated, however, once evolution begins and density changes. The cooling and collapse in the central region of the haloes is increasingly effective as halo mass increases, because of the increasingly large difference between the virial temperature and the cooling temperature plateau, . The corresponding rapid collapse and cooling in massive haloes can easily offset the initial temperature dependence by obtaining high density and low temperature, as is seen in equation (22). Phase II for large mass haloes represents haloes that have already started their cooling and collapse.
In Fig. 2, we show halo profiles in Phase I and Phase II for different halo masses. We also show how much time it takes for the haloes to evolve from Phase I to Phase II. The times for gas at the halo centre to recombine to are in the range for halo masses , peaked at for . In all cases, , the age of the universe at .
4 Halo Evolution from Fully-Ionized Initial Conditions: The Consequences of Irradiation Without Optical Depth
Before describing the results of our full radiative transfer, hydrodynamics calculation, we describe an experiment designed to show the effect of neglecting the optical depth of the minihalo to ionizing radiation from the external star during the star’s lifetime on the minihalo’s evolution after the star shuts off. For this purpose, we assume the target minihalo is initially fully-ionized and heated to the temperature of a photoionized gas as it would be if it were instantaneously flash-ionized by starlight in the optically-thin limit. Such a setup is equivalent to that used by O’Shea et al. (2005), where they find that second-generation star formation is triggered when the ionization of the minihalo caused by the nearby Pop III star leads to cooling by . The high initial electron fraction is present because of the assumption of full ionization allows quick formation of , which then cools the central region before it reaches the escape velocity.
For this experiment, we initialized ionized fractions as following: , , , , , , for other species. Without disturbing the halo density profile – we use the TIS halo model, which is described in Section 3.2.1 –, we also assigned a high initial temperature appropriate for photoionized gas, . These abundance and temperature values roughly mimic the condition found in typical H II regions.
We find that such an initial condition leads to the collapse of the core region, when the formation of stimulated by the high initial electron fraction enables cooling. Gas in the outskirts evaporates from the halo, however, because pressure forces accelerate the gas to escape velocity before it can form and cool. The cooling and adiabatic cooling which happen later in this outflowing gas do not reverse the evaporation (Fig. 3).
Our results for this case agree with the outcome of O’Shea et al. (2005). This led those authors to suggest that the first stars exerted a positive feedback effect on their surroundings, triggering a second generation of star formation. A question arises, however, as to whether this fully-ionized initial condition of nearby minihaloes is actually achieved by the first Pop III star to form in their neighbourhood. As already mentioned in Section 1, Alvarez et al. (2006a) found that the I-front from this Pop III star gets trapped in those minihaloes and cannot reach the central region before the star dies. In this paper, we will confirm that the fully-ionized initial condition of O’Shea et al. (2005) is never achieved when one considers the coupled radiative and hydrodynamic processes more fully. We will also show that, if any protostellar region is to form in the target halo, it does so in the neutral core region which the ionizing photons do not penetrate.

5 Minimum Halo Mass for Collapse: the case without radiative feedback
When a minihalo forms as a nonlinear, virialized, gravitationally-bound structure out of the linearly perturbed IGM, a change of chemical abundance occurs due to the change of gas properties. Most importantly, the hydrogen molecule fraction changes from the IGM equilibrium value, , to a new equilibrium value, . Even with such a small fraction, can cool gas to , where represents the temperature “plateau” that gas in primordial composition can reach by cooling.
There exists a minimum collapse mass of minihaloes, , above which haloes, in the absence of external radiation, can form cooling and collapsing cores within the Hubble time at a given redshift. The gap between the cooling plateau temperature, , and the minihalo virial temperature, , given by equation (19) is a useful indicator of the success or failure of collapse. For instance, at , for . As , even after gas cools to , it cannot collapse fast enough to serve as a site for star formation. On the other hand, for , and the temperature’s cooling down to will make the gas gravitationally unstable, which will lead to runaway collapse. This argument is supported by the results of Haiman, Thoul, & Loeb (1996b), for example, that collapse can occur only in haloes with .
We model the initial minihalo structure by the TIS model as described in Section 3.2.1 and let it evolve in the absence of radiation, starting from the IGM chemical abundance and minihalo virial temperature (Phase I). We determine by the criterion
| (23) |
where is the time at which the central density reaches (the density suitable for initiating three-body formation; see e.g. Abel et al. 2000), and is the Hubble time at a given redshift.
We find that at (see Fig. 4). We have plotted the evolution of minihalo centres in the absence of radiation, where each run starts from Phase I. This is in rough agreement with , the value found by Machacek et al. (2001). The discrepancy is larger with results by Fuller & Couchman (2000) and Yoshida et al. (2003), where they obtain . The biggest contrast exists with Tegmark et al. (1997), where they find at , almost 30 times as large as our findings.


We argue that this discrepancy in minimum collapse mass results primarily from how well the minihalo structure is resolved. Unless the centre, which gains the highest molecule formation rate due to the highest density, is fully resolved, one could be misled by a poor numerical resolution such that certain low-mass haloes, which can cool and collapse in reality, are in hydrostatic equilibrium in the simulation. The resolution becomes poorer in the following sequence: Machacek et al. (2001), which gives the best agreement with our result, used an adaptive mesh refinement (AMR) scheme, resolving baryonic mass down to . Such high resolution is suitable to resolve even the central part of the smallest minihaloes whose total baryonic mass content is roughly . Fuller & Couchman (2000) and Yoshida et al. (2003), on the other hand, used the smoothed particle hydrodynamics (SPH) scheme, using SPH particles of mass . Finally, Tegmark et al. (1997) used a uniform top-hat model, where there is no radial variation in gas properties such as density and temperature, thus the central region is, in effect, completely unresolved. In addition, some of the rates used in Tegmark et al. (1997) were not accurate (Fuller & Couchman, 2000).
We believe that at is close to reality, because our 1-D spherical setup is based upon the TIS model which is a highly concentrated structure, and the resolution of our code is superior to previous calculations555After this paper was written a new preprint was posted which is consistent with our description here, finding (O’Shea & Norman, 2006).. It is not our objective, however, to settle the exact value of . This estimate is based upon our specific criterion described in this section, and is subject to change under different criteria. This may also change if one adopts a more realistic halo formation history to account, for instance, for dynamical heating by accretion (see Yoshida et al. 2003). As the haloes we choose are rather conservatively divided into successful collapse (for ) and failure (for ), agreeing with AMR simulation result by Machacek et al. 2001, we shall proceed with our choice of parameter space and see how this fate of minihaloes changes as a result of external radiation from a Pop III star.
6 Results: Radiative Feedback on Nearby Minihaloes by an External Pop III Star
As described in Section 3.1, we expose target haloes of different mass to the radiation from a Pop III star whose spectrum is approximated as a blackbody radiation field and whose flux is attenuated by the geometrical factor for different values of . In this section, we summarize the simulation results for both the Phase I (early irradiation) and the Phase II (late irradiation) initial conditions.
6.1 I-front trapping and photo-evaporation
In all cases, even in the presence of evaporation, we find no evidence of penetration of ionizing radiation into the halo core. This is consistent with the results of Alvarez et al. (2006a) for the H II regions of the first Pop III stars and of Shapiro et al. (2004) and Iliev et al. (2005) for the encounters between intergalactic I-fronts and minihaloes during reionization. There are two main reasons for this behaviour. First, the total intervening hydrogen column density is initially high enough to trap the I-front outside the core. Second, the lifetime of the source is short compared to the evaporation time. If the source lived longer than the evaporation time, the I-front would eventually have reached the centre of the halo. In that case, Shapiro et al. (2004) find that the minihalo gas is completely evaporated. In our problem, however, the slow evaporation does not allow the I-front to reach the centre within the lifetime of a Pop III star.
The I-front entering the minihaloes propagates as a weak R-type front in the beginning. The I-front then makes the transition to the D-type, after reaching the R-critical state. This R-critical state is reached when the I-front velocity satisfies the following condition:
| (24) |
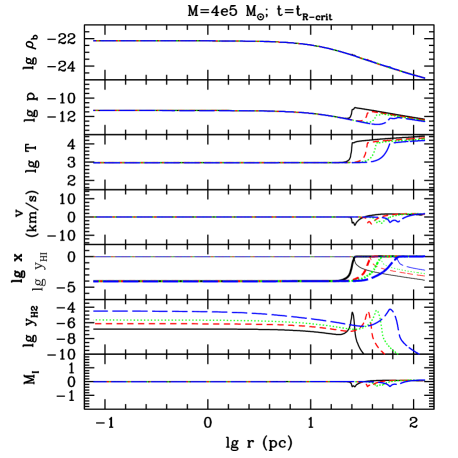
where is the isothermal sound speed, , and subscripts 1 and 2 represent pre-front and post-front, respectively. When the I-front propagates into a cold region (), as in our problem, this condition is approximately In all cases, we find that this transition occurs in times less than the lifetime of the source star, 2.5 Myrs. After reaching the R-critical state, gas in front of the I-front forms a shock, which then detaches from the slowed I-front. As an example, we plot in Fig. 5 the profiles of Phase I, halo at under different fluxes.
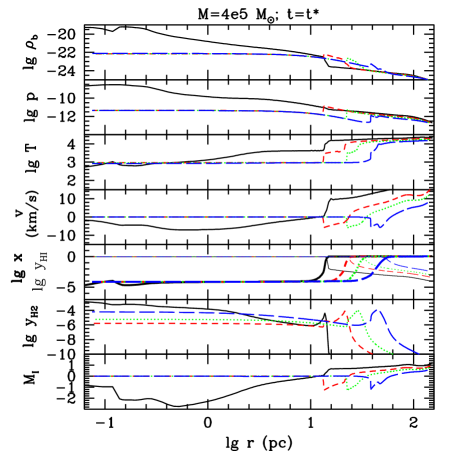
All of the post-front (ionized) gas, initially undisturbed, eventually evaporates away, accelerated outward by a large pressure gradient. As the line-of-sight is cleared by this evaporation, ionizing radiation penetrates deeper, until the source turns off. See Figs 5, 6 and 7 for the evolution of the I-front.
This result invalidates the initial condition adopted by O’Shea et al. (2005) and Mesinger et al. (2006) which led them to find that formed in the core region after it was ionized and then cooled while recombining, once the source turned off. As we show, the core remains neutral before and after the source is turned off, so the mechanism explored by O’Shea et al. (2005) does not work. This neutral core, therefore, must find a different way to cool and collapse if star formation is to happen in the target minihalo.
What happens to the initially ionized gas after the star turns off? This gas recombines as it cools radiatively and by adiabatic expansion, even forming molecules. We find that this cooling cannot reverse the evaporation, however. Gas is simply carried away with the initial momentum given to it when it was in an ionized state. In Table 1, we list the fraction of the baryonic halo mass which is ionized during the lifetime of the star. This mass serves as a crude estimate of the mass lost from these haloes by evaporation. We found no major difference between Phase I and Phase II in this matter, so we provide only one table.
| Total Halo Mass in units | ||||||
| (Halo Baryon Mass in units) | ||||||
| (pc) [] | ||||||
| 180 [46.3] | 0.95 | 0.92 | 0.88 | 0.84 | 0.82 | 0.79 |
| 360 [11.6] | 0.85 | 0.81 | 0.77 | 0.74 | 0.70 | 0.67 |
| 540 [5.14] | 0.78 | 0.74 | 0.70 | 0.66 | 0.62 | 0.59 |
| 1000 [1.5] | 0.66 | 0.60 | 0.55 | 0.50 | 0.47 | 0.43 |

6.2 Formation of precursor shell in Front of the I-Front
We find that a thin shell of is formed just ahead of the I-front, with peak abundance . It happens mainly because the increased electron fraction across the I-front promotes the formation of . More precisely, the gas ahead of the I-front is ionized to the extent that the electron abundance is large enough to form , but at the same time too low to drive significant collisional dissociation of . The width of this shell and the amount of in this region is determined by the hardness of the energy spectrum of the source: the width of the I-front is of the order of the mean free path of the ionizing photons. Pop III stars, in general, produce a large number of hard photons due to their high temperature, which can penetrate deeper into the neutral region than soft photons.
This precursor shell feature is evident in Figs 5, 6, and 7. We show the detailed structure of these shells in Fig. 8, where we plot the radial profile of the abundance of different species for the case of , Phase I, () at . We note the similarity between our results and those of Ricotti, Gnedin, & Shull (2001) for an I-front in a uniform, static IGM at the mean density (see Fig. 3 in Ricotti et al. 2001) which also show a precursor shell. A similar effect was reported by Susa & Umemura (2006), as well.

What is the importance of this shell in protecting the central region of haloes from dissociating radiation? The molecular column density obtained by this shell sometimes reaches , which provides an appreciable amount of self-shielding. The self-shielding due to the shell, however, is not the major factor that determines whether or not the in the core region is protected. A more important factor is which evolutionary phase the target halo is in when it is irradiated. Roughly speaking, when a target halo is irradiated early in its evolution (Phase I), the precursor shell dominates the total column density available to shield the central region, but this shielding is not sufficient to prevent photodissociation there anyway. On the other hand, if the halo is irradiated later in its evolution (Phase II), the column density of the shell is only a small part of the total column density, so shielding is successful independent of the precursor shell. We describe this in more detail as follows.
In order to understand quantitatively the importance of the shell in protecting the central fraction, we have performed simulations with a source SED that is identical to the Pop III SED below 13.6 eV, but zero above 13.6 eV. As the radiation is now incapable of ionizing the halo gas, the shell formation by partial ionization will not occur. This enables us to compare our results where the shell is present to those cases without an shell. We describe a specific case of as an illustration. Roughly speaking, the shell which forms only in the presence of ionizing radiation compensates for the amount by which the initial molecular column density, , is reduced when molecules in the ionized region are destroyed by collisional dissociation. The nett column density in the case where the shell is present even exceeds that in the case without the shell (Figs 9 and 10). The nett effect is the increase of the self-shielding. Such an increase of the self-shielding, however, is not too dramatic. In the case of with Phase I initial conditions, at the centre, about an order of magnitude higher than the central of the case without ionizing photons (Fig. 9). This molecule fraction is still too low, however, to cool the gas. On the other hand, in the case of with Phase II initial conditions, at the centre throughout the lifetime of the Pop III source, whether or not the shell is formed. The depth (radius) of penetration of dissociating photons differs by a factor of 2 if the shell is included, but the central is still protected because of the high column density apart from the precursor shell (Fig. 10). The major factor that determines the fate of the central fraction is instead the evolutionary phase of a target halo when it is irradiated. The short lifetime of a Pop III star plays an important role of either reconstituting or protecting molecules in the core, depending upon the evolutionary phase of the halo, as will be described in Section 6.4.


Note that in all cases, we use equation (13), the shielding function for thermally-broadened lines with . This is justified by the fact that the shell moves inward with and the shell achieves , where denotes the temperature of the shell. If we take this peculiar velocity as sound speed, corresponds to , where the subscript denotes the peculiar velocity. A crude way to imitate both effects by thermal broadening is to use the sum of these two temperatures ( and ). We take the most conservative stand – the least self-shielding effect – in order not to overestimate the self-shielding, and use as the temperature responsible for the nett thermal broadening of the molecular LW bands.
6.3 Formation of shock and Evolution of core
After the I-front decelerates as it enters the target halo, transforming from R-type to D-type, a shock front forms to lead the D-type front. The neutral gas in the core is strongly affected by this shock front as it propagates. This shock plays an important role in providing both positive and negative feedback effects. By identifying successive evolutionary stages of the shock, we now describe how the core responds to the shock and evolves accordingly.
6.3.1 Stage I: Formation and acceleration of Shock
A shock starts to form as the I-front, initially moving supersonically as an R-type, slows down and turns into a D-type. The pre-front gas – neutral gas ahead of the I-front – can respond to the I-front before it is swept by the I-front, because the D-type front moves subsonically into the neutral gas. It is easier to understand the formation of the shock by using the I-front jump conditions: the pre-front gas speed in the rest frame of the I-front, , derived from the I-front jump conditions, should satisfy either or , where and are the isothermal sound speeds of the pre-front and post-front gas, respectively. and have a gap of , which is nonzero in general. As the I-front slows down and starts to cross , encounters a value which is not allowed mathematically. This paradox is resolved, however, because the pre-front gas now “prepares” a new hydrodynamic condition by forming a shock. The shock wave increases and thereby reduces and increases , making it possible to satisfy the D-type condition, .
This shock-front then propagates inward, separating from the I-front, due to the discrepancy between the speed of the shock-front and the speed of the I-front. As the shock-front enters the flat-density core, the shock front starts to accelerate, leaving behind the post-shock gas with ever increasing temperature (e.g. see time steps 4 and 5 in Fig. 11, where the post-shock temperature increases as the radius decreases).
As the shock boosts the density and temperature in the neutral, post-shock gas, the formation rate there increases, boosting the column density even further. We can understand the evolution of in the presence of this shock quantitatively by using its equilibrium value, . The increase of density and temperature due to this shock promotes formation, as follows. When there is no significant destruction mechanism, the dominant formation mechanism is through (equation 1), and the formation rate becomes equivalent to the formation rate. Photo-dissociation dominates over collisional dissociation in destroying , which occurs when and (e.g. Glover & Brand 2001). Using the formation rate coefficient (de Jong, 1972)
| (25) |
and the photo-dissociation rate coefficient given by equation (12), we obtain
| (26) | |||||
where we have used the fact that one can scale by according to the following:
| (27) |
if one adopts a black-body spectrum with . As seen in equation (26), both the high temperature () and increased density ( in the case of strong shock) of the post-shock gas contributes to boosting the fraction. As , molecular self-shielding also plays an important role in determining . If the shock boosts the formation rate of and increases, so will , and with it the shielding. These two effects, therefore, amplify each other.
There is an additional mechanism to create molecules: the shock-induced molecule formation (SIMF). The acceleration of the shock-front accompanied by an increasing post-shock temperature, leads to a partial ionization of the post-shock gas in many cases, when the right condition () is met to trigger collisional ionization – see, for example, step 5 in Fig. 11: the centre is shock-heated above , with a boost in . The electron fraction now reaches , which promotes further formation. This mechanism is indeed identical to the formation mechanism in a gas that has been shock-heated to temperatures above (Shapiro & Kang, 1987; Kang & Shapiro, 1992). When a gas cools radiatively from a temperature well above , it cools faster than it recombines. As a result, the recombination is out of equilibrium, and an enhanced electron fraction exists at temperatures even below compared to the equilibrium value. This electron fraction triggers the formation of through the gas-phase reactions (equations 1 and 2).
SIMF does not always occur, however. The shock-front can accelerate when the pre-shock density remains almost constant (e.g. Fig. 11). If the density increases faster than the shock propagates, on the other hand, the shock-front will encounter an ever increasing density “hill” and it will never accelerate to generate post-shock temperature above (e.g. Fig. 12). The dependence of SIMF on the halo mass, source flux, and the initial phase will be described in Section 6.4.
6.3.2 Stage II: Cooling and Compression of Core
As the shock-front approaches the centre of the halo, the post-shock gas there becomes more concentrated and denser than the pre-shock gas. This shock-induced compression leads to a very fast molecular cooling in the core and further compression in almost a runaway fashion, as follows.
Molecular cooling occurs very rapidly at a high density and temperature condition. Assuming that the pre-shock gas of the halo core remains unchanged before the shock-front arrives – as is usually the case in Phase I – and the shock is strong, the post-shock density of the core becomes 4 times higher than that of the pre-shock, namely in a TIS halo core at . At the same time, post-shock temperature can be as high as . The molecular cooling time, , is
| (28) |
where is the hydrogen mass fraction, and is the molecular cooling rate. For a gas with and , , and thus
| (29) |
With such a rapid cooling, the isothermal shock jump condition () is a good approximation, and the post-shock density becomes even higher than that of the adiabatic strong shock, because now. Such a strong compression of the core is observed very frequently in our parameter space of different halo masses and source fluxes. For example, Fig. 13 shows how the centre of a halo with evolves in response to the shock. As the shock hits the centre, density increases by many orders of magnitude.
Does this compression eventually lead to the core collapse? As the shock carries the kinetic energy as well as the thermal energy, the shock will bounce off the centre after it hits the centre. In the following section, we describe this final stage of the shock propagation and show how it will affect the core collapse.
6.3.3 Stage III: Bounce of Shock and Collapse of Core
After the shock hits the centre, the shock wave will be reflected and propagate outward. In our 1D calculation, this reflection will mimic the transmission of the shock wave through the centre. This bouncing shock will try to disrupt the gas. The core that is undergoing cooling and compression due to the positive feedback effects mentioned so far will be affected by this negative feedback effect, as well.
The final fate of the core depends on how well the core endures such a disruption. As the shock bounces off the centre, density starts to decrease. If this bounce is weak, the core quickly reassembles, cools, and finally collapses. If this bounce is strong, the core will take a longer time to collapse and, in some cases, the core will never collapse within the Hubble time. Haloes of smaller mass seem to be more susceptible to this shock-bounce than those of larger mass (see Figs 14 and 15 for comparison).
If the core finally takes the collapse route, the central hydrogen number density increases to , at which point the ro-vibrational levels of are populated at their equilibrium values and the molecular cooling time becomes independent of density (e.g. Abel et al. 2002). Since then, adiabatic heating dominates over the molecular cooling, and the temperature increases as collapse proceeds. Finally, when reaches , the three-body hydrogen reaction ensues and converts most hydrogen atoms into the molecules, which will undergo a further collapse and form a proto-star.


6.4 Feedback of Pop III starlight on Nearby Minihaloes: parameter dependence of core collapse
We now summarize the outcome of our full parameter study of radiative feedback effects of Pop III starlight on nearby minihaloes. As we have described in the previous section, positive and negative feedback effects of the shock compete and produce a nett effect which can be either 1) an expedited collapse, 2) delayed collapse, 3) neutral (unaffected) collapse, or 4) a disruption.
Overall, the radiative feedback effect of a Pop III star is not as destructive as naively expected. Minihaloes with , which can cool and collapse without radiation, are still able to form cooling and collapsing clouds at their centre even in the presence of Pop III starlight. The quantitative results are summarized in Tables 2, 3 and Fig. 16.


The relatively short lifetime of a Pop III star, compared to the recombination timescale in the core, is a key to understanding this behaviour. One of the necessary conditions for the core collapse is that molecular cooling should occur in the core. As this requires a sufficient molecular fraction, namely , it is crucial to understand how molecules are created at such a level. In Phase I (low and high ), radiation can easily dissociate while the source is on, but after the source dies, the high electron fraction stimulates formation. This is possible because the recombination time in the TIS core is longer than the lifetime of the source Pop III star. On the contrary, in Phase II (high and low ), is more easily protected against the dissociating radiation because the higher column density provides self-shielding and compression increases the formation rate. Because the source irradiates these haloes for a short period of time, the dissociation front does not reach the centre, and its high molecule fraction is preserved throughout the Pop III stellar lifetime.
6.4.1 Phase I
When haloes start their evolution from Phase I – IGM chemical abundance and the TIS structure –, other than the change of collapse times, there is no reversal of collapse. In other words, haloes that were destined to cool and collapse would do so even when exposed to the first Pop III star in the neighbourhood. Minihaloes with are able to collapse without radiation, while those with are not. In the presence of radiation, haloes with are still able to collapse, while those with are still unable to do so, even with the help of shock-induced molecule formation (Fig. 16; Table 2).
The core collapse in Phase I occurs mostly as an expedited collapse (Table 2). The shock plays a major role in driving such an expedited collapse: the fraction becomes boosted by the higher density and high temperature delivered by the shock. Whether or not SIMF has occurred, such a boost in is sufficient to expedite the core collapse.
There is one delayed collapse case at the low mass and the high flux end. For at , the boosted molecule formation is not sufficient to bring the core to an immediate collapse. As the shock bounces, the momentum carries gas away from the centre until it cools and recollapses.
The unchanged collapses occur at the high mass and the low flux end. For at , the shock propagates into the already collapsing core. The shock energy delivered in these cases is not significant enough to change the course of collapse.
| Total Halo Mass in units | ||||||
| (Collapse Time without Radiation in Myrs units) | ||||||
| (pc) [] | ||||||
| 180 pc [46.3] | ||||||
| 360 pc [11.6] | ||||||
| 540 pc [5.14] | ||||||
| 1000 pc [1.5] | ||||||
6.4.2 Phase II
The overall effect of radiation from a Pop III star on neighbouring minihaloes in Phase II is similar to the effect on the minihaloes in Phase I: haloes that were destined to cool and collapse would do so even when exposed to the first Pop III star in the neighbourhood. A slight shift of the trend exists, however, in Phase II (Fig. 16; Table 3). When haloes start their evolution from Phase II, those with are able to collapse without radiation, while those with are not. The collapse in Phase II is reversed (halted) for the low mass end: for , the shock disrupts the core and it never recollapses. SIMF occurs at for , but this does not prevent such a destructive process from happening.
As haloes start their evolution from Phase II, in which the halo cores are already cooling and collapsing, the neutral (unaffected) collapse cases occur more frequently than in Phase I. At high and intermediate masses, the collapse time hardly changes from the case without radiation. Haloes with collapse before the source dies, as they do without radiation, simply because the shock wave does not affect the core. In this case, shock propagates into the centre after collapse has advanced significantly.
There is one delayed collapse case: compared to the delayed collapse in Phase I, which occurred at low mass/high flux end ( at ), this now occurs at an intermediate mass/high flux end ( at ). Otherwise, for intermediate mass, collapse is either neutral or expedited.
| Total Halo Mass in units | ||||||
| (Collapse Time without Radiation in Myrs units) | ||||||
| (pc) [] | ||||||
| 180 pc [46.3] | ||||||
| 360 pc [11.6] | ||||||
| 540 pc [5.14] | ||||||
| 1000 pc [1.5] | ||||||
6.5 The structure of haloes at the moment of collapse
The structure of halo at collapse determines how a protostar evolves into a star and how the starlight will later propagate through the host halo. We first show how halo profiles at collapse vary for different mass without radiation. We then describe how halo structure is affected by the Pop III starlight.
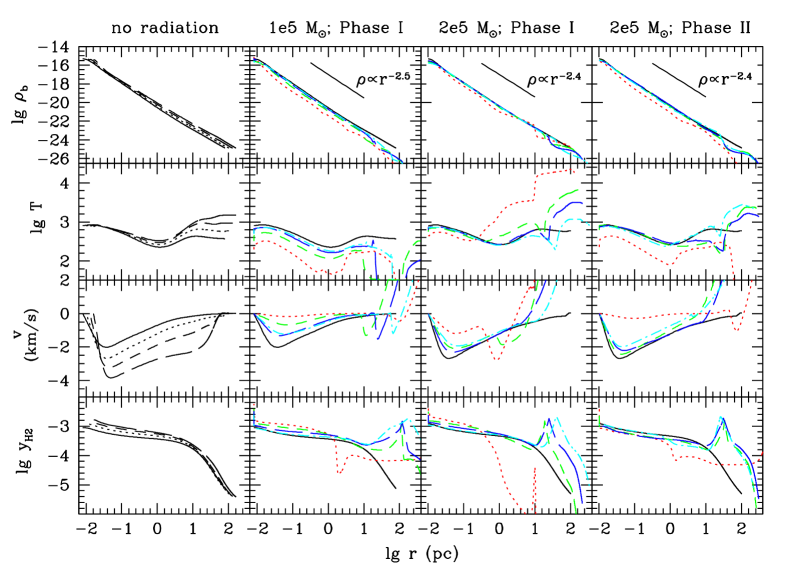
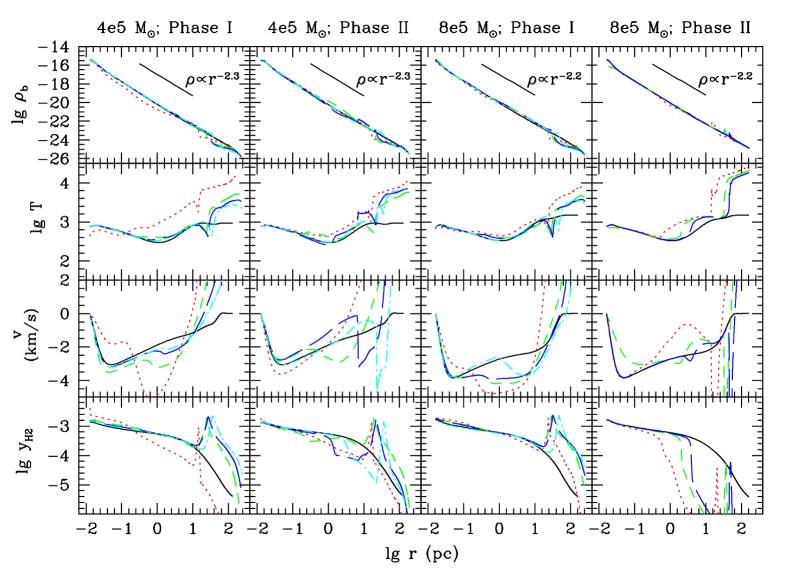
We note that halo structure shows a strong dependence on the halo mass. For radius , density profiles of haloes without radiation are well fit by a power law, . The value of , however, is dependent upon the mass of the halo. We find that , 2.4, 2.3, and 2.2 for haloes of mass , , , and , respectively. In all cases, the temperature is somewhat flat with . The temperature at , where (or ), is about in all cases. The universality of these core properties seems to originate from the fact that the dominant process, cooling, causes loss memory of the initial condition (e.g. different virial temperatures for different virial masses). The outer part of these haloes, however, still retain the memory virial equilibrium because radiative cooling is negligible. Overall, as mass decreases, density slope increases (see Fig. 17).
The radiative feedback effect of the starlight on final halo profiles is found to be negligible in most cases. The region that has been photo-ionized during the stellar lifetime is obviously strongly affected. The neutral region, however, is almost indistinguishable from the case without radiation in most cases. The variance of temperature profile exists only at the low-mass end, , or the high-flux end, (). Such variance completely disappears at the high-mass end, , because collapse is mostly unaffected (Fig. 17).
This result indicates that the mass of secondary Pop III stars would be almost identical to that of the Pop III stars which form without radiative feedback effect. A more fundamental variance may exist, however, due to the environmental variance of star forming regions: O’Shea & Norman (2006) show that temperature variance of different regions result in the variance of protostellar masses, due to the corresponding variance of mass infall rate. As our simulation does not advance beyond , where three-body collision can produce copious amount of molecules and change the adiabatic index of the gas, we are unable to quantify the final mass of the protostar at this stage.
6.6 Feedback of Pop III Starlight on Merging Haloes and Subclumps
While we were preparing this manuscript, two preprints were posted describing simulations of the radiative feedback of the first Pop III star on dense gas clumps even closer to the star than the external minihaloes we have considered so far, for the case of subclumps (Susa & Umemura, 2006) and the case of a second minihalo undergoing a major merger with the minihalo that hosts the first star (Abel et al., 2006). The centre of the target halo or clumps in this case is well within the virial radius of the halo which hosts the first star, and, these authors find that secondary star formation occurs in these subhaloes. Abel et al. (2006), for instance, report that the first star forms inside a minihalo of mass as it merges with a second minihalo of mass (the target halo). The centre of this target halo is at a distance of only 50 parsecs from the first star. Cooling and collapse leading to the formation of a protostar is found to occur inside the target halo about 6 Myrs after the first star has died.
We ask the same question that whether or not a halo would collapse to form a secondary Pop III star if a nearby Pop III star irradiates the halo at a distance of 50 pc. Note that the target halo we consider now would collapse anyway if there were no radiation, in Myrs for Phase I and Myrs for Phase II (see Table 4). This problem requires us to extend our parameter space beyond what has been considered so far, because of the short distance (high flux) between the source and the target.
We have attempted to reproduce the result of Abel et al. (2006) using our code for a target halo of mass and , corresponding to the ionizing flux . Note that the LW band flux is very high: (equation 27). As is smaller than the virial radius of the target halo, we truncated the halo profile at 50 pc. To be consistent with our previous calculations, we neglect the geometrical variation of the flux with position inside the target halo.
Surprisingly enough, contrary to the outcome of Abel et al. (2006), we find that collapse is expedited, occurring within the lifetime of the first star, for both Phase I and Phase II initial conditions. The main mechanism was SIMF: initially, is completely wiped out by a strong dissociating radiation, but as the SIMF occurs, newly created molecules lead to cooling and collapsing. This result is in disagreement with the result of Abel et al. (2006), which shows that the second star forms after the star has died.
This puzzling result shows the importance of self-shielding. Abel et al. (2006) performed an optically-thin calculation for Lyman-Werner bands, neglecting the self-shielding, while our calculation took the self-shielding into account. In order to mimic their calculation more consistently, we artificially performed an optically-thin calculation for Lyman-Werner bands. We found that, if the target halo is irradiated without self-shielding, the core collapse is delayed and occurs after the star dies both in Phase I and Phase II. In our simulations without self-shielding, the core bounced and recollapsed in 44 Myrs and 111 Myrs after the star has turned off in Phase I and Phase II, respectively (Table 4).
Qualitatively, our calculation without self-shielding agrees with the result of Abel et al. (2006), that collapse in the target halo occurs after the source dies. We find that SIMF is the main mechanism for the formation of . Initially, the strong LW band photons destroy molecules in the core. As the shock propagates inward, however, boosted density and temperature of the post-shock gas enhances the molecule fraction (equation 26), and increases the column density. As the shock front accelerates, SIMF occurs, and newly created is protected from the LW band photons because of increased self-shielding. If self-shielding is not accounted for, however, this is destroyed and never restored, so collapse does not proceed during the lifetime of the source.
We conclude, therefore, that neglecting self-shielding in calculation explains why Abel et al. (2006) observes a delayed collapse. The quantitative disagreement between our collapse times (when we neglect self-shielding) and theirs may originate from the difference in the structure and chemical abundances of the target halo when the source irradiates it.
How do our results compare with those of Susa & Umemura (2006)? A fundamental difference exists other than the fact that their work is limited to subclumps of a halo that hosts a Pop III star. They interpret the shock only as a carrier of negative feedback effect, while the shock, in our case, delivers both the positive and negative feedback effects. In their shock-driven evaporation (Model C) case, the collapsing core eventually fails to collapse, because the shock heats the core before it finishes collapse. Their successful collapse case (Model B) is simply an unaltered collapse: an already collapsing core finishes collapse before the shock front reaches the centre. On the other hand, we have observed expedited collapses as well as delayed or failed collapse. Such expedited collapses we observe are truly positive feedback effects. Quantitatively, because of their limited interpretation of the role of the shock, they argue that only regions with hydrogen number density , high enough to finish collapse before the shock front reaches the centre, can collapse under the influence of Pop III starlight. On the contrary, we find, for instance, that regions with – core density of TIS haloes in Phase I – can cool and collapse even after the shock front has reached the centre. As the shock-front accelerates and delivers strong positive feedback effects in the small core region, high resolution is required to produce this mechanism in simulations. The relatively poor resolution of SPH simulations by Susa & Umemura (2006) might have prevented them from fully resolving the shock structure in the core, and potentially producing the positive feedback effects.
Our result indicates that secondary star formation may occur even in subclumps of the host halo, which are subject to much stronger radiative feedback than isolated, nearby minihaloes. We have shown in this section that self-shielding is important even at this high level of ionizing () and dissociating () fluxes. It is even more surprising because the collapse is expedited and coeval formation of Pop III stars in the same neighbourhood is possible. The naive expectation of negative feedback effect of a Pop III star in its neighbourhood, therefore, should be revisited.
| no radiation | self-shielding | no self-shielding | |
|---|---|---|---|
| Phase I | 11.2 | 1.1 | 47 |
| Phase II | 2.7 | 1.3 | 114 |
7 Summary/Discussion
We have studied the radiative feedback effects of the first stars (i.e. Pop III stars) on their nearby minihaloes, by solving radiative transfer and hydrodynamics self-consistently using the 1-D spherical, radiation-hydrodynamics code we have developed. The results can be summarized as follows:
-
•
We identified the minimum collapse mass, namely the mass of minihaloes which are able to have a core which cools and collapses in the absence of external radiation. We find that at . In determining , we applied two criteria. First, the collapsing region should reach to be considered as a collapse. Second, this should occur within the Hubble time. The minimum collapse mass we find roughly agrees with that of Machacek et al. (2001), where the AMR scheme they used seems to have resolved the inner structure of minihaloes.
-
•
Minihaloes could have been in very different stages of their evolution when they were irradiated by a Pop III star. We used two different initial conditions to represent such phase differences. In Phase I, chemical abundances have not yet evolved away from their IGM equilibrium values. This stage is characterized by low fraction, and high electron fraction, at the centre. Haloes can be irradiated in Phase II, which is the state of these haloes evolved from Phase I, where has dropped to by recombination. Phase II is characterized by high fraction , low electron fraction , and core density higher than that of Phase I.
-
•
Within our parameter space, the I-front is trapped before reaching the core in all cases. Ionized gas evaporates, and a shock-front develops ahead of the I-front and travels into the core. The shock front leads to both positive and negative feedback effects. A boost in density and temperature by a shock increases the formation rate. In some cases, the shock accelerates and obtains a temperature above , which is high enough to drive collisional ionization, which then leads to a further boost in fraction. The high temperature and kinetic energy delivered by the shock, on the other hand, tries to disrupt the gas. The nett effect is either 1) an expedited collapse, 2) delayed collapse, 3) neutral (unaffected) collapse, or 4) a disruption, depending upon the flux, halo mass, and the initial condition when irradiated.
-
•
At the moment of collapse, halo profiles under radiation are almost identical to those without radiation. Density profiles of different mass haloes are well fit by different power-law profiles, , where , 2.4, 2.3, and 2.2 for , , , and , respectively. Some variation in temperature profile exists at the low-mass end, , and the high-flux end ().
-
•
Overall, the radiative feedback effect of Pop III stars is not as destructive as naively expected. Minihaloes with are still able to form cooling and collapsing clouds at their centres even in the presence of radiation. A simple explanation is possible for such behaviour. In Phase I (low and high ), radiation can easily dissociate while the source is on, but after the source dies, high electron fraction allows formation. On the contrary, in Phase II (high and low ), is more easily protected against the dissociating radiation because the higher column density provides self-shielding and compression increases the formation rate. The situation becomes more complicated, however, by other feedback effects which will be described in the following bullets.
-
•
Within our parameter space, haloes that are irradiated at Phase I experience expedited collapse predominantly for , except for the delayed or neutral collapses occurring at the low mass/high flux and the high mass/low flux extremes (e.g. for at and for at ).
-
•
Haloes that are irradiated at Phase II show a more complicated behaviour. In this case, unaffected collapse is more frequent, in general, at high and intermediate masses, while for , core collapse is now reversed at any . Delayed collapse occurs for at . Unaffected collapse occurs for for any , and for at . Otherwise, for intermediate mass, collapse is either neutral or expedited.
-
•
We first find in this paper that coeval formation of Pop III stars is possible even under the influence of ionizing and dissociating radiation from a first star. This occurs either as an expedited collapse or an unaffected collapse. Among those parameters explored in this paper, expedited collapse occurs during the lifetime of the source star when a halo of mass in Phase I is irradiated by a Pop III star at a distance (). Unaffected collapse occurs for haloes of mass in Phase II during the lifetime of the source star for all different distances (fluxes).
-
•
Extending our parameter space to include a specific case studied by Abel et al. (2006), a minihalo merging with a halo hosting a Pop III star, we find that the coeval formation of Pop III stars is possible even in this high ionizing () and dissociating () flux case. While Abel et al. (2006) find that the secondary star formation in this target halo occurs after the first star dies because of destruction by photodissociation, we find that the minihalo core collapse is expedited to form a star in , long before the first star dies, due to the SIMF and self-shielding. This discrepancy comes from the fact that we account for the effect of self-shielding, while they do not. A proper treatment of self-shielding is important even for such a high flux regime, because the central fraction can reach due to the SIMF and strong self-shielding is possible due to newly created .
We find the minimum collapse mass at without radiation. While our result agrees roughly with that of the 3D AMR simulation by Machacek et al. (2001), discrepancy becomes larger with those of 3D SPH simulation results (e.g. Fuller & Couchman 2000; Yoshida et al. 2003) and a semi-analytical calculation using a uniform-sphere model (Tegmark et al., 1997). This implies that the central region of haloes should be resolved well in order to quantify the minimum collapse mass exactly.
What does the result of our paper imply for the “first” H II region created by Pop III stars? Because a significant fraction of nearby minihaloes can host second generation stars within the first H II region, it is possible that such a subsequent star formation may at least keep the first H II regions ionized. It may even be possible that individual H II regions grow and overlap, thus finishing the first cosmological reionization. A semi-analytic calculation of minihalo clustering around high density peaks, for example, might allow us to quantify how fast and how big such bubbles can grow. Without secondary star formation, this would simply be a relic H II region in which gas recombines and cools after the source star dies, possibly with metal enrichment from supernova explosion (e.g. Bromm et al. 2003).
We found that the minimum collapse mass is even in the presence of Pop III starlight. Such a low value may affect the reionization history significantly. Alvarez et al. (2006a) estimates that the instantaneous ionized mass fraction at is , if individual haloes host one Pop III star each. If the typical mass scale of host haloes is instead, as the number density of haloes would be roughly 10 times as big as that for , Pop III stars alone would be able to finish cosmological reionization at 666This argument is based upon the fact that the comoving number density of haloes, , is roughly proportional to . The minihalo population, however, might have been severely reduced by the “Jeans-mass filtering” inside ionized bubbles created around rare, but more massive objects (e.g. Iliev et al. 2006), in which case sources hosted by minihaloes would make negligible contribution to cosmic reionization.. New reionization sources will form later in more massive haloes with , which will host a region cooling by the hydrogen atomic cooling. Depending upon how fast such transition occurs, the global reionization history will have different characteristics (e.g. monotonic growth of ionization fraction vs. double reionization).
In this paper, we have considered only the radiative feedback effect. Pop III stars, however, may exert additional feedback effects. The H II region developed by a Pop III star inside the host halo breaks out as a “champagne flow” inside the host minihalo, where the I-front separates from the shock-front and runs ahead, transforming from D-type to R-type. The shock front left behind also expands into the IGM and nearby minihaloes would be encountered by this shock-front ultimately. Other feedback effects will come from supernova explosions. If the first star dies and explodes as a supernova, both dynamical and chemical feedback effects would alter the fate of nearby minihaloes, as well.
How would the additional presence of dissociating background radiation affect our results? In this paper, we have considered the effect of the radiation from an individual nearby Pop III star, whose SED takes a black body form for a short lifetime ( Myrs). This is the case appropriate to the earliest star formation. It is valid whenever a minihalo resides in a place and time where the background from other, more distant stars is negligible. On average, however, the mean free path to dissociating radiation is greater than that for ionizing radiation prior to reionization, so the situation can arise in which the ionizing radiation from distant sources is filtered out but the UV radiation in the LW bands is not. Suppose a minihalo is under the influence of both Pop III starlight from a nearby star and a persistent background radiation field in the LW bands. In the absence of the nearby star, the dissociating background can only hinder the formation of and its cooling. As such, the fraction inside the minihalo when the nearby Pop III star starts to irradiate it would be lower than it would have been without the background. In this case, even if the background were intense enough on its own to prevent the minihalo from cooling and collapsing, the minihalo could still host a cooling core if formed by the positive feedback from the Pop III star, despite the presence of the background. Indeed, this could occur frequently, because we find that a high electron fraction – and, thus a high fraction – can be achieved by collisional ionization in the postshock region in many cases (SIMF; see Section 6.3.1). This newly created will then be easily protected from the dissociating background by self-shielding, since our simulation results show that this SIMF survives even the much larger – albeit short-lived – flux of dissociating radiation from a nearby star in our most extreme case, , as has been shown in Section 6.6. Thus, the background would then only prevent those haloes that cannot “host” this SIMF mechanism from cooling and forming stars. We will address this issue further in the future.
As the focus of our paper is the fate of neutral cores of target haloes, in which the ionized fraction never exceeds , we neglected processes which are relevant only when gas achieves high ionized fraction, such as HD cooling and charge exchange between () and () (see e.g. Yoshida et al. 2006). These processes may be important, however, in the relic H II region outside the target minihalos. For instance, HD cooling may cool gas down below the cooling temperature plateau, , if formation and cooling start from a highly ionized initial state (e.g. Johnson & Bromm 2006).
We chose two different evolutionary phases of nearby minihaloes as our initial conditions. A more natural way to address this problem is to use the structure and chemical composition of minihaloes and IGM from 3-D, chemistry-hydrodynamics calculation. We intend to extend our study in a more consistent manner by combining a 3-D, chemistry-hydrodynamics simulation and the 1-D, radiation-hydrodynamics simulation in the future. In this paper, we simply adopted a model for virialized haloes (TIS profile). In the future, we will also implement a more realistic growth history of haloes (e.g. Wechsler et al. 2002) to account for the dynamical effect of mass accretion.
Acknowledgments
We thank M. Alvarez, T. Abel, S. Glover, I. Iliev, B. O’shea, H. Susa, and D. Whalen for helpful discussions. We also acknowledge the Institute for Nuclear Theory at the University of Washington for their support and hospitality. This work was supported by NASA Astrophysical Theory Program grants NAG5-10825, NAG5-10826, NNG04G177G.
Appendix A Numerical Method and Code Tests
Here we describe the finite-difference scheme used for our 1-D spherical, radiation-hydrodynamics code. The subscript, unless noted otherwise, denotes the position of a shell. The superscript denotes the time. For instance, is the zone-centred density of shell at time , and is the zone-edge-centred radius of shell at time .
A.1 The Gas Dynamical Conservation Equations
Hydrodynamic conservation equations for the baryonic component (eqs. [3] - [5]) are solved following the finite-difference scheme by Thoul & Weinberg (1995). We first update the velocity and position using the so-called “leap-frog” scheme, so that the velocity and the position are staggered in time:
| (30) |
and
| (31) |
which are second-order accurate. As the mass of each shell is conserved for such a Lagrangian scheme, density is updated following
| (32) |
In these equations,
| (33) |
and
| (34) |
We then advance the energy by
| (35) | |||||
Shocks are treated with the usual artificial viscosity technique. The pressure in the momentum and energy conservation equations is replaced by , where
| (36) |
if , and otherwise. We use , which spreads the shock fronts over four or five cells.
Dark matter shells are also updated according to equations (30) - (36) – note that we use fluid approximation as described in Section 2.2 –, except that the heating/cooling term is zero in equation (35). Note that the dark matter shells are allowed to have effective shock in our fluid approximation, and therefore we need to compute the artificial viscosity when dark matter shells are converging (equation 36), as in the case of the baryonic gas component.
A.2 Time Steps
Time step for the finite-differencing is chosen such that important fluid variables do not change abruptly. The relevant time scales are the dynamical, sound-crossing (Courant), cooling(heating), and species-change time scales. In addition, to ensure that the fluid shells do not cross, we also adopt a shell-crossing time.
| (37) |
| (38) |
| (39) |
| (40) |
| (41) |
| (42) |
where , , , , and are coefficients that ensure accurate calculation of the finite difference equations. We use , , , , and .
In practice, we frequently find that can be very small compared to other time scales. We sometimes disregard in order to achieve computational efficiency. We confirmed, especially in our problem, that such a treatment does not produce any significant discrepancy from a calculation with considered. When the virial temperature of a halo is close to the cooling temperature plateau, for instance, must be irrelevant because gas would be almost hydrostatic.
A.3 Radiative Transfer
For the radiation field generated from a point source at the centre, the radiative rate coefficient of species at radius is given by equation (15). Finite-differencing this rate coefficient, however, requires some caution. For the baryonic shell at position (smaller means closer to the centre) whose inner edge and outer edge have radii and , respectively, the incident differential flux at the outer edge is , and one could naively calculate the rate coefficient of species by
| (43) |
As mentioned already in Section 2.3.2 and Section 2.4.1, however, this expression may not yield an accurate result when the shell is optically thick. In this case, may change substantially over the shell width, and equation (43) might overpredict the ionization rate by applying a constant flux over the shell width (). One may, in principle, choose to set up the initial condition such that all shells are optically thin. However, such a scheme can be very expensive computationally, especially when collapsed haloes are treated. In order to resolve this problem, we use the “photon-conserving scheme” by Razoumov & Scott (1999) and Abel et al. (1999). In this treatment, the number of photons that are absorbed in a shell is the same as the number of ionization events. Equation (43) can then be re-written as
| (44) | |||||
where , is the optical depth of a shell on a species , and is the volume of the shell. Note that when , equation (44) becomes equivalent to equation (43). For each species, the corresponding radiative reaction rate is calculated by quadrature, by summing the integrand in equation (44), then summing over the frequency to obtain the nett radiative reaction rate.
A.4 Nonequilibrium Chemistry
As described in Section 2.5, in order to update the abundance of species , we adopt the finite difference scheme by Abel et al. (1997). Based upon equation (17), each species is updated by
| (45) |
where the species is the previously updated value in the order given by Abel et al. (1997) (note that the letter (, ) in superscript denotes the time (, ). The order they find to be optimal is H, , He, , and , followed by the algebraic equilibrium expressions for and , and finally , again by equation (45).
A.5 Numerical resolution
In practice, we use dark matter and fluid shells sampled uniformly (in radius) from the centre to the truncation radius . We put a small reflecting core at the centre with negligible size, namely . Such a core is found to be useful in reducing undesirable numerical instability at the centre. Our choice is conservative enough not to affect the overall answer.
A wide range of radiation frequency (energy), , is covered by , logarithmically spaced bins, , together with additional, linearly-spaced bins where radiative cross sections change rapidly as frequency changes. About a dozen linearly spaced bins at each of those rapidly changing points turned out to produce reliable results.
Appendix B Rate coefficients
In Table 5, we list the chemical reaction rates we implemented in our code and the corresponding references. The rate coefficients (1-19) and radiative cross sections (20-26) are mostly from the fit by Shapiro & Kang (1987), except for a few updates.
| Reactions | Reference | |
|---|---|---|
| 1 | Janev et al. (1987) | |
| 2 | Case B; Osterbrock (1989) | |
| 3 | Janev et al. (1987) | |
| 4 | Aldrovandi & Pequignot (1973) | |
| 5 | AMDIS Database; Abel et al. (1997) | |
| 6 | Spitzer (1978) | |
| 7 | de Jong (1972); Shapiro & Kang (1987) | |
| 8 | Bieniek (1980) | |
| 9 | Ramaker & Peek (1976) | |
| 10 | Karpas et al. (1979) | |
| 11 | Dove & Mandy (1986) | |
| 12 | Savin et al. (2004) | |
| 13 | Mitchell & Deveau (1983) | |
| 14 | Janev et al. (1987) | |
| 15 | Izotov & Kolesnik (1984) | |
| 16 | Duley & Williams (1984) | |
| 17 | Poulaert et al. (1978) | |
| 18 | Schneider et al. (1994) | |
| 19 | Dalgarno & Lepp (1987) | |
| 20 | Osterbrock (1989) | |
| 21 | Osterbrock (1989) | |
| 22 | Osterbrock (1989) | |
| 23 | de Jong (1972); Shapiro & Kang (1987) | |
| 24 | Dunn (1968) | |
| 25 | Oneil & Reinhardt (1978) | |
| 26 | Bates & Öpik (1968) | |
| 27 | Section 2.3.1; Draine & Bertoldi (1996) |
Appendix C Code tests
We now extend the description of our code test problems in Section 2.6 and show the results.
(A) The self-similar, spherical, cosmological infall problem (Bertschinger, 1985): A point mass, if placed in an unperturbed Einstein-de Sitter universe, will make all particles around it to be gravitationally bound, leading to a successive turnaround and collapse of spherically shells. Infalling matter will be shocked and form a virialized structure, whose profiles are well described by a self-similar solution. We restrict ourselves to purely baryonic fluid with the ratio of specific heats .
The turnaround radius , at which the Lagrangian proper velocity of a shell is zero, evolves as
| (46) |
where defines the seed mass added to the Einstein-de Sitter universe,
| (47) |
where the initial cosmic mean density at . The shock radius is a constant fraction of : for . The dimensionless radius and the dimensionless density , where the cosmic mean density , satisfy the unique Bertschinger solution. In Fig. 18, we show the density profiles and , obtained from the simulation with , .
(B) The self-similar blast wave from a strong, adiabatic point explosion in a uniform gas (Sedov, 1959): A point explosion drives a self-similar blast wave through the initially static, uniform medium. A strong shock is generated, and , where is the thermal energy of explosion, is the initial density, and is a dimensionless constant determined by . For , . We use , , and for simulation results displayed in Fig. 18.

(C) The propagation of an I-front from a steady point-source in a uniform, static medium: This is the case where the classical description of the Strömgren radius is plausible, since gas is forced to remain static, and photoionization and recombination are the only physical processes determining the ionized fraction. The I-front from a point source with number of ionizing photons evolves as
| (48) |
where is the Strömgren radius, is the recombination time, and is the recombination rate coefficient. We adopt , , and . For this test, we use a monochromatic light whose frequency is slightly above the hydrogen ionization threshold.
(D) the gas-dynamical expansion of an H II region from a point source in a uniform gas (Lasker, 1966): The I-front, initially propagating as a weak R-type front into a uniform medium, slows down and travels as a D-type front, developing a shock front ahead of it. The I-front evolves as
| (49) |
where is the initial Strömgren radius, is the time measured from the moment when , and is the isothermal sound speed of the ionized gas (Spitzer, 1978). We adopt and . Following Lasker (1966), we force temperature of the ionized gas to be , which gives .
(E) The gas-dynamical expansion-phase of the H II region from a point-source in a nonuniform gas whose density varies with distance from the source as , (Franco, Tenorio-Tagle, & Bodenheimer, 1990): This case is similar to the case (D), except that the density follows a power law, . Inside the core radius , the density is constant at . The I-front evolves as
| (50) |
where is the size of the initial H II region obtained by equating the ionization rate and the recombination rate. For instance, when ,
| (51) |
where .
If , the shock front always travels ahead of the I-front. If , however, the shock front is overtaken by the I-front, which soon runs to infinity in this “champagne” phase. We restrict ourselves to this critical exponent . From equation (50), we obtain . In our simulation, we use , , , and . Temperature of the ionized gas is set at , such that .
References
- Abel et al. (1997) Abel, T., Anninos, P., Zhang, Y., & Norman, M. L. 1997, New Astron., 2, 181
- Abel et al. (2000) Abel, T., Bryan, G. L., & Norman, M. L. 2000, ApJ, 540, 39
- Abel et al. (2002) — 2002, Sci, 295, 93
- Abel et al. (1999) Abel, T., Norman, M. L., & Madau, P. 1999, ApJ, 523, 66
- Abel et al. (2006) Abel, T., Wise, J. H., & Bryan, G. L. 2006, astro-ph/0606019
- Ahn & Shapiro (2005) Ahn, K., & Shapiro, P. R. 2005, MNRAS, 363, 1092
- Aldrovandi & Pequignot (1973) Aldrovandi, S. M. V., & Pequignot, D. 1973, A&A, 25, 137
- Alvarez et al. (2003) Alvarez, M. A., Ahn, K., & Shapiro, P. R. 2003, RevMexAA Conf. Ser., 18, 4
- Alvarez et al. (2006a) Alvarez, M. A., Bromm, V., & Shapiro, P. R. 2006a, ApJ, 639, 621
- Alvarez et al. (2006b) Alvarez, M. A., Shapiro, P. R., Ahn, K., & Iliev, I. T. 2006b, ApJL, 644, L101
- Anninos et al. (1997) Anninos, P., Zhang, Y., Abel, T., & Norman, M. L. 1997, New Astron., 2, 209
- Bates & Öpik (1968) Bates, D. R., & Öpik, U. 1968, J. Phys. B: At. Mol. Phys., 1, 543
- Bertschinger (1985) Bertschinger, E. 1985, ApJS, 58, 39
- Bieniek (1980) Bieniek, R. J. 1980, J. Phys. B, 13, 4405
- Binney & Tremaine (1987) Binney, J., & Tremaine, S. 1987, Galactic dynamics (Princeton, NJ, Princeton University Press, 1987, 747 p.)
- Bromm et al. (1999) Bromm, V., Coppi, P. S., & Larson, R. B. 1999, ApJL, 527, L5
- Bromm et al. (2002) — 2002, ApJ, 564, 23
- Bromm et al. (2003) Bromm, V., Yoshida, N., & Hernquist, L. 2003, ApJL, 596, L135
- Dalgarno & Lepp (1987) Dalgarno, A., & Lepp, S. 1987, in IAU Symp. 120: Astrochemistry, edited by M. S. Vardya, & S. P. Tarafdar, 109
- de Jong (1972) de Jong, T. 1972, A&A, 20, 263
- Dove & Mandy (1986) Dove, J. E., & Mandy, M. E. 1986, ApJL, 311, L93
- Draine & Bertoldi (1996) Draine, B. T., & Bertoldi, F. 1996, ApJ, 468, 269
- Duley & Williams (1984) Duley, W. W., & Williams, D. A. 1984, Inorganic Chemistry
- Dunn (1968) Dunn, G. H. 1968, Phys. Rev., 172, 1
- Franco et al. (1990) Franco, J., Tenorio-Tagle, G., & Bodenheimer, P. 1990, ApJ, 349, 126
- Fuller & Couchman (2000) Fuller, T. M., & Couchman, H. M. P. 2000, ApJ, 544, 6
- Galli & Palla (1998) Galli, D., & Palla, F. 1998, A&A, 335, 403
- Glover & Brand (2001) Glover, S. C. O., & Brand, P. W. J. L. 2001, MNRAS, 321, 385
- Gnedin & Hui (1998) Gnedin, N. Y., & Hui, L. 1998, MNRAS, 296, 44
- Haiman et al. (2000) Haiman, Z., Abel, T., & Rees, M. J. 2000, ApJ, 534, 11
- Haiman et al. (1996a) Haiman, Z., Rees, M. J., & Loeb, A. 1996a, ApJ, 467, 522
- Haiman et al. (1996b) Haiman, Z., Thoul, A. A., & Loeb, A. 1996b, ApJ, 464, 523
- Iliev et al. (2006) Iliev, I. T., Mellema, G., Shapiro, P. R., & Pen, U.-L. 2006, astro-ph/0607517
- Iliev & Shapiro (2001) Iliev, I. T., & Shapiro, P. R. 2001, MNRAS, 325, 468
- Iliev et al. (2005) Iliev, I. T., Shapiro, P. R., & Raga, A. C. 2005, MNRAS, 361, 405
- Izotov & Kolesnik (1984) Izotov, Y. I., & Kolesnik, I. G. 1984, Soviet Astron., 28, 15
- Janev et al. (1987) Janev, R. K., Langer, W. D., & Evans, K. 1987, Elementary processes in Hydrogen-Helium plasmas - Cross sections and reaction rate coefficients (Springer Series on Atoms and Plasmas, Berlin: Springer, 1987)
- Johnson & Bromm (2006) Johnson, J. L., & Bromm, V. 2006, MNRAS, 366, 247
- Kang & Shapiro (1992) Kang, H., & Shapiro, P. R. 1992, ApJ, 386, 432
- Karpas et al. (1979) Karpas, Z., Anicich, V., & Huntress, W. T., Jr. 1979, J. Chem. Phys. , 70, 2877
- Kitayama et al. (2001) Kitayama, T., Susa, H., Umemura, M., & Ikeuchi, S. 2001, MNRAS, 326, 1353
- Kitayama et al. (2004) Kitayama, T., Yoshida, N., Susa, H., & Umemura, M. 2004, ApJ, 613, 631
- Lasker (1966) Lasker, B. M. 1966, ApJ, 143, 700
- Lepp & Shull (1984) Lepp, S., & Shull, J. M. 1984, ApJ, 280, 465
- Machacek et al. (2001) Machacek, M. E., Bryan, G. L., & Abel, T. 2001, ApJ, 548, 509
- Machacek et al. (2003) — 2003, MNRAS, 338, 273
- MacIntyre et al. (2006) MacIntyre, M. A., Santoro, F., & Thomas, P. A. 2006, MNRAS, 368, 1301
- Mesinger et al. (2006) Mesinger, A., Bryan, G., & Haiman, Z. 2006, astro-ph/0604148
- Mitchell & Deveau (1983) Mitchell, G. F., & Deveau, T. J. 1983, ApJ, 266, 646
- Nagakura & Omukai (2005) Nagakura, T., & Omukai, K. 2005, MNRAS, 364, 1378
- Navarro et al. (1997) Navarro, J. F., Frenk, C. S., & White, S. D. M. 1997, ApJ, 490, 493
- Oh & Haiman (2003) Oh, S. P., & Haiman, Z. 2003, MNRAS, 346, 456
- Omukai (2001) Omukai, K. 2001, ApJ, 546, 635
- Omukai & Nishi (1999) Omukai, K., & Nishi, R. 1999, ApJ, 518, 64
- Oneil & Reinhardt (1978) Oneil, S. V., & Reinhardt, W. P. 1978, J. Chem. Phys. , 69, 2126
- O’Shea et al. (2005) O’Shea, B. W., Abel, T., Whalen, D., & Norman, M. L. 2005, ApJL, 628, L5
- O’Shea & Norman (2006) O’Shea, B. W., & Norman, M. L. 2006, astro-ph/0607013
- Osterbrock (1989) Osterbrock, D. E. 1989, Astrophysics of gaseous nebulae and active galactic nuclei (University Science Books, 1989, 422 p.)
- Peebles & Dicke (1968) Peebles, P. J. E., & Dicke, R. H. 1968, ApJ, 154, 891
- Poulaert et al. (1978) Poulaert, G., Brouillard, F., Claeys, W., McGowan, J. W., & Van Wassenhove, G. 1978, J. Phys. B: At. Mol. Phys., 11, L671
- Ramaker & Peek (1976) Ramaker, D. E., & Peek, J. M. 1976, Phys. Rev. A , 13, 58
- Razoumov & Scott (1999) Razoumov, A. O., & Scott, D. 1999, MNRAS, 309, 287
- Ricotti et al. (2001) Ricotti, M., Gnedin, N. Y., & Shull, J. M. 2001, ApJ, 560, 580
- Ricotti et al. (2002a) — 2002a, ApJ, 575, 33
- Ricotti et al. (2002b) — 2002b, ApJ, 575, 49
- Saslaw & Zipoy (1967) Saslaw, W. C., & Zipoy, D. 1967, Nat, 216, 976
- Savin et al. (2004) Savin, D. W., Krstić, P. S., Haiman, Z., & Stancil, P. C. 2004, ApJL, 606, L167
- Schaerer (2002) Schaerer, D. 2002, A&A, 382, 28
- Schneider et al. (1994) Schneider, I. F., Dulieu, O., Giusti-Suzor, A., & Roueff, E. 1994, ApJ, 424, 983
- Sedov (1959) Sedov, L. I. 1959, Similarity and Dimensional Methods in Mechanics (Academic Press, 1959)
- Shapiro et al. (1994) Shapiro, P. R., Giroux, M. L., & Babul, A. 1994, ApJ, 427, 25
- Shapiro et al. (1999) Shapiro, P. R., Iliev, I. T., & Raga, A. C. 1999, MNRAS, 307, 203
- Shapiro et al. (2004) — 2004, MNRAS, 348, 753
- Shapiro & Kang (1987) Shapiro, P. R., & Kang, H. 1987, ApJ, 318, 32
- Spergel et al. (2006) Spergel, D. N. et al., astro-ph/0603449
- Spergel et al. (2003) Spergel, D. N. et al., ApJS, 148, 175
- Spitzer (1978) Spitzer, L. 1978, Physical processes in the interstellar medium (New York Wiley-Interscience, 1978. 333 p.)
- Susa & Umemura (2006) Susa, H., & Umemura, M. 2006, ApJL, 645, L93
- Tegmark et al. (1997) Tegmark, M., Silk, J., Rees, M. J., Blanchard, A., Abel, T., & Palla, F. 1997, ApJ, 474, 1
- Thoul & Weinberg (1995) Thoul, A. A., & Weinberg, D. H. 1995, ApJ, 442, 480
- Von Neumann & Richtmyer (1950) Von Neumann, J., & Richtmyer, R. 1950, J. Appl. Phys. , 21, 232
- Wechsler et al. (2002) Wechsler, R. H., Bullock, J. S., Primack, J. R., Kravtsov, A. V., & Dekel, A. 2002, ApJ, 568, 52
- Yoshida et al. (2003) Yoshida, N., Abel, T., Hernquist, L., & Sugiyama, N. 2003, ApJ, 592, 645
- Yoshida et al. (2006) Yoshida, N., Omukai, K., Hernquist, L., & Abel, T. 2006, astro-ph/0606106