Average hard X-ray emission from NS LMXBs: Observational evidence of different spectral states in NS LMXBs††thanks: Based on observations with INTEGRAL, an ESA project with instruments and science data centre funded by ESA member states (especially the PI countries: Denmark, France, Germany, Italy, Spain, and Switzerland), Czech Republic and Poland, and with the participation of Russia and the USA.
Abstract
Aims. We studied and compared the long-term average hard X-ray (20 keV) spectra of a sample of twelve bright low-mass X-ray binaries hosting a neutron star (NS). Our sample comprises the six well studied Galactic Z sources and six Atoll sources, four of which are bright (”GX”) bulge sources while two are weaker ones in the 2–10 keV range (H 1750–440 and H 1608–55).
Methods. For all the sources of our sample, we analysed available public data and extracted average spectra from the IBIS/ISGRI detector on board INTEGRAL.
Results. We can describe all the spectral states in terms of the bulk motion Comptonisation scenario. We find evidence that bulk motion is always present, its strength is related to the accretion rate and it is suppressed only in the presence of high local luminosity. The two low-dim Atoll source spectra are dominated by photons up-scattered presumably due to dynamical and thermal Comptonisation in an optically thin, hot plasma. For the first time, we extend the detection of H 1750–440 up to 150 keV. The Z and bright ”GX” Atoll source spectra are very similar and are dominated by Comptonised blackbody radiation of seed photons, presumably coming from the accretion disc and NS surface, in an optically thick cloud with plasma temperature in the range of 2.5–3 keV. Six sources show a hard tail in their average spectrum: Cyg X-2 (Z), GX 3400 (Z), GX 172 (Z), GX 5–1 (Z), Sco X–1 (Z) and GX 131 (Atoll). This is the first detection of a hard tail in the X-ray spectrum of the peculiar GX 131. Using radio data from the literature we find, in all Z sources and bright ”GX” Atolls, a systematic positive correlation between the X-ray hard tail (40–100 keV) and the radio luminosity. This suggests that hard tails and energetic electrons causing the radio emission may have the same origin, most likely the Compton cloud located inside the NS magnetosphere.
Key Words.:
X-rays: binaries – binaries: close – stars: neutron1 Introduction
Low-Mass X-ray Binaries (LMXBs) are systems where a compact object, either a neutron star (NS) or a black hole candidate (BHC), accretes matter via Roche lobe overflow from a companion with a mass . NS LMXBs can be broadly classified according to their timing and spectral properties (Hasinger & van der Klis 1989). On the basis of this classification, NS LMXBs are divided in Z sources and Atoll sources from the shape of their track in the colour-colour diagram and from the different timing behaviour that correlates with the position on the tracks.
The overall spectra of Z sources are very soft (Barret & Olive 2002, and references therein) and can be described by the sum of a cool (1 keV) blackbody (BB) and a Comptonised emission from an electron plasma (”corona”) of a few keV. Instead, Atoll sources perform quite dramatic spectral changes: when bright, they can have soft spectra (similar to Z sources) but they switch to low/hard spectra at low luminosities. Titarchuk & Shaposhnikov (2005), hereafter TS05, implemented a thorough analysis of spectral and temporal properties of the Atoll source 4U 1728–34. They show that the low/hard spectra at low luminosities can be described by the sum of up-scattered spectra related to the Comptonisation of the disc and NS surface soft photons. They found that the Compton cloud electron temperature is of the order of a few tens of keV. These spectra are very similar to the hard-state spectra of BHCs but they are softer (BHC photon index vs NS ) as expected from the theory (see, for example, Titarchuk & Fiorito 2004). TS05 found that the high luminosity state spectrum of 4U 1728–34 consists of the sum of two pure blackbody-like spectra with colour temperatures of about 1 keV and 2.2 keV. The softer BB component is presumably related to disc emission as the harder one is related to the NS emission. It is worth noting that TS05 also found that when the source undergoes hard-soft transition, all power spectrum (PDS) frequencies (QPO and break frequencies) increase with the photon index, with no sign of saturation. Note that the index-QPO correlation observed in BHC shows the index saturation at high values of QPO frequency (see Shaposhnikov & Titarchuk 2006).
So far, only Atoll sources (and more generally X-ray bursters) have been observed with low/hard spectra (i.e. Comptonising corona of few tens of keV). Z sources always have soft Comptonisation spectra (Comptonising corona of few keV) and can have an additional hard X-ray component dominating the spectrum above 30 keV. This component is on top of the soft spectrum and is highly variable with most of the emission remaining soft (see Barret 2001; Di Salvo & Stella 2002, for a review on NS LMXB spectra). Hence, we would expect that the average high energy spectra of Atoll sources have a strong component above 30 keV and that in the soft Z sources this component is less prominent and smeared out in the time averaged spectrum. Z sources spend most of their time in the high/soft state, but they may show the transition to harder states at lower luminosity. The sensitivity of the past missions may have introduced an observational bias, similarly to the lack of a continuous coverage of the Galactic plane and Centre in the less explored hard X-ray range (above 20 keV). Moreover, the concentration of these sources towards the Galactic centre makes it difficult to observe them with non-imaging instruments. Consequently, data analysis and interpretation of such observations is extremely problematic.
All these instrumental biases can be minimised with the use of the recently launched INTErnational Gamma-Ray Astrophysics Laboratory, INTEGRAL (Winkler et al. 2003). The imager INTEGRAL/IBIS (Ubertini et al. 2003) has high sensitivity, about 10 times better than GRANAT/SIGMA, coupled to imaging capability with 12′ angular resolution above 20 keV.
In this paper we report the study of the average hard X-ray spectra of twelve NS LMXBs performed with the low energy (20–200 keV) IBIS detector, ISGRI (Lebrun et al. 2003), using a coherent and large sample of data, free from systematic effects which play a role when combining data from different missions. The sample of the LMXBs chosen is given in Table 1 and comprises six Galactic Z sources and six Atoll sources, four of which are bright (”GX”) bulge sources while two are weaker ones in the 2-10 keV range.
Our approach is two-fold: on one side, for comparison purposes, we study the average spectra in terms of phenomenological models as done in the literature, on the other, we study the sources in the frame of a physical model in the attempt to find a self-consistent scenario that describes all the spectral properties we observe. We discuss the similarities of such a scenario with the black hole LMXB case as well as the radio - X-ray correlation that is typical of LMXBs.
| Source | D | Rate | SNR | MaxEn | Texp |
|---|---|---|---|---|---|
| (kpc) | (cps) | (keV) | (ksec) | ||
| Z sources | |||||
| Sco X–1 | 2.8 | 58.3 | 1757 | 150 | 266 |
| GX 3400 | 11 | 2.4 | 124 | 46 | 433 |
| GX 3492 | 5 | 3.4 | 189 | 39 | 265 |
| GX 5–1 | 9.2 | 3.8 | 330 | 80 | 1091 |
| GX 172 | 14 | 4.4 | 203 | 80 | 248 |
| Cyg X–2 | 13.3 | 2.2 | 57 | 55 | 149 |
| Atoll sources | |||||
| H 1608–522 | 4** | 0.8 | 36 | 150 | 299 |
| H 1705–440 | 11** | 3 | 144 | 150 | 307 |
| GX 99 | 5* | 0.97 | 55 | 35 | 139 |
| GX 31 | 5.6* | 0.96 | 86 | 43 | 2027 |
| GX 91 | 7* | 1.2 | 91 | 37 | 491 |
| GX 131 | 7 | 0.96 | 57 | 80 | 290 |
2 Observations and data analysis
We have analysed INTEGRAL data publically available in which the sources in
Table 1 were in the Fully Coded Field of View (FCFOV) of IBIS.
The additional criterion of a minimum of good time of 1000 sec for IBIS/ISGRI
led to a total of 2263 pointings each with variable exposure time
(from about 1800 sec up to about 3600 sec) spanning from January 2003 to May 2004.
Version 5.1 of the Off-line Scientific Analysis (OSA) software
has been used to analyse the data. The description of the algorithms used in the
IBIS/ISGRI scientific analysis can be found in Goldwurm et al. (2003).
For each pointing we extracted images in the 22–40 and 40–80 keV energy bands.
The images were used to build
light-curves as well as a final mosaic. The mosaic
images revealed the sources that
were active in the field of view at the time of the observations. The list of all the detected
sources (one per source of interest) was then used in the spectral step, where
spectra for all the active sources in the field of view were simultaneously
extracted with the standard spectral extraction method.
The single pointing spectra were then averaged into one final spectrum per source.
These final average spectra have been used in our spectral
study adding 1% systematic error (with the exception of the bright Sco X–1 for which we
added 1.5% systematic error). In the fit, only data points with more than 3
in the 22–200 keV range have been considered.
To cross-check our results, we also used the alternative method of extracting spectra
from the mosaics. To do so, we re-ran the imaging step in twelve different bins
(instead of the 22–40 and 40–80 keV previously mentioned) for all the
pointings and then extracted a spectrum using the
flux from each energy map. We verified that the two different methods
give compatible results. In this work we show only
the results of the former method (the standard extraction) for which we have a finer binning.


3 Results
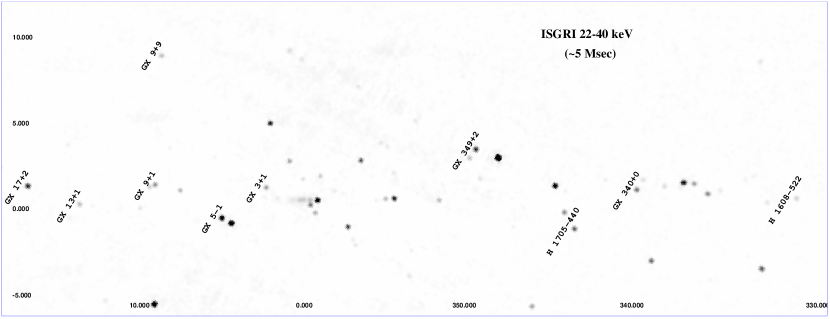
Figure 1 shows the final sky map of the pointings around the Galactic bulge in the 22–40 keV band. The sources studied in this paper are labeled, with the exception of Cyg X–2 and Sco X–1 that lie outside the image. The 22–40 keV average count rate and detection significance of each source, taken from the mosaic image shown in Fig. 1, are reported in Table 1. The count rate is in counts/sec and multiplied by 10 gives an estimate in mCrab111The average Crab count rate in different positions of the FCFOV in the same band is about 93 counts/sec..
Figures 2 and 3 show the IBIS/ISGRI (22–40 keV and 40–80 keV) light-curves as obtained from the imaging analysis (re-binned to ten day data bins). The simultaneous quick-look results provided by the RXTE/ASM team are also shown (one day data bins). One Crab is approximately 75 counts/sec in the RXTE/ASM 2–12 keV energy band, 93 counts/sec and 61 counts/sec in the IBIS/ISGRI 22–40 and 40–80 keV band, respectively.
3.1 A phenomenological approach
As a first attempt we tried to fit all the spectra with the same simple model, in order to compare them directly. It soon turned out that this was not possible since the long-term average spectra identified three main spectral states. Phenomenologically, we can classify them in terms of a widely used thermal Comptonisation model, comptt by Titarchuk (1994). We found that the spectra of GX 3492, GX 91, GX 99, and GX 31 are well described by a single comptt component while we need two components, comptt+pl (thermal Comptonisation plus power-law), to describe the data for Sco X–1, GX 5–1, GX 3400, GX 172, Cyg X–2 and GX 131. On the other hand, the spectral shapes of H 1608–522 and H 1705–440 can be well fitted by a simple power-law, pl.
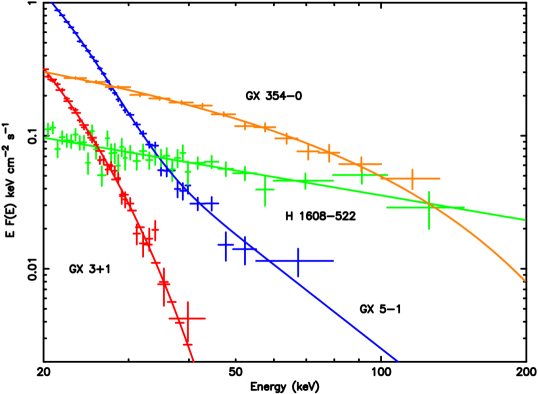
By comparison with black hole LMXBs, hereafter we call the spectral states fitted with a single comptt a very soft state for which the spectral shape is well described by the blackbody-like shape slightly modified by Comptonisation. Using this analogy, we call our comptt+pl-state an intermediate state. In fact, the intermediate state in the BHCs is characterized by the blackbody-like component at low energies and the steep power-law component at higher energies. In the low/hard state spectra of BHCs, the blackbody signature is smeared out but the power-law is prominent. Keeping in mind this observational fact for the BHCs, we can call our pl state a low/hard state. The three states are shown in Fig. 4. In the plot we have also included the spectrum of the Atoll source GX 354–0 (Falanga et al. 2006) to point out that the low/hard state of our classification, associated to H 1608–522 in the plot, is not a ”pure” low/hard state as in the case of GX 354–0 (thermal Comptonisation with cut-off) but is a low/hard state where an additional physical mechanism producing a non-attenuated power-law starts to be important (see Sect. 4.1). Nevertheless, for simplicity hereafter we will refer to the spectra of H 1608-522 and H 1705–440 as to low/hard states. Table 2 summarises the spectral models used to fit the data while the corresponding plots with the spectra and best fit models are shown in Figs. 5 and 6.
| Source | Model | kTseed | kTe | /dof | Flux | Flux | ||
| (keV) | (keV) | ( erg s-1 cm-2) | ( erg s-1 cm-2) | |||||
| Sco X1 | comptt+pl | [1.3] | 42/34 | 5.810-9 | 2.210-10 | |||
| GX 3400 | comptt+pl | [2.5] | [0.93] | [3.0] | 7.73 | 24/26 | 2.410-10 | |
| GX 3492 | comptt | - | [1.3] | 22/24 | 3.510-10 | |||
| GX 5–1 | comptt+pl | [1.0] | 35/29 | 3.510-10 | ||||
| GX 172 | comptt+pl | [2.7] | [0.6] | 0.04 | [11] | 35/31 | 4.510-10 | |
| Cyg X–2 | comptt+pl | [1.96] | [1.09] | 10.68 | 29/27 | 2.110-10 | ||
| H 1608–522 | pl | 2.62 0.11 | - | - | - | 45/36 | 8.710-11 | 9.110-11 |
| compps | - | 2.29 | 40/34 | |||||
| H 1705–440 | pl | 3.15 0.04 | - | - | - | 36/37 | 310-10 | 1.910-10 |
| compps | - | 47 7 | 31/35 | |||||
| GX 99 | comptt | - | [1.3] | 6(0.4) | 27/23 | 9.210-11 | ||
| GX 31 | comptt | - | [1.3] | 46/24 | 9.310-11 | |||
| GX 91 | comptt | - | [1.3] | 26 ( 7) | 32/22 | 1.310-10 | ||
| GX 131 | comptt+pl | [2.8] | [1.0] | [8] | 23/22 | 8.210-11 |
| Source | kTbb | /dof | Flux | Flux | ||
|---|---|---|---|---|---|---|
| (keV) | ( erg s-1 cm-2) | ( erg s-1 cm-2) | ||||
| Sco X–1 | 2.56 | 3.27 | -1.47 | 68/35 | 5.810-9 | 2.210-10 |
| GX 3400 | 2.43 | 6 | -1.12 | 24/25 | 2.4510-10 | |
| GX 3492 | 2.47 | 6 | -1.62 | 20/23 | 3.510-10 | |
| GX 5–1 | 2.35 | 3.84 | -1.06 | 34/30 | 3.7510-10 | |
| GX 172 | 2.68 | 2.0 | -1.87 | 32/30 | 4.510-10 | |
| Cyg X–2 | 2.78 | 1.8 | -0.56 | 26/26 | 2.110-10 | |
| H 1608–522 | 1.49 | 1.50 | -1.24 | 39/34 | 8.510-11 | 9.610-11 |
| H 1705–440 | 0.84 | 2.15 | -2.13 | 36/35 | 2.910-10 | 1.910-10 |
| GX 99 | 2.53 | 6 | -0.70 | 24/22 | 9.410-11 | |
| GX 31 | 2.30 | 6 | -1.27 | 42/23 | 9.310-11 | |
| GX 91 | 2.20 | 3.2 | -1.09 | 24/21 | 1.3210-10 | |
| GX 131 | 2.32 | 2.02 | -1.34 | 23/23 | 8.210-11 |
3.1.1 The very soft spectral state
Three bright Atoll sources (GX 31, GX 91 and GX 99) and the Z source GX 3492 can be well described by a simple comptt component. A hard tail has been observed to dominate the spectra above 30 keV in a pointed observation of GX 3492 (Di Salvo et al. 2001), but it is likely not frequent/bright enough to be detected in a 265 ksec average spectrum. Indeed, no hard tail was detected in the spectrum of GX 3492 by Iaria et al. (2004) using BeppoSAX data even though the source was in the same position in the Z-track where the tail was first discovered. No hard tails have ever been detected in the spectra of GX 99, GX 91 and GX 31.
Only recent results have appeared as far as the X-ray spectrum of GX 99 is concerned. Kong et al. (2006), based on RXTE data, report a spectrum that can be described by the typical two component model used for bright LMXBs hosting a neutron star: a softer component (e.g. blackbody) plus a Comptonised harder one (e.g. comptt). We are not sensitive to the soft blackbody component with IBIS/ISGRI and our results as far as the comptt part are concerned are in agreement with what was found by Kong et al. (2006) i.e. a Comptonising plasma kTe of about 4 keV with a high optical depth about 7. Our RXTE-INTEGRAL simultaneous observations (Vilhu et al. 2006) show that the broad band spectrum of GX 99 can be also well described by the sum of a soft component (diskbb in XSPEC terminology) and thermal Comptonisation (compbb) by a hot optically thin electron plasma.
The fit we obtain for GX 31 is not good (/dof=46/24); however, as can be seen in Fig. 6, this is not due to a clear excess or systematics, more likely it is due to source spectral variability. Our average spectrum parameters show that also GX 31 has a Z-like spectrum, similarly to what found by Oosterbroek et al. (2001) using BeppoSAX data (optical depth about 6 and Comptonising plasma temperature kTe about 2.7 keV).
Iaria et al. (2005) presented the 0.12-18 keV spectrum of GX 91 from a long BeppoSAX observation. The 0.12-18 keV spectrum could be well fitted by a blackbody model plus Comptonised component, the latter with an electron temperature kTe of 2.3 keV and optical depth of about 15. No firm conclusion could be drawn above 20 keV due to source confusion issues. The INTEGRAL observation above 20 keV does not suffer from source confusion and shows that the spectrum of GX 91 is very similar to the bright Atoll sources GX 99 and GX 31, i.e. very similar to the typical Z source spectrum. There is a hint of excess in the spectrum of GX 91, Fig. 6, but it is not significant with the current exposure time.
3.1.2 The intermediate spectral state
A simple comptt model was not good enough to describe the data due to a systematic excess above 30 keV for Sco X–1 (/dof60), Cyg X–2 (45/27), GX 172 (61/31), GX 5–1 (96/31), and GX 131 (38/24). With the addition of a power-law, the fits improved significantly (see Table 2) with the temperature of the Comptonising plasma, kTe, stabilising itself around 2.5–3 keV. Within this sample, transient hard tails had already been observed in the spectra of Sco X–1 (D’Amico et al. 2001) based on RXTE data, GX 5–1 (Paizis et al. 2005) based on INTEGRAL data, GX 172 (Farinelli et al. 2005) and Cyg X–2 (Di Salvo et al. 2002) based on BeppoSAX data. In our study, the seed photon temperature could not be constrained and was fixed to the value [1.0-1.3] keV for all the sources, with the exception of GX 3400 for which it was fixed at 0.93 keV (Lavagetto et al. 2004), and GX 172 fixed at 0.6 keV (Farinelli et al. 2005).
The spectrum of GX 3400 could be fitted with a simple comptt model (/dof = 32/29) with kTseed fixed at 0.93 keV as found by Lavagetto et al. (2004), providing kTe= keV and =. We note however, that if we freeze kTe to 3 keV, as found in the BeppoSAX broad-band fit (0.1-100 keV) by Lavagetto et al. (2004), around 40 keV the residuals systematically deviate from comptt and the fit is no longer acceptable (/dof=58/27). In this case the addition of a power-law ( frozen at 2.5, as found in BeppoSAX data) is required.
The Comptonising plasma parameters obtained in the fit of the spectrum of Sco X–1 show values typical of Z sources (kTe of a few keV and optical depth between 5-15). The excess left by this model is well fitted by a power-law with no measured cut-off up to 150 keV. Such an extended power-law can be an indication for bulk motion (dynamical) Comptonisation or non-thermal electron population given the bad fit obtained with different thermal Comptonisation models. See Di Salvo et al. (2006) for a study of the spectral variability of Sco X–1 with INTEGRAL.
Farinelli et al. (2005) used the same model used here (comptt plus power-law) to describe the spectrum of GX 172, so a more quantitative comparison is possible. We fixed the power-law slope (), optical depth () and seed photon temperature () to what was found by Farinelli et al. (2005) and find a similar electron gas temperature but a lower power-law normalization at 1 keV (our 0.23 versus their 2.1). This is compatible with a picture of a fairly constant soft component and transient hard tail component that is at maximum when observed in a pointed observation (Farinelli et al. 2005) and at a lower value when averaged on long-term observations (due to its transient nature).
Similarly, for Cyg X–2 the power-law slope could not be constrained and we used the average value found by Di Salvo et al. (2002) who also used the comptt plus power-law model. The hard tail was the strongest in the horizontal branch and we used the photon index average value from the upper and lower horizontal branch (2). The same was done for the seed photon temperature (1 keV) and optical depth (11). Similarly to GX 172, we obtain an electron gas temperature close to what found by Di Salvo et al. (2002) and a power-law normalization of 0.02 (to be compared to their 0.03). The difference in the power-law normalization is much less than for the case of GX 172. This could be due to the fact that Cyg X–2 spends more time than GX 172 on the horizontal branch and so the average spectrum of Cyg X–2 is closer to the horizontal branch spectrum than in the case of GX 172.
The hard X-ray spectrum of GX 5–1 has always been difficult to study due to the presence of the nearby black hole candidate GRS 1758–258 (40′ apart). Asai et al. (1994) first detected a possible hard tail in the spectrum of GX 5–1 although contamination from the nearby black hole could not be excluded. The first non-contaminated observation of a systematic hardening of the source spectrum in the horizontal branch was done by Paizis et al. (2005) with INTEGRAL data and the presence of the hard tail is confirmed here, based on a larger data set.
The addition of the power-law component in the spectrum of GX 131 required some parameters to be frozen. We fixed the seed photon temperature and optical depth to the values found by Homan et al. (2004) (1 and 8 keV, respectively). The photon index was found to be steady around 2.8 (even with a cut-off pl plus pl model and bremsstrahlung plus pl). Fixing the slope to 2.8, we obtained the Comptonising plasma temperature of about 2.75 keV given in Table 2. The nature of GX 131 has always been a matter of debate: Hasinger & van der Klis (1989) classified it as a bright Atoll source (hence our classification), although they noted that it showed properties which were closest to those seen in the Z sources; Schulz et al. (1989) grouped it with the high luminosity sources that included the six sources that were later classified as Z sources; Homan et al. (1998) discovered quasi periodic oscillations (QPOs) similar to the horizontal branch oscillations found in Z sources; based on simultaneous radio and X-ray observations, Homan et al. (2004) showed that the X-ray and radio luminosities of GX 131 are actually in the range expected for Z sources unlike the Atoll sources GX 91, GX 99 and GX 31 that have similar X-ray luminosities but much lower radio ones. Our work shows that indeed GX 131 behaves like a Z source not only due to its variability and radio properties but also from the spectral point of view with an average spectrum very similar to Z sources, i.e. thermal Comptonisation plus hard tail.


3.1.3 The low/hard spectral state
The two remaining Atoll sources, H 1608–522 and H 1705–44, are the only ones of our sample that can be well described by a single power-law. The burster H 1608–52 has been detected beyond 100 keV also in the past (Zhang et al. 1996, with BATSE observations) when it was in a very bright state (about 100 mCrab, 20–100 keV) with a spectral break or cut-off around 65 keV.
H 1705–44 has been observed to show dramatic spectral changes in its X-ray spectrum (Barret & Olive 2002). The 2–80 keV could be well fitted by a blackbody plus Comptonisation model (comptt) with a temperature of about 15 keV i.e. the spectrum was not detected above 100 keV. In this study we detect the source up to about 150 keV, that, to the best of our knowledge, is a new result. The high sensitivity of IBIS/ISGRI combined with the long observation time (307 ksecs) are essential ingredients for this new detection, similarly to what happened e.g. in the case of Aql X–1 (Rodriguez et al. 2006) and 4U 1850-087 (Sidoli et al. 2006).
To have a feeling of the plasma temperature in H 1608-522 and H 1705-440, we fitted their spectra with the Comptonisation model by Poutanen & Svensson (1996) (compps in XSPEC terminology) obtaining Comptonisation of soft seed photons (2 keV) by an optically thin (1) hot plasma. We assumed a spherical geometry and a blackbody seed photon spectrum (Table 2).
3.2 Generic Comptonisation Model
As we have mentioned above, in our analysis of X-ray spectra from NS LMXBs we found similarities with black hole LMXBs. The BHC and NS spectral shapes are generic: they consist of blackbody-like (BB) and power-law components. Sometimes one needs an exponential rollover in order to terminate the power-law component at high energies. The main difference is that NS spectra are usually softer for the same state. Another difference in these spectra is that in the NS case there are two BB components (not one as in BHC spectra) which can be related to the emission from the disc (BB colour temperature about 1 keV) and NS surface (BB colour temperature about 2.5 keV), (TS05).
Titarchuk et al. (1996, 1997), hereafter TMK96 and TMK97, introduced the Generic Comptonisation model (BMC model in XSPEC) that takes into account the dynamical Comptonisation (converging inflow, expected in the vicinity of the central object) along with thermal Comptonisation. It is worth noting that this model can be applied to fit the observed spectra of NS and BHC sources. The BMC model reads as:
| (1) |
where is the Green’s function obtained as a solution of radiative diffusion equation in which both effects of thermal and dynamical Comptonisation are included. stands for the injected blackbody-like spectrum, namely , is a convolution of with the (Comptonisation) Green’s function , is the BB normalization coefficient (that depends on the compact object mass and distance to the source). The factor is the fraction of the seed photon radiation directly seen by the Earth observer, whereas the factor is the fraction of the seed photon radiation up-scattered by the Compton cloud.
is the response of the Compton medium (cloud) to the injection of monochromatic line with energy . TMK97 showed that is a broken power-law with blue wing index and red wing index always more than . Note that approaches Delta-function for . High values of are an indication of low efficiency of Comptonisation that usually occurs when the plasma of the Compton cloud is very close to equilibrium with the seed photon environment. The electron temperature of the Compton cloud differs by a factor of a few from the BB seed photon temperature. We also have to note that a single BB spectrum can be reproduced either with (small coverage of the seed photon radiation by the Compton cloud) or with (large coverage) and (inefficient Comptonisation). The free parameters of the BMC model (apart from the normalization ) are the BB colour temperature, , the spectral index (photon index ) and .
We can describe all the spectra studied in this paper in terms of bulk motion Comptonisation. The results of the fits of our INTEGRAL spectra with the BMC model are reported in Table 3. For GX 3400, GX 3492, GX 99 and GX 31 only is well constrained. This is not surprising given that in their spectra only the thermal bump is unambiguously detected. The best-fit colour temperatures are about keV using comptt or BB models. GX 172 and GX 131 have similar best-fit -values, even if not well constrained, whereas the slope of GX 5-1 is steeper but much better constrained than in GX 172 and GX 131. The upper value of reported for Cyg X–2 ( ) could be indicative of the presence of photon up-scattering (Comptonisation) of BB photons originated in the disc and NS surface. One can arrive to similar conclusions for GX 91 even if the effect seems to be less prominent there ( ). For the two dim Atoll sources H 1608–522 and H 1705–440 we find that is well constrained while there is no real information on . This is not surprising given that in their spectra we do not see evidence of the thermal bump (described by the BB in the BMC model) and so it is impossible to infer either the BB colour-temperature or its relative contribution to the merging flux. In Sco X-1, the whole set of the best-fit parameters is well constrained, given that both thermal bump and the hard tail are detected with high statistical significance.
Since our analysis uses data starting from 20 keV, careful interpretation should be given to the origin of the BB seed photons found in Table 3 (kTbb keV). A broad band analysis of GX 172 and Cyg X–2 spectra (Farinelli, private communication) seems to suggest that, similarly to the BHC case, the seed photons for the BMC model are rather soft, with a temperature close to disk emission values, 0.4-0.6 keV (Barret et al. 2000). A second Comptonisation component, comptt, is also needed with 2.5 keV seed photons coming most likely from the NS surface. In our spectra the disk component is too soft to be detected and the BMC model interpretes the 2.5 keV seed photons as due to the emission from non-efficiently up-scattered seed photons within the bulk flow. The energy sampling of our data does not allow us to produce a complete discussion about the full geometry of the sources and global BMC model parameters, beyond the scope of this article, and this caveat should be kept in mind in all we discussed above that remains, in any case, qualitatively valid.
4 Discussion
We have analysed IBIS/ISGRI available public data on a sample of twelve persistent LMXBs containing a neutron star. We focused our study on the average spectral behaviour of the sources and classified them in terms of spectral states. As shown by the light-curves we presented, the sources have some degree of variability, but the average spectrum is a representation of the sources above 20 keV and enables the study of the global properties.
4.1 A scenario for spectral evolution in NS LMXBs
We observe three main spectral states: a very soft state with source spectra that can be well described by a single thermal Comptonisation component, an intermediate state (thermal Comptonisation plus power-law) and a low/hard state (single power-law). We have successfully studied these three spectral states in the frame of the Generic Comptonisation Model (BMC, TMK96). We present our scenario of the spectral evolution of NS LMXBs starting from the low/hard state.
The low/hard state is characterized by a low mass accretion rate in the disc. In this case the gravitational energy release in the disc is much smaller than the one in the optically thin outer boundary of the corona (Compton cloud). The coronal outer boundary is presumably related to the adjustment shock (Titarchuk & Fiorito 2004). The corona completely covers the seed photon area (high ) and the emergent spectrum is a result of the up-scattering (Comptonisation) of the seed photons in the corona. At the very low level of accretion rate, the bulk motion is extremely weak and the emergent spectrum can be interpreted as pure thermal Comptonisation with no bulk signature (GX 3540 in Fig. 4). The bulk motion effect increases with accretion rate and the power-law signature starts to be visible in the spectrum, the cut-off is moved at a higher energy than what expected from pure thermal Comptonisation (H 1608-522 in Fig. 4). In either case, one cannot see any trace of the seed photons in ISGRI (that give the BB bump). Open magnetic field lines are exposed to the observer but the outflow is weak because of the low mass accretion rate (there is not enough radiation in the disc to launch the wind) and the system is radio-quiet.
In the intermediate state the mass accretion rate increases with respect to the low/hard state. It leads to high efficiency of the Comptonisation, particularly bulk inflow Comptonisation that is seen as an extended hard tail in the spectrum. Thermal Comptonisation becomes less efficient because the coronal plasma is cooled down by the seed photons coming from the disc and NS surface. The corona consists of a quasi-spherical component (related to the closed field lines and bulk motion inflow) and of a cylindrical component (related to the open field lines and outflow, TS05). The vertical size of the cylindrical configuration is suppressed as the mass accretion increases. We start to see the seed blackbody bumps (only the higher energy one in the IBIS/ISGRI range), because the corona is cooled down and becomes more compact.
The very soft state is characterized by a high mass accretion rate that is very close to the critical (Eddington) values. The emergent spectrum is a sum of two blackbody-like spectra, one is related to the Comptonisation of the NS photons (visible in the IBIS/ISGRI range) and the other one is related to the Comptonisation of the disc photons. The seed photon and plasma temperatures differ by a factor of a few. The electron plasma and the photons in the Compton cloud are very close to equilibrium. In this state the corona is quasi-spherical, there is no bulk motion and no radio emission. In fact, the radiation pressure caused by the strong emission from the NS surface stops the bulk inflow and the high accretion rate changes the configuration of the field lines and the radio emission is quenched.
It is important to note that what plays the key role to suppress the bulk motion is the local radiation pressure, hence the local accretion rate impinging the bulk inflow: Sco X-1 has a total isotropically-estimated luminosity that is higher than e.g. GX 31, but we speculate that the inflow anisotropy is much higher in GX 31 than in Sco X-1, resulting in a higher local radiation pressure, i.e. bulk suppression.
| Source | Radio flux | Hard tail flux | |
|---|---|---|---|
| (mJy) | 10-11 erg s-1 cm-2 | ||
| Z sources | |||
| Sco X–1 | 18 | ||
| GX 172 | 1.9 | ||
| GX 3492 | 1.15 | ||
| Cyg X–2 | 1.7 | ||
| GX 5–1 | 1.9 | ||
| GX 3400 | 2 | ||
| Atolls | |||
| GX 91 | 0.2 | 0.75 | |
| GX 99 | 0.2 | 1.72 | |
| GX 31 | 0.3 | 0.43 | |
| GX 131 | 1.74 |

4.2 The radio emission - hard X-ray tail connection
In the scenario proposed in the previous Section there is a clear connection between the X-ray spectral states and the radio emission: low/hard states are associated to weak radio emission, the radio emission increases in the intermediate state and then is quenched in the very soft state.
This trend is clearly met in the observations. We can imagine a continuous ”accretion line” increasing from Atoll sources (island state to banana) moving to the Z sources (horizontal, normal and flaring branch). Only a few low-dim Atoll sources (typical low/hard state) have been detected in the radio band because of their low radio luminosity (Fender & Hendry 2000; Migliari & Fender 2006). Z sources in their horizontal branch have a spectrum that corresponds to the intermediate state we defined here and indeed a clear radio emission has been reported in this state (Fender & Hendry 2000; Di Salvo & Stella 2002, and references therein). The normal and flaring branch of Z sources corresponds to the very soft state defined here where no radio emission is expected and in fact Z sources in these branches have a severely reduced radio emission, if any.
Z sources are much brighter radio emitters than Atolls and GX 131 has an important radio emission, thus behaves like a Z (Fender & Hendry 2000; Migliari & Fender 2006). In average, unlike bright Atolls, Z sources have a hard tail besides the thermal Comptonisation by an optically thick plasma of 3 keV (Di Salvo & Stella 2002, and this work); GX 131 has a hard tail (this work), thus again behaves like a Z. We basically see that in GX 131, the link radio emission - hard X-ray tail (both ”against” its originally declared nature to be an Atoll source) reveals itself in a solid way.
Triggered by the GX 131 case, we compared the average radio emission of all the sources of our sample with the hard X-ray tail that appears on top of the 3 keV Comptonisation spectrum. We note that the hard X-rays from the two soft X-ray dim Atoll sources, H 1608–522 and H 1705–440, are mainly coming from Comptonisation of soft photons in a hot corona (i.e. the overall spectrum is hard, kTe 40 keV, see Table 2) and since we cannot disentangle the dominating thermal Comptonisation component from the dynamical (bulk) one, we do not include these two sources in the radio - hard tail study. Table 4 reports the average radio flux as derived by Fender & Hendry (2000) and Migliari & Fender (2006) and the 40–100 keV flux of the hard tails detected in this work. When a hard tail is detected, its 40–100 keV flux is computed after fixing the comptt normalization to zero. For the sources where a hard tail was not detected, we computed 3 upper limits (3 in the 40–100 keV range), assuming that all the flux in the 40–100 keV comes from the hard tail. Figure 7 is visualising the relation between the average radio and hard tail (40–100 keV) luminosities computed using the distances in Table 1. The correlation between the two is quite striking (Spearman rank order significance of 99.6%) and the upper limits are consistent with the trend. We note that we obtain a very good correlation (Spearman rank order significance 99.2%) also using the radio and hard tail fluxes instead of the luminosities. We chose to plot the luminosity correlation in order to show the intrinsic properties of the sources.
In Fig. 7 we have plotted the average radio and X-ray hard tail luminosities: the radio luminosities are the superposition of optically thick emission (compact jet) and optically thin flaring activity. The X-ray hard tail luminosities are the average of all hard tail states (from maximum to minimum strength). We are aware that these correlations are based on data that are not taken simultaneously, but they are all based on average fluxes that we can consider a good representation of the physics involved in these objects. For the sources where a hard tail has been observed, we compare the radio emission with what is left in the X-ray spectra of the sources once we remove the dominant Comptonisation component. In this respect, our detection of a hard tail in the spectrum of GX 131 is important: GX 131 has a similar X-ray flux (and luminosity) as the remaining bright Atoll sources (GX 31, GX 91, GX 99, see Table 1) but a much higher average radio and hard tail emission (Table 4), re-confirming the radio hard X-ray tail connection.
In the presence of a cut-off, the hard tail can be explained via Comptonisation of soft seed photons in the jet and/or in the corona. For the case where no cut-off is detected, many models have been proposed: Comptonisation by a hybrid (thermal non-thermal) corona (Coppi 1999), synchrotron emission from the electrons of the jet (Markoff et al. 2005) or bulk motion inflow (dynamical) Comptonisation (TMK96, used in this work).
The real test of any of these models can be done using the (variability) analysis of the power density spectrum (PDS) of the hard tail emission. The characteristic (break and QPO) frequencies of PDS do determine the geometric size of the configuration where the hard tail emission is formed. TS05 made this type of analysis for 4U 1728–34 and found evidence that the hard tails are formed in the compact Compton cloud with geometry changing from cylindrical-like in the low/hard state to the quasi-spherical one in the high/soft state. Note that the X-ray-radio correlation along with the QPO-radio correlation is well established in 4U 1728–34. TS05 presented an explanation of these correlations in the framework of an oscillation model using the observed correlations of QPO low frequencies and their ratio.
The correlation we find between the radio and hard X-ray tail emission suggests that the hard tail formation area and the source of energetic electrons, ultimately causing the radio emission, are closely connected. The most probable site of this configuration is the NS magnetosphere. It can be suggested that the open magnetic field lines of the NS magnetosphere are the base of the jet seen in the radio emission. An increasing accretion rate leads to a more efficient radio emission (low/hard state to intermediate state) up to a point where the extremely high accretion rate (very soft state) changes the configuration of the field lines and the radio emission is quenched.
Acknowledgements.
The authors thank A. Segreto and C. Ferrigno for the useful cross checks in the analysis phase. AP thanks M. R. Gaber, B. E. O’Neel and G. A. Wendt III for their precious contribution to the development of post-processing tools. AP, AB and SM acknowledge the Italian Space Agency financial and programmatic support via contract I/R/046/04.References
- Asai et al. (1994) Asai, K., Dotani, T., Mitsuda, K., et al. 1994, PASJ, 46, 479
- Barret (2001) Barret, D. 2001, Advances in Space Research, 28, 307
- Barret & Olive (2002) Barret, D. & Olive, J.-F. 2002, ApJ, 576, 391
- Barret et al. (2000) Barret, D., Olive, J. F., Boirin, L., et al. 2000, ApJ, 533, 329
- Christian & Swank (1997) Christian, D. J. & Swank, J. H. 1997, ApJS, 109, 177
- Coppi (1999) Coppi, P. S. 1999, in ASP Conf. Ser. 161: High Energy Processes in Accreting Black Holes, ed. J. Poutanen & R. Svensson
- D’Amico et al. (2001) D’Amico, F., Heindl, W. A., Rothschild, R. E., & Gruber, D. E. 2001, ApJ, 547, L147
- Di Salvo et al. (2002) Di Salvo, T., Farinelli, R., Burderi, L., et al. 2002, A&A, 386, 535
- Di Salvo et al. (2006) Di Salvo, T., Goldoni, P., Stella, L., et al. 2006, Submitted to ApJ
- Di Salvo et al. (2001) Di Salvo, T., Robba, N. R., Iaria, R., et al. 2001, ApJ, 554, 49
- Di Salvo & Stella (2002) Di Salvo, T. & Stella, L. 2002, in Proc. of the XXXVIIth Rencontres de Moriond, The Gamma-Ray Universe, Ed. A. Goldwurm, Doris N. Neumann and Jean Tran Thanh Van, 67
- Falanga et al. (2006) Falanga, M., Gotz, D., Goldoni, P., et al. 2006, A&Ain press [arXiv:astro-ph/0607330]
- Farinelli et al. (2005) Farinelli, R., Frontera, F., Zdziarski, A. A., et al. 2005, A&A, 434, 25
- Fender & Hendry (2000) Fender, R. P. & Hendry, M. A. 2000, MNRAS, 317, 1
- Ford et al. (2000) Ford, E. C., van der Klis, M., Méndez, M., et al. 2000, ApJ, 537, 368
- Goldwurm et al. (2003) Goldwurm, A., David, P., Foschini, L., et al. 2003, A&A, 411, L223
- Hasinger & van der Klis (1989) Hasinger, G. & van der Klis, M. 1989, A&A, 225, 79
- Homan et al. (1998) Homan, J., van der Klis, M., Wijnands, R., Vaughan, B., & Kuulkers, E. 1998, ApJ, 499, L41
- Homan et al. (2004) Homan, J., Wijnands, R., Rupen, M. P., et al. 2004, A&A, 418, 255
- Iaria et al. (2004) Iaria, R., Di Salvo, T., Robba, N. R., et al. 2004, ApJ, 600, 358
- Iaria et al. (2005) Iaria, R., di Salvo, T., Robba, N. R., et al. 2005, A&A, 439, 575
- Kong et al. (2006) Kong, A. K. H., Charles, P. A., Homer, L., Kuulkers, E., & O’Donoghue, D. 2006, MNRAS, 368, 781
- Lavagetto et al. (2004) Lavagetto, G., Iaria, R., di Salvo, T., et al. 2004, Nuclear Physics B Proceedings Supplements, 132, 616
- Lebrun et al. (2003) Lebrun, F., Leray, J. P., Lavocat, P., et al. 2003, A&A, 411, L141
- Markoff et al. (2005) Markoff, S., Nowak, M. A., & Wilms, J. 2005, ApJ, 635, 1203
- Migliari & Fender (2006) Migliari, S. & Fender, R. P. 2006, MNRAS, 366, 79
- Oosterbroek et al. (2001) Oosterbroek, T., Barret, D., Guainazzi, M., & Ford, E. C. 2001, A&A, 366, 138
- Paizis et al. (2005) Paizis, A., Ebisawa, K., Tikkanen, T., et al. 2005, A&A, 443, 599
- Poutanen & Svensson (1996) Poutanen, J. & Svensson, R. 1996, ApJ, 470, 249
- Rodriguez et al. (2006) Rodriguez, J., Shaw, S. E., & Corbel, S. 2006, A&A, 451, 1045
- Schulz et al. (1989) Schulz, N. S., Hasinger, G., & Truemper, J. 1989, A&A, 225, 48
- Shaposhnikov & Titarchuk (2006) Shaposhnikov, N. & Titarchuk, L. 2006, ApJ, 643, 1098
- Sidoli et al. (2006) Sidoli, L., Paizis, A., Bazzano, A., & Mereghetti, S. 2006, A&A in press [arXiv:astro-ph/0609221]
- Titarchuk (1994) Titarchuk, L. 1994, ApJ, 434, 570
- Titarchuk & Fiorito (2004) Titarchuk, L. & Fiorito, R. 2004, ApJ, 612, 988
- Titarchuk et al. (1996) Titarchuk, L., Mastichiadis, A., & Kylafis, N. D. 1996, A&AS, 120, 171
- Titarchuk et al. (1997) Titarchuk, L., Mastichiadis, A., & Kylafis, N. D. 1997, ApJ, 487, 834
- Titarchuk & Shaposhnikov (2005) Titarchuk, L. & Shaposhnikov, N. 2005, ApJ, 626, 298
- Ubertini et al. (2003) Ubertini, P., Lebrun, F., Di Cocco, G., et al. 2003, A&A, 411, L131
- Vilhu et al. (2006) Vilhu, O., Paizis, A., Hannikainen, D., et al. 2006, in prep.
- Winkler et al. (2003) Winkler, C., Courvoisier, T. J.-L., Di Cocco, G., et al. 2003, A&A, 411, L1
- Zhang et al. (1996) Zhang, S. N., Harmon, B. A., Paciesas, W. S., et al. 1996, A&AS, 120, 279