THE DEPENDENCE OF GALAXY TYPE ON HOST HALO MASS
We examine the relation between galaxy properties and environment in the SDSS DR2, quantifying environment in terms of the mass of the host halo, which is obtained with a new iterative group finder. We find that galaxy type fractions scale strongly and smoothly with halo mass, but, at fixed mass, not with luminosity. We compare these findings with the semi-analytical galaxy formation model of Croton et al. (2006). The discrepancies we find can be explained with an oversimplified implementation of strangulation, the neglect of tidal stripping, and shortcomings in the treatments of dust extinction and/or AGN feedback.
1 Introduction
It is well established that there are two different types of galaxies in the local universe: early type galaxies which have red colours, low star formation rates and high central concentrations, and late type galaxies which have blue colours, are actively forming stars and have relatively low central concentrations (e.g. Strateva et al. 2001, Blanton et al. 2003). These two distinct classes of galaxies are found in different environments: The abundance of early type galaxies increases with density (Dressler 1980) and towards the center of galaxy groups and clusters (Whitmore et al. 1993), while the opposite applies to late type galaxies.
Numerous studies have reported that galaxy properties only correlate with environment above a characteristic surface density, roughly corresponding to that at the perimeter of a cluster or group (e.g. Lewis et al. 2002). Consequently, it has been argued that group-specific processes play a dominant role in establishing a bimodal distribution of galaxies. However, all these studies parameterize ‘environment’ through the projected number density of galaxies above a given magnitude limit. Typically this number density, indicated by , is measured using the projected distance to the th nearest neighbor. However, the physical meaning of itself depends on the environment: in clusters, where the number of galaxies is much larger than , measures a local number density, which is a sub-property of the cluster. However, in low-density environments, which are populated by haloes which typically contain only one or two galaxies, measures a much more global density, covering a scale that is considerably larger than the halo in which the galaxy resides. This ambiguity severely complicates a proper interpretation of the various correlations between environment and galaxy properties. Clearly, a less ambiguous and more physical environment indicator is the mass of the halo in which the galaxy resides. Here we describe the construction of a SDSS group catalogue (Section 2), which we use to analyze how galaxy type depends on host halo mass (Section 3). In Section 4 we compare these findings to a recent semi-analytical model of galaxy formation in order to constrain mechanisms that cause a quenching of star formation.
2 Methodology
2.1 The Data Set
The data used in our analysis is taken from the Sloan Digital Sky Survey DR2 (SDSS). In particular, we use the New York University Value-Added Galaxy Catalogue (NYU-VAGC, Blanton et al. 2005). From this catalogue we select all galaxies with an extinction corrected apparent magnitude , and with a redshift completeness of . In addition, we use estimates of the specific star formation rates (SSFR) obtained by Brinchmann et al. (2004). Throughout our analysis we use Petrosian magnitudes, -corrected to , and we adopt a Hubble constant of .
2.2 Defining Galaxy Types
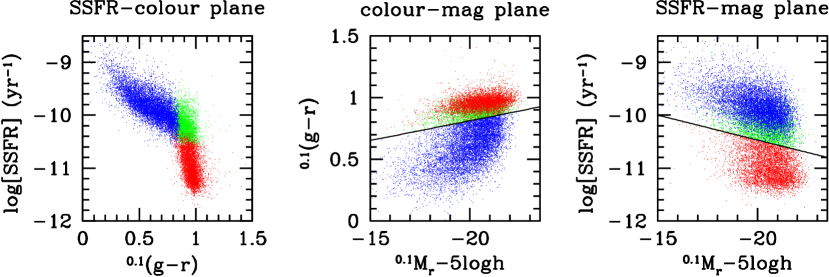
Since galaxies follow a relatively narrow relation between colour and SSFR, consisting of two overlapping branches (Fig. 1, left hand panel), we classify galaxies using both their SSFR and their -colour. Using the magnitude dependencies of the color- and SSFR bimodalities (shown as solid lines in the middle and right hand panels of Fig. 1), we split the galaxy population in three main types: ‘late-type’ galaxies, defined as being blue and active (blue dots, 48 percent of all galaxies), ‘early-type’ galaxies, defined as being red and passive (red dots, 31 percent of all galaxies), and ‘intermediate-type’ galaxies, defined as being red and active (green dots, 20 percent of all galaxies). The remaining one percent are blue and passive, and we do not consider this class in what follows.
2.3 Identification of Galaxy Groups
Galaxy groups are identified using a new, iterative group finder developed by Yang et al. (2005), which is optimized to group those galaxies together that belong to the same dark matter halo. Its performance has been tested in terms of completeness of true members and contamination by interlopers, using detailed mock galaxy redshift surveys. The average completeness of individual groups is percent and they contain only percent interlopers, which is a significant improvement with respect to the more conventional Friends-of-Friends group finders.
Group masses are estimated by matching the number density of groups sorted according to their total luminosity, with that of dark matter haloes sorted according to their mass. This makes the assumption that there is a one-to-one relation between total group luminosity and halo mass, and requires the halo mass function, which is cosmology dependent. Nevertheless, detailed tests have shown that this method of assigning masses to groups is more accurate than using the velocity dispersion of their member galaxies, especially for low mass groups (see Weinmann et al. 2006a for details).
Application of our group finder to the sample of SDSS galaxies described above yields a group catalogue of 53,229 systems with an estimated mass, containing a total of 92,315 galaxies. In what follows we refer to the brightest galaxy in each group as the ‘central’ galaxy, while all others are termed ‘satellites’.
3 Results: The Galaxy Type - Halo Mass Relation
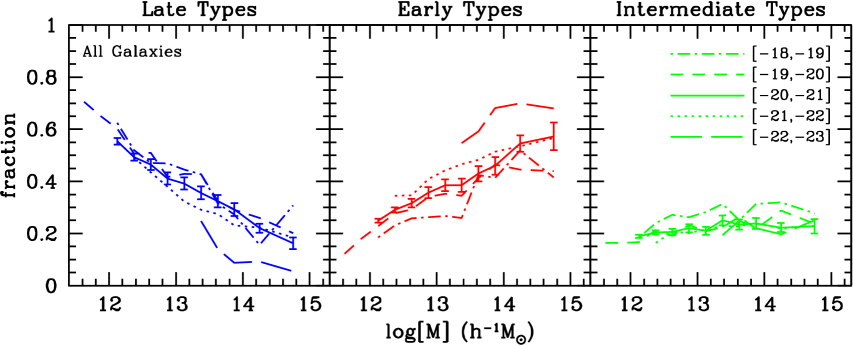
Fig. 2 plots the fractions of late types, early types and intermediate types as function of group mass. Results are shown for five different bins in absolute magnitude (different line-styles), as indicated. As expected, the fraction of late (early) types decreases (increases) with increasing halo mass, basically reflecting the well known morphology-density relation. Note, however, that at fixed halo mass there is virtually no luminosity dependence, indicating that the mass of the host halo is much more important for determining the galaxy type than the luminosity of the galaxy itself. This indicates that the well-known relation between galaxy type and luminosity (e.g. Baldry et al. 2004) is mainly a reflection of the fact that more luminous galaxies tend to live in more massive haloes.
Note also that the mass-dependence is remarkably smooth. In particular, there is no indication of any characteristic mass scale. This is contrary to several previous studies, who have argued that group-specific processes play a dominant role in establishing a bimodal distribution of galaxies. As discussed in Section 1, we belief that this owes to the ambiguity of the density indicator used in those previous studies.
Finally, we find no dependence of the intermediate type fraction on either group mass or galaxy luminosity. This has interesting implications. If the intermediate types consist of a mix of early and late types, their fractional contribution must be close to 50 percent at all luminosities, and in haloes of all masses, which seems somewhat contrived. More likely, the intermediates are actual transition objects, transiting from the ‘blue cloud’ to the ‘red sequence’, or vice versa. In this case, their observed fractions can teach us about the transition probabilities and durations. It remains to be seen whether these are consistent with predictions of galaxy formation models.
4 Comparison with a Semi-Analytic Model
A successful reproduction of the galaxy luminosity function, and of the bimodality in the galaxy distribution, requires a mechanism that can truncate star formation in massive haloes. Current models of galaxy formation consider two such truncation mechanisms: strangulation, which acts on satellite galaxies, and AGN feedback, which predominantly affects central galaxies. The efficiencies with which these two processes operate set the blue fraction of galaxies, , as function of galaxy luminosity, , and halo mass, . We now compare the blue fractions obtained from our SDSS group catalogue with those obtained from the semi-analytical model of Croton et al. 2006 (hereafter C06). This model includes ’radio mode’ AGN feedback and is very successful in reproducing a wide range of global properties of the galaxy distribution.
In order to carry out a fair comparison, we construct a mock SDSS from the SAM, to which we apply our group finder. The resulting mock group catalogue, hereafter ‘SAM-GC’, can be compared to our SDSS group catalogue on a one-to-one basis. Contrary to the analysis above, where we classified galaxies based on both their color and their SSFR, here we only split galaxies in red and blue sub-classes, using the colour cut shown in the middle panel of Fig. 1.
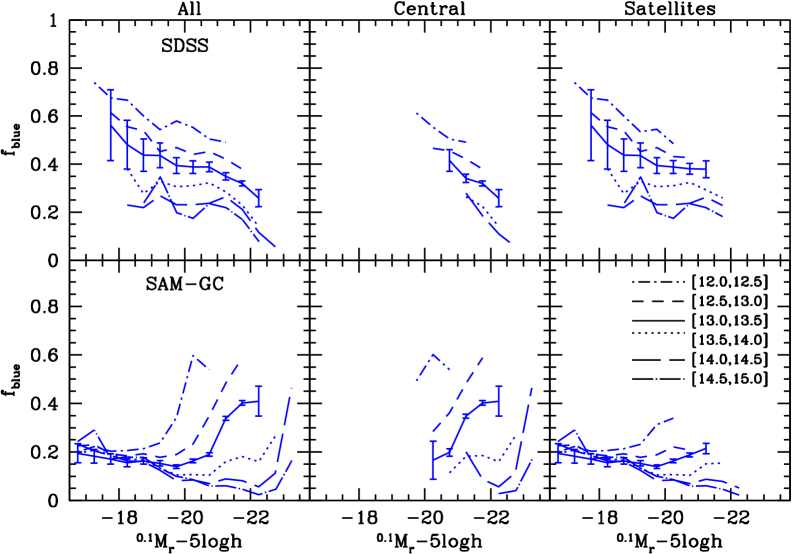
We split the SDSS and SAM group catalogues in six logarithmic mass bins and determine how the blue fractions in each of these bins depend on luminosity. The results for the SDSS group catalogue are shown in the upper panels of Fig. 3. The upper left-hand panel shows the result for all galaxies (centrals plus satellites). In each mass bin, the blue fraction decreases with increasing luminosity, but only very mildly. At fixed luminosity, however, there is a clear mass dependence, with the blue fraction decreasing with increasing halo mass. This is consistent with Fig. 2 and indicates that the colour of a galaxy is more strongly determined by the mass of the halo in which it resides than by its own luminosity. The middle and right hand panels in the upper row show the blue fractions of centrals and satellites in the SDSS.
Comparing these blue fractions with those obtained from the SAM-GC (lower panels) one notices two problems: First of all, the SAM predicts blue satellite fractions that are much too low, especially for low mass haloes. This suggests that ‘strangulation’, as incorporated in the SAM, is much too efficient. In virtually all semi-analytical models, strangulation is included and modeled in the same way: as soon as a galaxy becomes a satellite galaxy its hot gas reservoir is ‘stripped’ (see Larson et al. 1980). Consequently, after a delay time in which the new satellite consumes its cold gas, its star formation is truncated. The results presented here suggest that this formulation is too crude. In particular, strangulation is modeled without any explicit halo mass dependence, which explains why the blue fraction of satellite galaxies in the SAM is virtually independent of halo mass. In the SDSS, however, the blue satellite fraction decreases with increasing halo mass, suggesting a clear mass scaling of the strangulation efficiency.
The second problem with the SAM is that it predicts that the blue fraction of centrals increases with luminosity in haloes of fixed mass, opposite to what is seen in the data. As shown in Weinmann et al. (2006b), a related problem is that the fraction of bright, blue central galaxies is too high in the SAM. Both of these problems could be due to an oversimplified treatment of dust extinction (see C06) and/or a problem with the treatment of AGN feedback in the model.
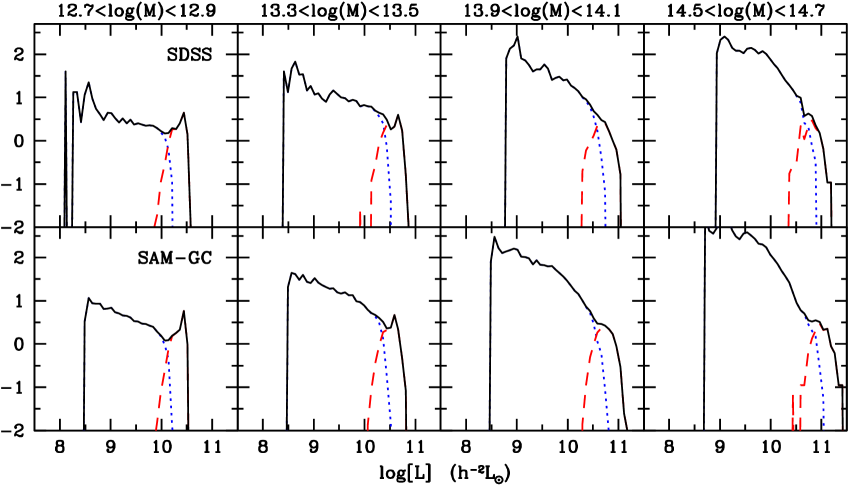
Finally, Fig. 4 shows the conditional luminosity function (CLF), which specifies the average number of galaxies of a given luminosity per group. Results are shown for four group masses (indicated at the top) and for both the SDSS and SAM group catalogues. The overall agreement is remarkable, although in the highest mass bin the SAM significantly overpredicts the abundance of faint satellites. This might be due to the neglect of tidal stripping in the SAM, which could destroy, or at least dim faint satellite galaxies to the extent that they are not detectable anymore.
5 Summary
Using a group catalogue based on the SDSS DR2, we have derived the relations between galaxy type fractions and group masses. We find that the fraction of late type galaxies decreases smoothly with group mass and is nearly independent of galaxy luminosity at fixed group mass. We also find that the fraction of intermediate type galaxies is independent of both group mass and luminosity. These relations provide a useful test-bed for models of galaxy formation. As an example, we have compared our findings to the semi-analytic model of Croton et al (2006), which successfully matches many global properties of the local galaxy population. However, when it comes to the properties as function of halo mass, we find several significant discrepancies between model and data. First and foremost, the SAM predicts too many red satellites, indicating that the strangulation treatment in the SAM is far too efficient. Second, the number of faint satellites in the SAM is overestimated, probably due to the neglect of tidal stripping in the model. Finally, the fraction of bright, blue central galaxies is too high in the SAM, which could be due to a too simple dust model or also due to problems with the implementation of AGN feedback. Clearly, the data presented here regarding the relations between galaxy type and halo mass provide important constraints on galaxy formation models. We hope these data will prove useful to test and calibrate future models of galaxy formation and in particular to discriminate between various models for AGN feedback and other star formation truncation mechanisms. More details, and the actual data, can be found in Weinmann et al. (2006a,b).
References
References
- [1] I.K. Baldry, K.Glazebrook, J.Brinkmann, Ž. Ivezić, R.H. Lupton, R.C. Nichol, A.S. Szalay, ApJ, 600,681 (2004)
- [2] M.R. Blanton et al, ApJ, 594, 186 (2003)
- [3] M.R. Blanton et al, AJ, 129, 2562 (2005)
- [4] J. Brinchmann, S. Charlot, S.D.M White, C.Tremonti, G. Kauffmann, T. Heckman, J. Brinkmann, MNRAS, 353, 713 (2004)
- [5] D. Croton et al, MNRAS, 365, 11 (2006) (C06)
- [6] A. Dressler, ApJ, 236, 351 (1980)
- [7] R.B. Larson, B.M. Tinsley, C.N. Caldwell, 1980, ApJ, 237, 692
- [8] I. Lewis et al, MNRAS, 334, 673 (2002)
- [9] I. Strateva et al, ApJ, 122, 1861 (2001)
- [10] S.M Weinmann, F.C. van den Bosch, X. Yang, H.J. Mo, MNRAS, 366, 2 (2006a)
- [11] S.M. Weinmann, F.C. van den Bosch, X. Yang, H.J. Mo, D.J. Croton, B. Moore(2006b), preprint (astro-ph/0606458)
- [12] B.C. Whitmore, D.M Gilmore, C. Jones, ApJ, 407, 489 (1993)
- [13] X. Yang, H.J Mo, F.C van den Bosch, Y.P. Jing, MNRAS, 356, 1293 (2005)